. 2023 Apr 24;8(8):e160978.
doi: 10.1172/jci.insight.160978.

β-Catenin signaling in alveolar macrophages enhances lung metastasis through a TNF-dependent mechanism

Affiliations

β-Catenin signaling in alveolar macrophages enhances lung metastasis through a TNF-dependent mechanism

Elliot D Kramer et al. JCI Insight. .

Abstract

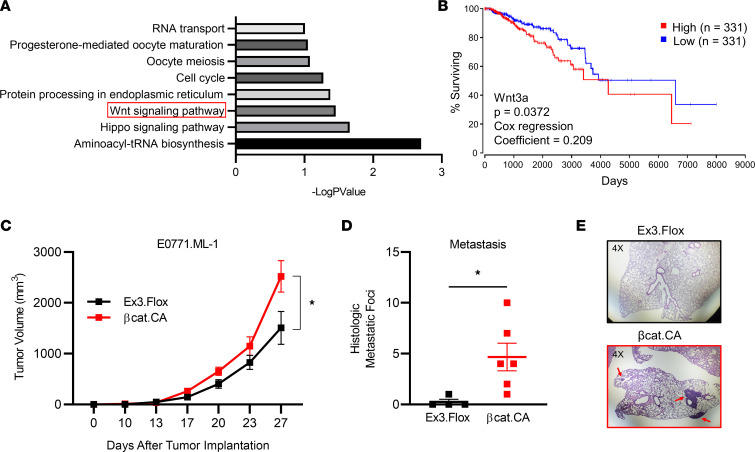
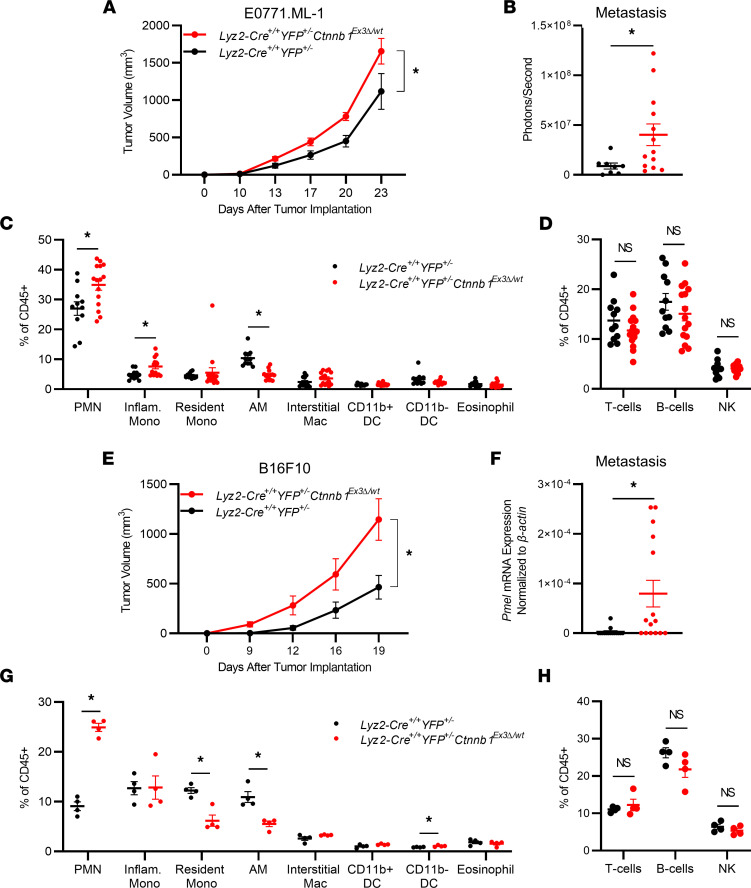
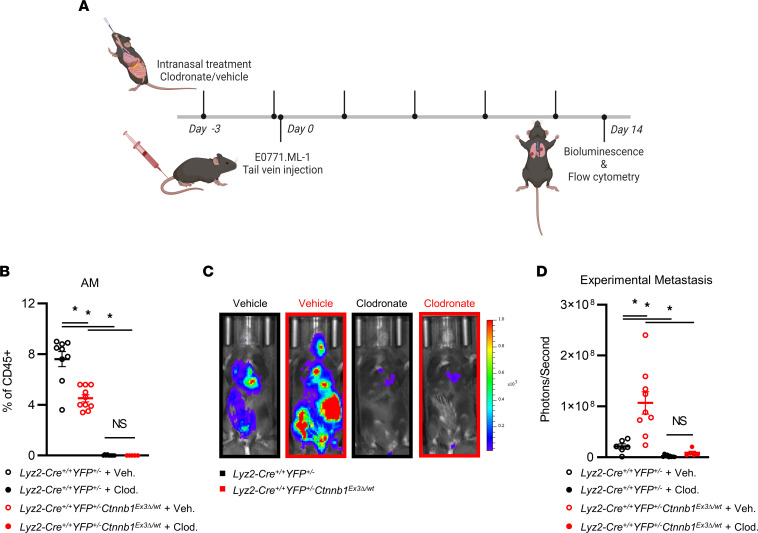
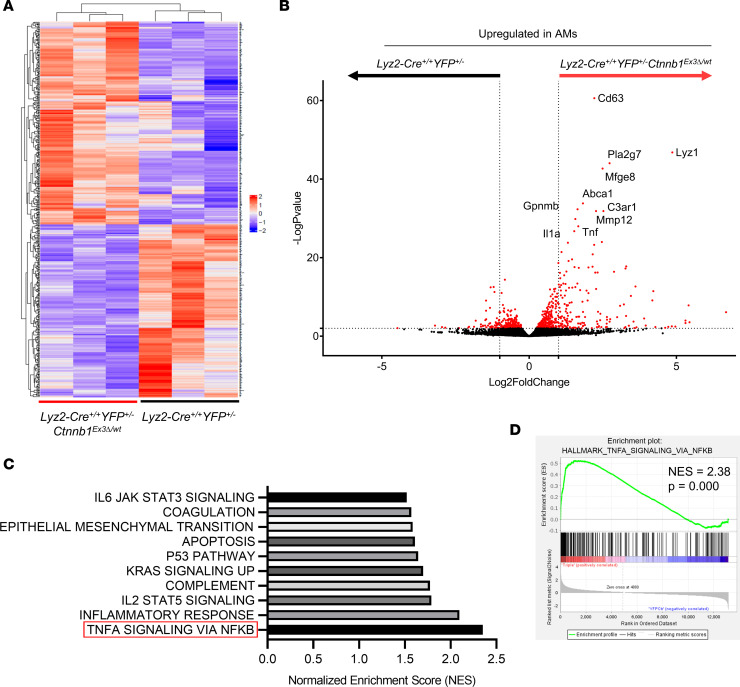
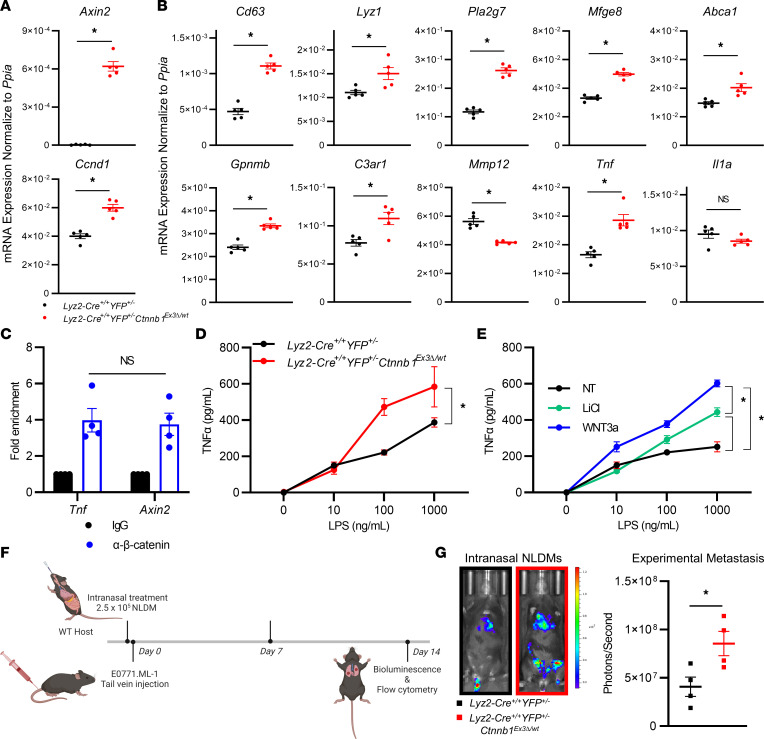
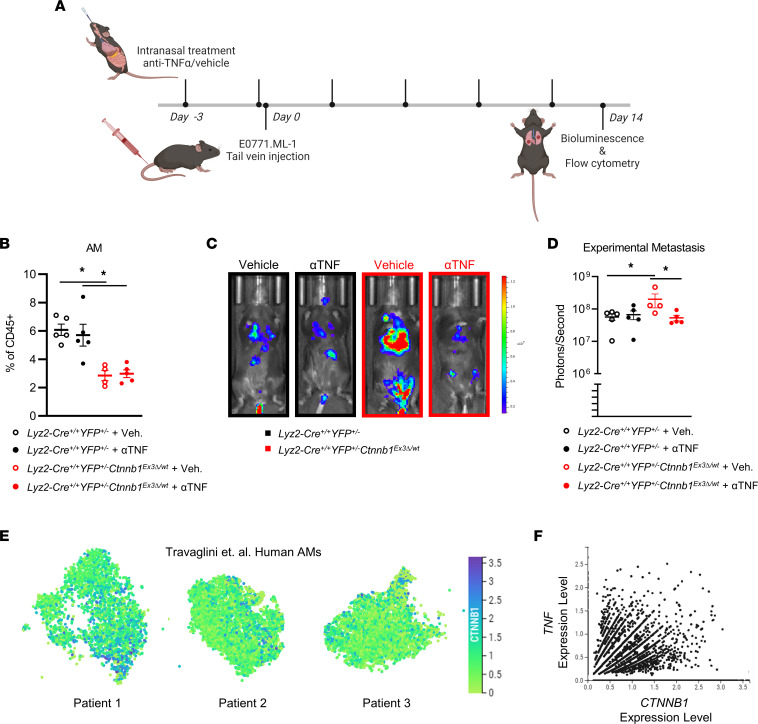
The main cause of malignancy-related mortality is metastasis. Although metastatic progression is driven by diverse tumor-intrinsic mechanisms, there is a growing appreciation for the contribution of tumor-extrinsic elements of the tumor microenvironment, especially macrophages, which correlate with poor clinical outcomes. Macrophages consist of bone marrow-derived and tissue-resident populations. In contrast to bone marrow-derived macrophages, the transcriptional pathways that govern the pro-metastatic activities of tissue-resident macrophages (TRMs) remain less clear. Alveolar macrophages (AMs) are a TRM population with critical roles in tissue homeostasis and metastasis. Wnt/β-catenin signaling is a hallmark of cancer and has been identified as a pathologic regulator of AMs in infection. We tested the hypothesis that β-catenin expression in AMs enhances metastasis in solid tumor models. Using a genetic β-catenin gain-of-function approach, we demonstrated that (a) enhanced β-catenin in AMs heightened lung metastasis; (b) β-catenin activity in AMs drove a dysregulated inflammatory program strongly associated with Tnf expression; and (c) localized TNF-α blockade abrogated this metastatic outcome. Last, β-catenin gene CTNNB1 and TNF expression levels were positively correlated in AMs of patients with lung cancer. Overall, our findings revealed a Wnt/β-catenin/TNF-α pro-metastatic axis in AMs with potential therapeutic implications against tumors refractory to the antineoplastic actions of TNF-α.

Keywords: Breast cancer; Macrophages; Mouse models; Oncology.


Conflict of interest statement

Conflict of interest: The authors have declared that no conflict of interest exists.

Figures

Figure 1
Figure 1. β-Catenin constitutive activation in myeloid cells promotes primary tumor growth and spontaneous lung metastasis in the E0771.ML-1 model.
(A) Kyoto Encyclopedia of Genes and Genomes pathway analysis of genes associated with poor overall survival in breast cancer patients from TCGA database, identified through OncoLnc by positive Cox regression score. (B) Correlation between high and low Wnt3a-expressing breast cancer and OS, based on upper and lower tertile cutoffs. (C) Primary tumor growth of orthotopically implanted E0771.ML-1 tumor cells in β-catenin–activated C57BL/6 Lyz2-Cre+/+ Ctnnb1Ex3Δ/Δ (βcat.CA) or Ctnnb1Ex3Δ/Δ floxed control (Ex3.Flox) C57BL/6 mice. (D) Spontaneous histologic metastatic foci of E0771.ML-1 tumor–bearing mice at endpoint. (E) H&E-stained lung sections from mice in D representative of 2 independent experiments; red arrows highlight E0771.ML-1 metastatic foci at 4× original magnification. (C and D) The mean ± SEM values are shown and represent 4–6 individual mice. Statistical analysis is based on 2-way ANOVA (C) and 2-tailed t test (D); * = P < 0.05.
Figure 2
Figure 2. Heterozygous β-catenin gain of function in Lyz2-Cre reporter mice maintains an enhanced tumor growth and metastatic phenotype in TNBC and melanoma models.
(A) Primary tumor growth of orthotopically implanted E0771.ML-1 tumor cells in Lyz2-Cre+/+ YFP+/– Ctnnb1Ex3Δ/wt and Lyz2-Cre+/+ YFP+/– C57BL/6 mice. (B) Bioluminescence of ex vivo–imaged lungs in A. (C) Proportion of myeloid and (D) lymphoid populations from dissociated whole lungs from A, gated as described in Supplemental Figure 2D and labeled as in C. (E) Primary tumor growth of orthotopically implanted B16F10 cells in Lyz2-Cre+/+ YFP+/– Ctnnb1Ex3Δ/wt and Lyz2-Cre+/+ YFP+/– C57BL/6 mice. (F) mRNA expression of Pmel at endpoint from digested lungs from E as labeled. (G) Proportion of myeloid and (H) lymphoid populations from dissociated whole lungs from E; data are representative of 2 independent experiments, gated as in Supplemental Figure 2D. (AH) In all panels the mean ± SEM values are shown and represent 8–15 (AD), 13–15 (E and F), or 4 (G and H) individual mice. Statistical analysis is based on 2-way ANOVA (A and E) and 2-tailed t tests (BD and FH); * = P < 0.05.
Figure 3
Figure 3. Targeted AM depletion ameliorates genotype-specific metastatic phenotype in a primary tumor-independent manner.
(A) Treatment schedule for Lyz2-Cre+/+ YFP+/– Ctnnb1Ex3Δ/wt and Lyz2-Cre+/+ YFP+/– mice treated with clodronate liposomes or vehicle control until endpoint 14 days after tail vein injection of E0771.ML-1 cells. (B) Relative abundance of lung CD45+Ly6GCD24CD64+CD11bloCD11c+ AMs at endpoint as described in A. (C) Bioluminescence images, representative of 3 independent experiments, and (D) quantification of mice represented in C at endpoint. (B and D) The mean ± SEM values are shown and represent 5–9 individual mice. Statistical analysis is based on 1-way ANOVA with the Holm-Šídák correction applied for multiple comparisons (B and D); * = P < 0.05.
Figure 4
Figure 4. Comparative transcriptomic analysis of the activated β-catenin transcriptional program in AMs.
(A) Heatmap of top 500 DEGs in CD45+Ly6GSSChiCD11c+Lyz2-EYFP+ AMs flow-sorted from the single-cell–dissociated lungs of non–tumor-bearing Lyz2-Cre+/+ YFP+/– Ctnnb1Ex3Δ/wt and Lyz2-Cre+/+ YFP+/– mice, as described in Supplemental Figure 4A; n = 3, Wald’s test with Benjamini-Hochberg correction. (B) DEGs in AMs of Lyz2-Cre+/+ YFP+/– Ctnnb1Ex3Δ/wt and Lyz2-Cre+/+ YFP+/– mice, cutoff of –logP ≥ 2 and 1 ≤ log2FC ≤ –1 highlighted in red and top 10 genes upregulated in Lyz2-Cre+/+ YFP+/– Ctnnb1Ex3Δ/wt relative to Lyz2-Cre+/+ YFP+/– mice labeled. (C) Ranked normalized enrichment scores (NES) from Gene Set Enrichment Analysis (GSEA) of Hallmark gene sets significantly upregulated in AMs of Lyz2-Cre+/+ YFP+/– Ctnnb1Ex3Δ/wt relative to Lyz2-Cre+/+ YFP+/– mice; NES ≥ 2 are highlighted. (D) GSEA plot for HALLMARK_TNFA_SIGNALING_VIA_NFKB gene set from C.
Figure 5
Figure 5. β-Catenin activity in NLDMs drives Tnf expression, and intranasal adoptive transfer of NLDMs with constitutively active β-catenin increases experimental metastasis.
(A) Lyz2-Cre+/+ YFP+/– Ctnnb1Ex3Δ/wt and Lyz2-Cre+/+ YFP+/– NLDM reverse transcription quantitative PCR (RT-qPCR) of Axin2 and Ccnd1. (B) NLDMs derived from Lyz2-Cre+/+ YFP+/– Ctnnb1Ex3Δ/wt and Lyz2-Cre+/+ YFP+/– mice analyzed by RT-qPCR for the top 10 upregulated DEGs identified in Figure 4B: Cd63, Lyz1, Pla2g7, Mfge8, Abca1, Gpnmb, C3ar1, Mmp12, Tnf, and Il1a. (C) CUT&RUN assay assessed by RT-qPCR for regions –408 and –340 of the Tnf and Axin2 genes, respectively, following incubation with anti–β-catenin antibody, and the data reported as fold enrichment over IgG background. (D) TNF-α ELISA using supernatants of Lyz2-Cre+/+ YFP+/– Ctnnb1Ex3Δ/wt or Lyz2-Cre+/+ YFP+/––derived NLDMs treated with or without LPS for 24 hours. (E) TNF-α ELISA of Lyz2-Cre+/+ YFP+/– –derived NLDMs ± 10 mM LiCl or 100 ng/mL recombinant Wnt3a. (F) Treatment schedule for intranasal NLDM adoptive transfer in WT hosts injected with E0771.ML-1 cells via the tail vein 36 hours after treatment. (G) Bioluminescence images and quantification of data at endpoint, representative of 4 individual mice. In all data panels the mean ± SEM values are shown and represent 5 (A and B) or 4 (G) individual mice, technical quadruplicate of 3 pooled biological samples (C), or biological triplicates (D and E). Statistical analysis is based on 2-tailed t tests (AC and G), 2-way ANOVA (D and E); * = P < 0.05.
Figure 6
Figure 6. Intranasal delivery of anti–TNF-α neutralizing antibody rescues the pro-metastatic effects of AM β-catenin activation, and TNF expression correlates with CTNNB1 in human AMs.
(A) Schematic of intranasal anti–TNF-α treatments in Lyz2-Cre+/+ YFP+/– Ctnnb1Ex3Δ/wt or Lyz2-Cre+/+ YFP+/– hosts injected with E0771.ML-1 via tail vein 36 hours after treatment. (B) Relative abundance of CD45+Ly6GCD24CD64+CD11bloCD11c+ AMs of E0771.ML-1 tumor–bearing mice described in A. (C) Bioluminescence images, representative of 2 independent experiments and (D) quantification of data at endpoint represented. (E) Expression of CTNNB1 in human AMs from Travaglini et al. by scRNA-Seq (European Genome-phenome Archive [EGA], EGAS00001004344); n = 3. (F) Scatterplot of TNF and CTNNB1 expression from D; n = 3, pooled; positive Pearson correlation P = 0.0470. (B and D) The mean ± SEM values are shown and represent 4–5 individual mice. Statistical analysis is based on 1-way ANOVA with the Holm-Šídák correction applied for multiple comparisons (B and D); * = P < 0.05.

References

    1. Dillekas H, et al. Are 90% of deaths from cancer caused by metastases? Cancer Med. 2019;8(12):5574–5576. doi: 10.1002/cam4.2474. - DOI - PMC - PubMed
    1. Wu S, et al. Evaluating intrinsic and non-intrinsic cancer risk factors. Nat Commun. 2018; 28(1):3490. doi: 10.1038/s41467-018-05467-z. - DOI - PMC - PubMed
    1. Feng YX, et al. Breast cancer development and progression: risk factors, cancer stem cells, signaling pathways, genomics, and molecular pathogenesis. Genes Dis. 2018;5(2):77–106. doi: 10.1016/j.gendis.2018.05.001. - DOI - PMC - PubMed
    1. Roskoski R. Properties of FDA-approved small molecule protein kinase inhibitors. Pharmacol Res. 2019;144:19–50. doi: 10.1016/j.phrs.2019.03.006. - DOI - PubMed
    1. Stathis A, Bertoni F. BET proteins as targets for anticancer treatment. Cancer Discov. 2018;8(1):24–36. doi: 10.1158/2159-8290.CD-17-0605. - DOI - PubMed

Publication types