. 2023 Apr 24;8(8):e145811.
doi: 10.1172/jci.insight.145811.

Osteopontin promotes age-related adipose tissue remodeling through senescence-associated macrophage dysfunction

Affiliations

Osteopontin promotes age-related adipose tissue remodeling through senescence-associated macrophage dysfunction

Daigo Sawaki et al. JCI Insight. .

Abstract

Adipose tissue macrophages (ATMs) play an important role in obesity and inflammation, and they accumulate in adipose tissue (AT) with aging. Furthermore, increased ATM senescence has been shown in obesity-related AT remodeling and dysfunction. However, ATM senescence and its role are unclear in age-related AT dysfunction. Here, we show that ATMs (a) acquire a senescence-like phenotype during chronological aging; (b) display a global decline of basic macrophage functions such as efferocytosis, an essential process to preserve AT homeostasis by clearing dysfunctional or apoptotic cells; and (c) promote AT remodeling and dysfunction. Importantly, we uncover a major role for the age-associated accumulation of osteopontin (OPN) in these processes in visceral AT. Consistently, loss or pharmacologic inhibition of OPN and bone marrow transplantation of OPN-/- mice attenuate the ATM senescence-like phenotype, preserve efferocytosis, and finally restore healthy AT homeostasis in the context of aging. Collectively, our findings implicate pharmacologic OPN inhibition as a viable treatment modality to counter ATM senescence-mediated AT remodeling and dysfunction during aging.

Keywords: Adipose tissue; Aging; Extracellular matrix; Immunology; Macrophages.


Figures

Figure 1
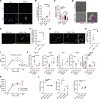
Figure 1. Aging promotes accumulation of senescent cells in visceral adipose tissue.
(A) Representative luminescent images from 3- and 12-month-old p16-luciferase mice. (B) Representative immunostaining of VAT (p16/p53/p21, green; wheat germ agglutinin (WGA), red; DAPI, blue), arrowheads indicate green-positive cells; scale bar: 50 μm. (C) Quantification of positive cells (green) in the percentage of total cell number (DAPI, p16, n = 5 mice/group; p21, n = 4 mice/group; p53, n = 3 mice/group). (D) EdU+ cells in VAT-derived CD11b+ macrophages, CD3+ lymphocytes, and PDGFRa+ preadipocytes of 3- and 12-month-old WT mice (n = 4/group). (E) Discriminative power of qRT-PCR results for transcript levels of interest. Grouped in 5 ad hoc categories in relation to aging and presented in decreasing order of the most discriminant parameter in each category. (F) The most informative gene expression parameters in relation to aging, and the direction (i.e., positive or negative) of their association with aging. (G) Representative immunofluorescence of VAT from 3- and 12-month-old WT mice (p16, green; OPN, red; WGA, white; DAPI, blue); arrowheads indicate p16+ cells; scale bar: 50 μm (selected from n = 3/condition). (H) Representative images of OPN/Mac3 (macrophages marker) stained VAT derived from WT mice aged between 2 and 24 months as indicated; scale bar: 50 μm (selected from n = 3/condition). Data are presented as original images (A, B, G, and H), individual values with mean ± SEM and analyzed with 2-tailed unpaired Student’s t test (C and D) or discriminative power analysis as described in the Methods (E and F); ns, nonsignificant, *P < 0.05, **P < 0.01, ***P < 0.001.
Figure 2
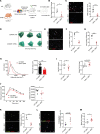
Figure 2. Osteopontin is a critical regulator of adipose tissue and macrophage senescence.
(A) Representative SA-β-Gal staining of VAT from 12-month-old WT and OPN–/– mice (selected from n = 5/group). (B) Immunoblot of VAT from 12-month-old WT and OPN–/– mice. Separate loading controls (β-actin) are presented due to the noncontemporaneous run of the same lysates. (C) Representative immunofluorescence of VAT (arrowheads: p16, p53, and p21). (D) Percentage of p16+ cells (n = 5/group, same data from the aged WT as in Figure 1). Representative immunofluorescence (E) and quantification (F) of p16+ in the percentage of CD68+ cells in VAT (n = 4/group). FACS gating strategy (G) and quantification (H) of p16+ in CD11b+ F4/80+ ATMs from VAT in indicated groups (n = 4/group). (I) Representative images and quantification (n = 5 mice/group) of p16 in VAT of 12-month-old WT treated with AA vs. vehicle (VEH); arrowheads: p16+ cells. (J) Representative images and quantification of p16+ in the percentage of CD68+ in VAT (n = 7–10 mice/group). Arrowheads: double-positive ATMs. (K) Mean fluorescent intensity ratio (MFIR) of OPN receptor expression in CD11b+ F4/80+ ATMs from VAT of 3- and 12-month-old WT mice (n = 3–7 mice/group). (L) OPN receptor expression in CD11b+ F4/80+ ATMs from BMDMs of 3- and 12-month-old WT mice (n = 6–7 mice/group). SA-β-Gal (M) and p16 (N) staining in BMDMs (from 3-month-old WT mice) treated with recombined OPN protein or VEH ± CD44 blocking antibody (n = 8–9/condition). (O) Protocol of in vivo implantation of Matrigel enriched with OPN protein or VEH. (P) Representative immunofluorescence of excised Matrigel after 14 days of implantation (selected from n = 3 mice/group). Quantification of relative CD68+ area (Q) and percentage of p16+ cells (R) (n = 3 mice/group). All scale bars: 50 μm. Data are presented as original images (A–C, E, G, I, J, M, N, and P) or individual values with mean ± SEM and analyzed with 2-tailed, unpaired Student’s t test (D, F, I–L, Q, and R) or 1-way ANOVA with Tukey’s post hoc test (F, H, M, and N); ns, nonsignificant; *P < 0.05, **P < 0.01, ***P < 0.001, ****P < 0.0001.
Figure 3
Figure 3. Adipose tissue macrophages promote age-dependent VAT and metabolic abnormalities.
(A) Immune cell and monocyte/macrophage subpopulations in VAT of 3- and 12-month-old WT mice by FACS (n = 3–5/group). (B) Immune cell and macrophage subpopulations in VAT of 12-month-old WT and OPN–/– mice by FACS (n = 4–5/group). (C) Schematic protocol of liposome-clodronate (CLO-lip) treatment. (D) Representative CD68 immunofluorescence of VAT of 12-month-old WT mice treated with PBS or CLO (CD68, green; WGA, red; DAPI, blue), and quantification of positive cells (green) in the percentage of total cell number (DAPI; n = 4 mice/group). Arrowheads indicate CD68+ cells; scale bar: 50 μm. (E) Representative OPN Western blot analysis (with β-actin as loading control) and densitometric quantification (n = 3–4 mice/group) using protein lysates from VAT in 12-month-old WT mice treated with PBS or CLO. (F) Representative p16 immunofluorescence of VAT from 12-month-old WT mice treated with PBS or CLO (p16, green; WGA, red; DAPI, blue) and quantification of p16+ cells (green; n = 4 mice/group) in the percentage of total cells (DAPI); arrowheads indicate p16+ cells, scale bar = 50 μm. (G) Distribution and difference of adipocyte size in VAT derived from PBS- or CLO-treated 12-month-old WT mice. (H) Plasma adipokine levels by ELISA in PBS- or CLO-treated 12-month-old WT mice (n = 4–6 mice/group). (I and J) Glucose tolerance test (GTT) (I) and insulin tolerance test (ITT) (J), temporal plot and area under curve (AUC) analysis (n = 5–7 mice/group). Data are presented as original images (DF) or individual values with mean ± SEM and analyzed with 2-tailed, unpaired Student’s t test (A, B, and DJ); ns, nonsignificant; *P < 0.05, **P < 0.01, ***P < 0.001.
Figure 4
Figure 4. Role of OPN in age-related ATM dysfunction.
(A) Representative TUNEL/CD45 immunofluorescence of VAT from 3- and 12-month WT and OPN–/– mice. Green arrowheads, single TUNEL+ cells; white arrowheads, TUNEL/CD45 double-positive cells. (B) Quantification of colocalization of TUNEL+ and CD45+ cells in percentage of total cell number (n = 6 mice/group). (C) Quantification of the distance between TUNEL+ and CD45+ cells (arbitrary units [AU]). (D) Representative confocal images of TUNEL/CD68 labeling in fresh VAT of 12-month-old WT and OPN–/– mice (selected from n = 3 mice/group). (E) Representative cleaved caspase-3/CD45 immunofluorescence of VAT from 12-month WT and OPN–/– mice. Arrowheads, double-positive cells. (F) Quantification of colocalization of cleaved caspase-3 and CD45 in percentage of total CD45+ cell number (n = 3 mice/group). (G) Representative γH2AX/CD45 immunofluorescence of VAT from 12-month-old WT and OPN–/– mice. Green arrowheads, single γH2AX+ cells; white arrowheads, double-positive cells. (H) Quantification of colocalized γH2AX/CD45 double-positive cells in percentage of total CD45+ cell number (n = 3 mice/group). (I) FACS-based quantification of phagocytosis of pHrodo-labeled human leukemia cells as a function of time in BMDMs derived from 12-month-old WT and OPN–/– mice. Line plots denote chronological quantification of MFI of pHrodo green. (J) qRT-PCR analysis of senescence and efferocytosis-related gene expression in VAT of 3- and 12-month-old WT and OPN–/– mice (n = 4–7 mice/group). (K) FACS-based quantification of phagocytosis as a function of time in WT BMDMs treated with OPN protein vs. vehicle. (L) qRT-PCR analysis of efferocytosis-related gene expression in WT BMDMs treated with 2 doses of OPN protein (n = 4/condition). All scale bars: 50 μm. Data are presented as original images (A, D, E, and G) or individual values with mean ± SEM analyzed with 2-tailed, unpaired Student’s t test (F and H) or 1-way ANOVA with Bonferroni post hoc test (B, C, J, and L) or 2-way ANOVA (I and K); ns, nonsignificant; *P < 0.05, **P < 0.01, ***P < 0.001.
Figure 5
Figure 5. Transplantation of OPN-/- bone marrow rejuvenates VAT and improves metabolic function during aging.
(A) Protocol of BMT from WT or OPN–/– donor to WT recipient to evaluate the effect of OPN-deficient BMDMs in vivo. (B) qRT-PCR analysis of Spp1 (OPN) in VAT of WT recipients with WT or OPN–/– BMT (n = 4–5 mice/group). (C) Representative OPN immunofluorescence of VAT of WT recipients with WT or OPN–/– BMT and quantification of positive cells in percentage of total cell number (n = 5–7 mice/group). Arrowheads, OPN+ cells. (D) Representative SA-β-Gal staining in VAT of WT recipients with WT or OPN–/– BMT. (E) Representative p16/CD68 immunofluorescence of VAT from WT recipients with WT or OPN–/– BMT. Arrowheads, double-positive cells. (F and G) Quantification of p16+ cells in percentage of total cell number (F; n = 4 mice/group) or CD68+ cell number (G; n = 4 mice/group). (H) Distribution and difference of adipocyte size in VAT from WT or OPN–/– BMT mice. (I) qRT-PCR analysis of adipokine gene expression (leptin, Lep; adiponectin, Adipoq) in VAT of WT or OPN–/– BMT mice (n = 7–8 mice/group). (J) Glucose tolerance test, temporal plot, and area under curve (AUC) analysis (n = 7–9 mice/group). (K) Representative TUNEL/CD45 immunofluorescence of VAT from WT or OPN–/– BMT mice and quantification of TUNEL+ cells (green arrowheads) in percentage of total cell number (n = 4 mice/group). (L) Representative cleaved caspase-3/CD45 immunofluorescence and quantification in VAT of the same animals as above. Arrowheads, double-positive cells (n = 4 mice/group). (M) qRT-PCR analysis of Mertk in VAT of WT and OPN–/– BMT mice (n = 5–8 mice/group). All scale bars: 50 μm. Data are presented as original images (CE, K, and L) or individual values with mean ± SEM and analyzed with 2-tailed, unpaired Student’s t test (B, C, and FM); ns, nonsignificant; *P < 0.05, **P < 0.01, ***P < 0.001.

References

    1. Palmer AK, et al. Targeting senescent cells alleviates obesity-induced metabolic dysfunction. Aging Cell. 2019;18(3):e12950. doi: 10.1111/acel.12950. - DOI - PMC - PubMed
    1. Lumeng CN, et al. Phenotypic switching of adipose tissue macrophages with obesity is generated by spatiotemporal differences in macrophage subtypes. Diabetes. 2008;57(12):3239–3246. doi: 10.2337/db08-0872. - DOI - PMC - PubMed
    1. Pini M, et al. Adipose tissue senescence is mediated by increased ATP content after a short-term high-fat diet exposure. Aging Cell. 2021;20(8):e13421. - PMC - PubMed
    1. Rabhi N, et al. Obesity-induced senescent macrophages activate a fibrotic transcriptional program in adipocyte progenitors. Life Sci Alliance. 2022;5(5):e202101286. doi: 10.26508/lsa.202101286. - DOI - PMC - PubMed
    1. Matacchione G, et al. Senescent macrophages in the human adipose tissue as a source of inflammaging. Geroscience. 2022;44(4):1941–1960. doi: 10.1007/s11357-022-00536-0. - DOI - PMC - PubMed

Publication types