. 2023 Jun;10(17):e2206889.
doi: 10.1002/advs.202206889. Epub 2023 Apr 24.

IL-1β Is an Androgen-Responsive Target in Macrophages for Immunotherapy of Prostate Cancer

Affiliations

IL-1β Is an Androgen-Responsive Target in Macrophages for Immunotherapy of Prostate Cancer

Deng Wang et al. Adv Sci (Weinh). 2023 Jun.

Abstract

Great attention is paid to the role of androgen receptor (AR) as a central transcriptional factor in driving the growth of prostate cancer (PCa) epithelial cells. However, the understanding of the role of androgen in PCa-infiltrated immune cells and the impact of androgen deprivation therapy (ADT), the first-line treatment for advanced PCa, on the PCa immune microenvironment remains limited. On the other hand, immune checkpoint blockade has revolutionized the treatment of certain cancer types, but fails to achieve any benefit in advanced PCa, due to an immune suppressive environment. In this study, it is reported that AR signaling pathway is evidently activated in tumor-associated macrophages (TAMs) of PCa both in mice and humans. AR acts as a transcriptional repressor for IL1B in TAMs. ADT releases the restraint of AR on IL1B and therefore leads to an excessive expression and secretion of IL-1β in TAMs. IL-1β induces myeloid-derived suppressor cells (MDSCs) accumulation that inhibits the activation of cytotoxic T cells, leading to the immune suppressive microenvironment. Critically, anti-IL-1β antibody coupled with ADT and the immune checkpoint inhibitor anti-PD-1 antibody exerts a stronger anticancer effect on PCa following castration. Together, IL-1β is an important androgen-responsive immunotherapeutic target for advanced PCa.

Keywords: IL-1β; androgen deprivation therapy; androgen receptor; immune therapy; prostate cancer; tumor-associated macrophage.


Conflict of interest statement

The authors declare no conflict of interest.

Figures
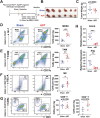
Figure 1
Figure 1
Androgen deprivation therapy reshapes the tumor immune microenvironment in prostate cancer. A) Schematic illustration of experimental design. Prostate cancer organoids derived from the Pbsn‐Cre4; Pten fl/fl; Trp53 fl/fl mouse model were orthotopically implanted to C57BL/6J mice. Recipient mice were sham operated (n = 6) or castrated (n = 6) at day 7, and administrated with enzalutamide (i.g., 10 mg kg−1) or vehicle daily from day 10. On day 21, animals were sacrificed for tissue collection and analysis. B) Prostate tumor image (scale bar = 1 cm) and C) weight of control and ADT treated mice. D—G) Gating strategies for analysis of the tumor immune microenvironment by flow cytometry (left panel). Number of D) MDSCs, E) TAMs, F) M2 TAMs, G) CD8+ T cells and CD4+T cells per mg of tumor weight (cells per mg) (right panel). H) qRT–PCR analyses of Gzmb and Ifng mRNA levels in CD8+ T cells. Gene expression was normalized to the expression of Actb. (Two‐tailed Student's t test was used for the statistical analysis. *, p < 0.05; **, p < 0.01; ***, p < 0.001. Data are presented as means ± SEM).
Figure 2
Figure 2
IL‐1β is a top upregulated cytokine in tumor‐associated macrophages of prostate cancer after androgen deprivation therapy. A) Differential expression of immunosuppressive genes from RNA‐seq in castrated Pbsn‐Cre4; Pten fl/fl; Trp53 fl/fl GEMMs prostate tumors compared to sham operated isotype control mice. Data are shown as pool of n = 3. B) Pie chart showing the proportion of TAM, MDSC, CD8+ T cells, CD4+ T cells, B cells in CD45+ cells from Pbsn‐Cre4; Pten fl/fl; Trp53 fl/fl organoid‐derived tumors. Data are shown as pool of n = 3. C) Relative mRNA expression of cytokines in TAMs sorted from Pbsn‐Cre4; Pten fl/fl; Trp53 fl/fl GEMMs prostate tumors. Data are shown as pool of n = 4. D,E) qRT–PCR analyses of Il1b in prostate cancer tissues from sham‐operated or castrated D) Pbsn‐Cre4; Pten fl/fl; Trp53 fl/fl mice (n = 3) or E) Pbsn‐Cre4; Pten fl/fl; Hi‐Myc mice (n = 3). Gene expression was normalized to Actb. F,G) The protein levels of IL‐1β in sham‐operated and castrated F) Pbsn‐Cre4; Pten fl/fl; Trp53 fl/fl mice or G) Pbsn‐Cre4; Pten fl/fl; Hi‐Myc mice were determined by immunoblotting (n = 3). (Two‐tailed Student's t‐test was used for the statistical analysis. *, p < 0.05; **, p < 0.01. Data are presented as means ± SEM).
Figure 3
Figure 3
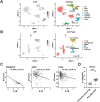
AR is expressed in tumor‐associated macrophages of human prostate cancer and negatively correlates with IL‐1β. A,B) Visualization of IL1B gene expression in different cell types (A) and AR gene expression in CD45+ cells (B) on a UMAP plot of scRNA‐seq profiles of human prostate cancers. Data were obtained from Baijun Dong et al.[ 18 ] C) Correlation analysis of IL1B mRNA level and AR score in the PROMOTE 2017 PCa dataset,[ 19 ] SU2C 2019 PCa dataset[ 20 ] and TCGA 2018 PCa dataset.[ 21 ] Pearson Correlation Coefficient was used for the correlation analysis. D) The concentrations of IL‐1β in the serum of patients with hormone naïve PCa (n = 9) or PCa after ADT (n = 12) was measured by enzyme‐linked immunosorbent assay. (Two‐tailed Student's t‐test was used for the statistical analysis. ***, p < 0.001. Data are presented as means ± SEM).
Figure 4
Figure 4
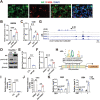
AR acts as a transcriptional suppressor for Il1b in tumor‐associated macrophages of prostate cancer. A) Immunofluorescent staining images of AR and F4/80 in Pbsn‐Cre4; Pten fl/fl; Trp53 fl/fl GEMMs prostate tumors. Representative images are presented. Scale bars = 20 µm. B,C) qRT–PCR analyses of Il1b in bone marrow derived macrophages (BMDMs) (B) and TAMs (C) treated with DMSO, 10 nm DHT, 10 nm DHT plus 10 µm enzalutamide, respectively. TAMs were FACS‐sorted from Pten Δ/Δ; Trp53 Δ/Δ organoids‐derived tumor. D,E) Immunoblotting (D) and qRT–PCR (E) results showing IL‐1β protein (D) and mRNA (E) levels in control and AR overexpressed (OE) Raw264.7 macrophage cell line. Gene expression was normalized to the expression of Actb. F) qRT–PCR analyses of Il1b in Raw264.7 treated with DMSO, 10 nm DHT, 10 nm DHT plus 10 µm enzalutamide, respectively. G) Genome views of AR enrichment at the IL1B gene in THP‐1 cells from analysis of published Chip‐seq data (Bianca Cioni et al.)[ 22 ] (Scale bar = 1 kb). AR peaks in DMSO and 10 nm R1881 conditions are depicted in grey and blue, respectively. H) Predicted AR binding sites on the promoter of Il1b by the JASPAR database. I,J) Relative luciferase intensity of Il1b promoter‐driven firefly luciferase in control and AR OE Raw264.7 cell lines (I), and in Raw264.7 cells treated with DMSO, 10 nm DHT, 10 nm DHT and 10 µm enzalutamide, respectively (J). The firefly luciferase signal was normalized to the co‐transfected renilla signal. K. ChIP‐q‐PCR analysis shows enrichment levels of AR to the Il1b promoter in Raw264.7 cells without or with the treatment of 10 nm DHT. (Two‐tailed Student's t‐test was used for the statistical analysis: ns, not significant; *, p < 0.05; **, p < 0.01; ***, p < 0.001. Data are presented as means ± SEM).
Figure 5
Figure 5
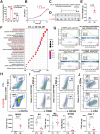
IL‐1β promotes aggregation of myeloid‐derived suppressor cells to exacerbate immunosuppression in prostate cancer. A) IL‐1β concentrations in culture supernatants or cell lysates of control and secreted IL‐1β‐overexpressed Pten Δ/Δ; Trp53 Δ/Δ PCa cells were measured by enzyme‐linked immunosorbent assay (ELISA). B) CCK‐8 assays showing the growth of control and IL‐1β‐overexpressed Pten Δ/Δ; Trp53 Δ/Δ PCa cells. C) Schematic illustration of experimental design. Control or secreted IL‐1β‐overexpressed Pten Δ/Δ; Trp53 Δ/Δ PCa cells were orthotopically implanted to C57BL/6J mice. On day 18, animals were sacrifice for tissue collection and analysis. D,E) Prostate tumor image (D) (Scale bar = 1 cm) and weight (E) of control and IL‐1β‐overexpressed tumors. F) Gene sets enriched in IL‐1β overexpressed tumors compared to control tumors in GO‐biological processing analysis. G) GSEA analysis of RNA‐seq of IL‐1β overexpressed tumors compared to control tumors in MDSC gene signature,[ 23 ] antigen processing and presentation, effective versus memory CD8+ T cell and interferon gamma response. H—J) Gating strategies for analysis of the tumor infiltrated immune cells by flow cytometry (top panel). Number of MDSCs, M1‐type TAMs, M2‐type TAMs, and CD8+ T cells normalized to mg of tumor weight (cells per mg) and M1/M2 TAMs ratio in control and IL‐1β‐overexpressed prostate tumors (bottom panel). (Two‐tailed Student's t‐test was used for the statistical analysis: ns, not significant; *, p < 0.05; **, p < 0.01; ***, p < 0.001. Data are presented as means ± SEM).
Figure 6
Figure 6
Androgen deprivation therapy combined with anti‐IL‐1β and anti‐PD‐1 immunotherapy significantly inhibits prostate cancer progression. A) Schematic illustration of the treatment strategy on Pbsn‐Cre4; Pten fl/fl; Trp53 fl/fl organoid‐derived tumors. C57BL/6J mice were castrated on day 7 after implantation of tumor organoids, then treated with enzalutamide (i.g., 10 mg kg−1) daily from day 10. Mice were arbitrarily divided into four groups and treated with control IgG, anti‐IL‐1β antibody (i.p. 8 mg kg−1, every other day), anti‐PD‐1 antibody (i.p. 8 mg kg−1, every other day), or anti‐IL‐1β antibody in combination with anti‐PD‐1 antibody. Animals were sacrificed on day 21 for analysis and data collection. B,C) Prostate tumor image (B) (Scale bar = 1 cm) and weight (C) of IgG, anti‐IL‐1β antibody, anti‐PD‐1 antibody, and combinatory antibodies‐treated mice. D–F) Gating strategies for analysis of the tumor infiltrated immune cells by flow cytometry (left panel). Number of TAMs, MDSCs, CD8+ T, and CD4+ T cells normalized to mg of tumor weight (cells per mg) in prostate tumors of IgG, anti‐IL‐1β antibody, anti‐PD‐1 antibody, and combinatory antibodies‐treated mice (right panel). G) qRT–PCR analyses of Gzmb and Ifng genes in sorted CD8+ T cells from prostate tumors of IgG, anti‐IL‐1β antibody, anti‐PD‐1 antibody, and combinatory antibodies‐treated mice. Gene expression was normalized to the expression of Actb. (Two‐tailed Student's t‐test was used for the statistical analysis. *, p < 0.05; **, p < 0.01; ***, p < 0.001. Data are presented as means ± SEM).
Figure 7
Figure 7
IL‐1β is an androgen‐responsive therapeutic target in PCa‐associated macrophages for immune therapy. Schematic figure describing that IL‐1β is transcriptionally suppressed by AR in PCa‐associated macrophages and upregulated after ADT therapy in PCa. ADT‐mediated secretion of IL‐1β leads to the accumulation of MDSCs and an exacerbation of immune suppressive microenvironment. Targeting IL‐1β and blocking immune checkpoints in combination with ADT can serve as an attractive therapeutic approach for the treatment of advanced prostate cancer.

References

    1. Sung H., Ferlay J., Siegel R. L., Laversanne M., Soerjomataram I., Jemal A., Bray F., CA Cancer J. Clin. 2021, 71, 209. - PubMed
    1. Litwin M. S., Tan H. J., JAMA, J. Am. Med. Assoc. 2017, 317, 2532. - PubMed
    1. a) Watson P. A., Arora V. K., Sawyers C. L., Nat. Rev. Cancer 2015, 15, 701; - PMC - PubMed
    2. b) Davies A. H., Beltran H., Zoubeidi A., Nat. Rev. Urol. 2018, 15, 271. - PubMed
    1. Tan M. H., Li J., Xu H. E., Melcher K., Yong E. L., Acta Pharmacol. Sin. 2015, 36, 3. - PMC - PubMed
    1. Heinlein C. A., Chang C., Endocr. Rev. 2004, 25, 276. - PubMed

Publication types