. 2023 Apr 19;55(4):587-600.
doi: 10.3724/abbs.2023068.

Ginsenoside Rh3 induces pyroptosis and ferroptosis through the Stat3/p53/NRF2 axis in colorectal cancer cells

Affiliations

Ginsenoside Rh3 induces pyroptosis and ferroptosis through the Stat3/p53/NRF2 axis in colorectal cancer cells

Yingchao Wu et al. Acta Biochim Biophys Sin (Shanghai). .

Abstract

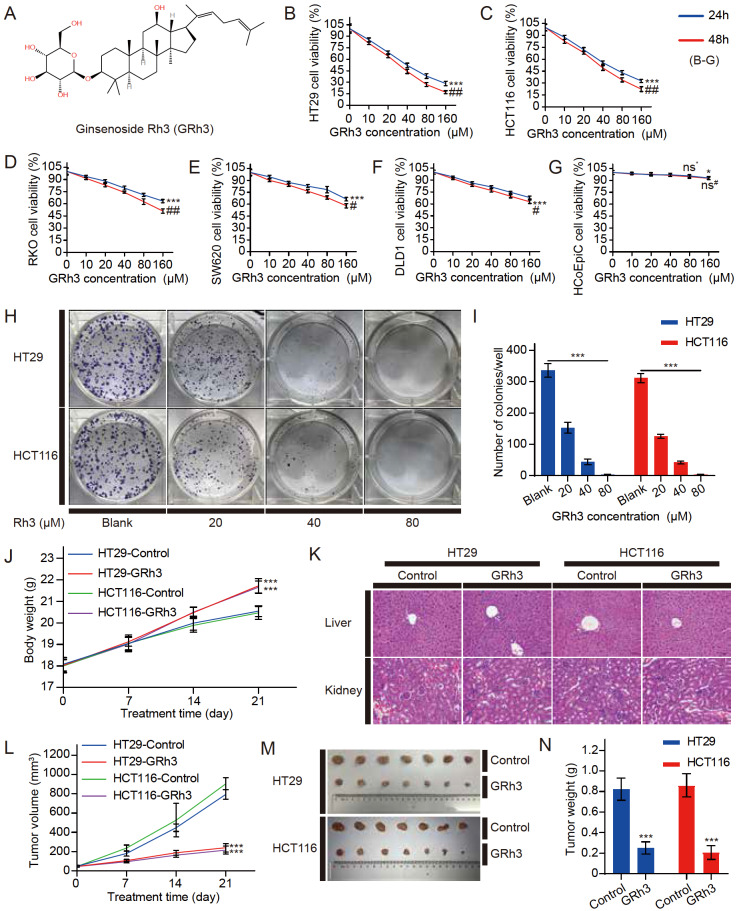
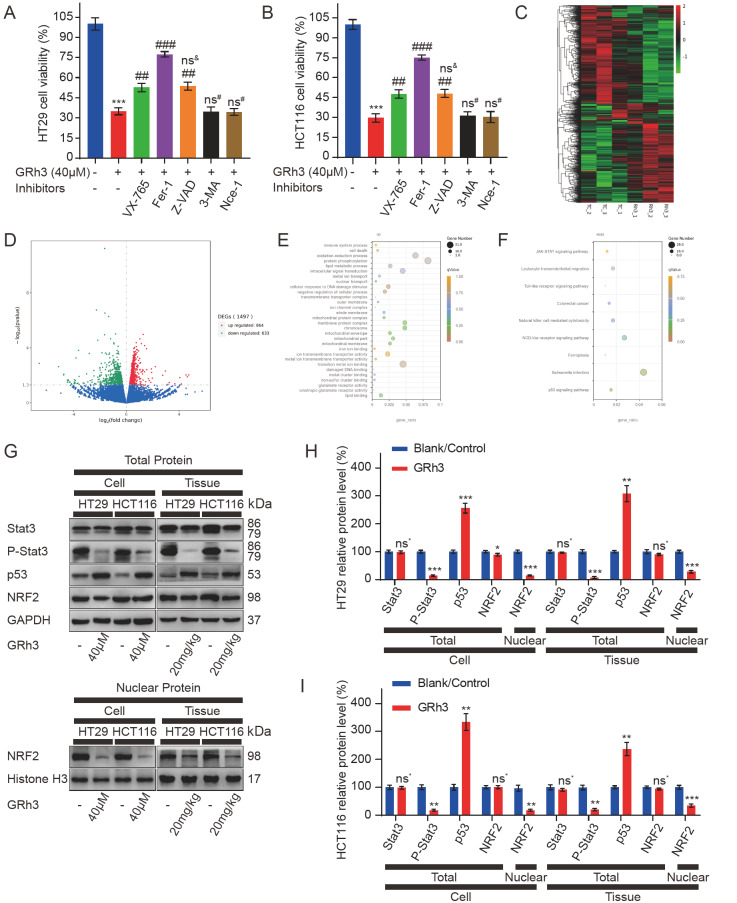
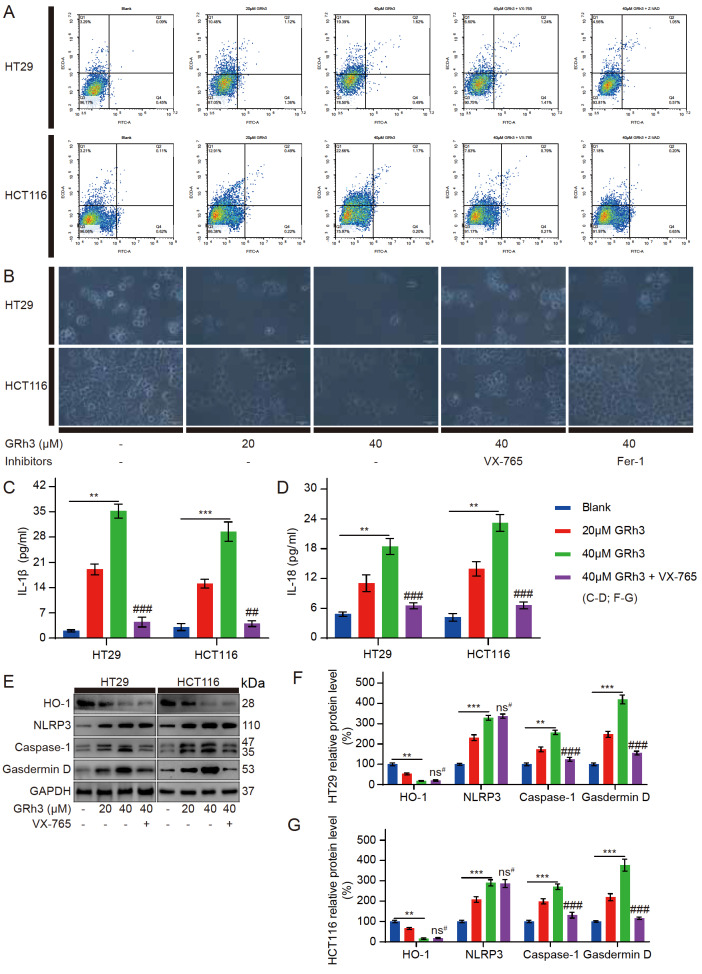
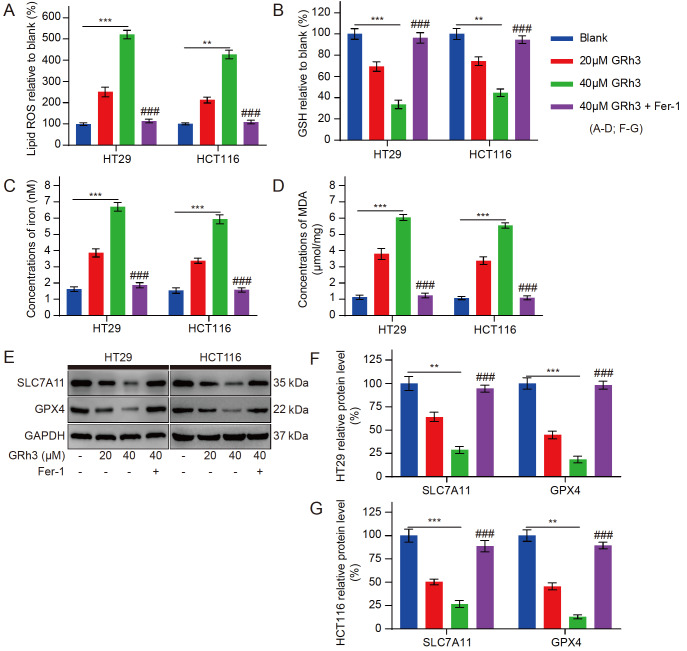
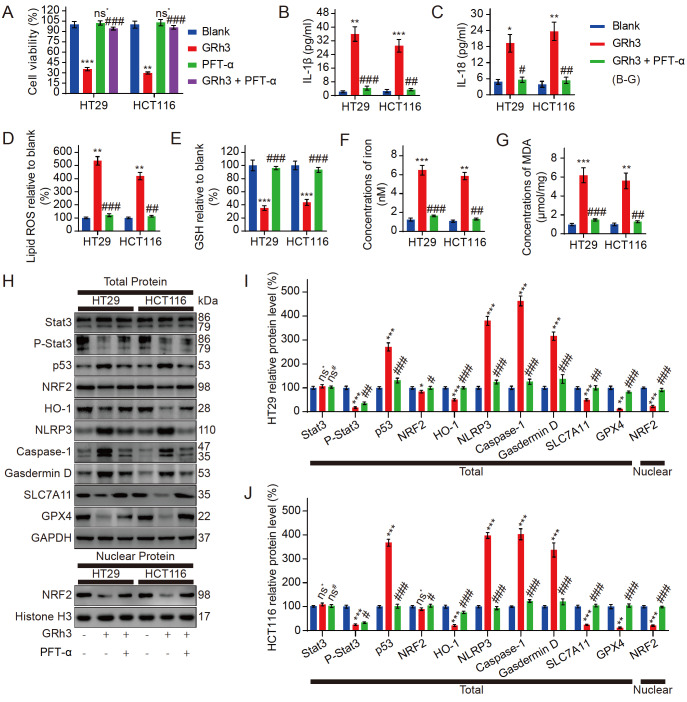
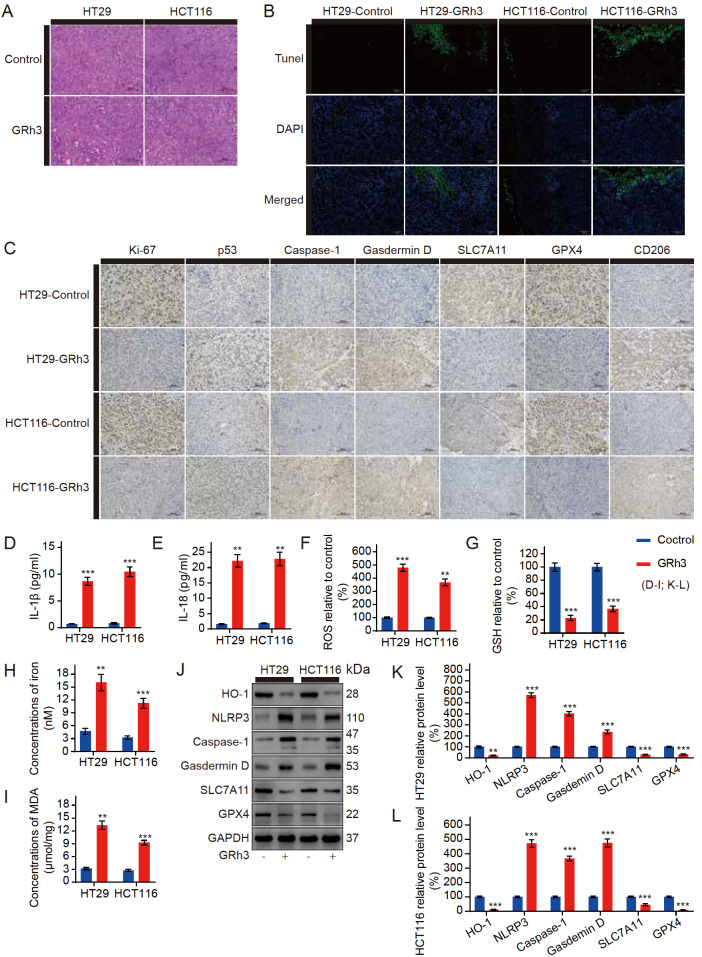
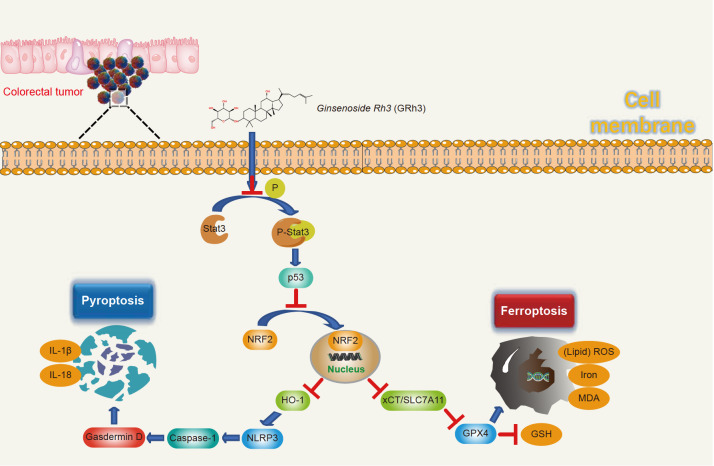
Ginsenoside Rh3 (GRh3) is a seminatural product obtained by chemical processing after isolation from Chinese herbal medicine that has strong antitumor activity against human tumors. However, its antitumor role remains to be elucidated. The aim of this study is to explore the mechanisms underlying the tumor suppressive activity of GRh3 from the perspective of pyroptosis and ferroptosis. GRh3 eliminates colorectal cancer (CRC) cells by activating gasdermin D (GSDMD)-dependent pyroptosis and suppressing solute carrier family 7 member 11 (SLC7A11), resulting in ferroptosis activation through the Stat3/p53/NRF2 axis. GRh3 suppresses nuclear factor erythroid 2-related factor 2 (NRF2) entry into the nucleus, leading to the decrease of heme oxygenase 1 (HO-1) expression, which in turn promotes NOD-like receptor thermal protein domain associated protein 3 (NLRP3) and caspase-1 expression. Finally, caspase-1 activates GSDMD-dependent pyroptosis. Furthermore, GRh3 prevents NRF2 from entering the nucleus, which suppresses SLC7A11, causing the depletion of glutathione (GSH) and accumulation of iron, lipid reactive oxygen species (ROS) and malondialdehyde (MDA), and eventually leading to ferroptosis in CRC cells. In addition, GRh3 effectively inhibits the proliferation of CRC cells in vitro and in nude mouse models. Collectively, GRh3 triggers pyroptotic cell death and ferroptotic cell death in CRC cells via the Stat3/p53/NRF2 axis with minimal harm to normal cells, showing great anticancer potential.

Keywords: Stat3/p53/NRF2 axis; colorectal cancer; ferroptosis; ginsenoside Rh3; pyroptosis.


Conflict of interest statement

The authors declare that they have no conflict of interest.

Figures

None
Figure 1
GRh3 significantly inhibits the proliferation of CRC cells in vivo and in vitro (A) The chemical structure of GRh3. (B‒G) The cell viability of CRC cells (HT29, HCT116, RKO, SW620, and DLD1 cells in that order) and HCoEpiC cells treated with different concentrations of GRh3 in medium for 24 and 48 h ( n=3). (H,I) Giemsa-stained colonies were observed under an inverted microscope and quantified ( n=3). HT29 and HCT116 human CRC xenograft mouse models were treated with solvent or GRh3 (20 mg/kg/d). (J) Body weight was measured every 7 days ( n=10). (K) HE staining of liver and kidney tissues. Scale bar= 100 μm. (L) Tumor size was measured every 7 days ( n=10). (M) Representative images of HT29 and HCT116 xenograft tumor tissues from the control (solvent) and GRh3-treated groups. (N) Xenograft tumor tissue weight after 21 days of treatment ( n=10). Data are presented as the mean±SD of triplicate experiments. (B‒G) * P<0.05, *** P<0.001 compared with the blank group (0 μM GRh3); ## P<0.01, ### P<0.001 compared with the 24 h control group; (I,J,L,N) *** P<0.001 compared with the blank/control group.
None
Figure 2
GRh3 induces pyroptosis and ferroptosis in CRC cells and affects the Stat3/p53/NRF2 axis (A,B) The viabilities of HT29 and HCT116 cells. HT29 and HCT116 cells were pretreated with VX-765 (pyroptosis inhibitor), Fer-1 (ferroptosis inhibitor), Z-VAD (apoptosis inhibitor), 3-MA (autophagy inhibitor), or Nce-1 (necrosis inhibitor) for 4 h and then incubated with 40 μM GRh3 for 48 h. (C) Heatmap showing the cluster of differentially expressed genes in the GRh3 treatment and tumor control groups. Up- and down-regulated genes are represented in red and green, respectively, n=3. (D) Volcano plot of differential expression signals in the GRh3 treatment and tumor control groups, n=3. (E) Bubble map of the GO enrichment analyses of differentially expressed genes in HT29 xenograft tumor tissue. The GeneRatio represents the degree of enrichment. The node size shows the number of selected genes, and the color scale represents padj, n=3. (F) Bubble map of KEGG pathway enrichment analyses of differentially expressed genes in HT29 xenograft tumor tissue. The GeneRatio represents the degree of enrichment. The node size shows the number of selected genes, and the color scale represents padj, n=3. (G) Representative western blots of Stat3/p53/NRF2 axis-related protein expression in HT29 and HCT116 cells treated with GRh3 in vitro or in vivo. (H,I) Relative expression levels of Stat3/p53/NRF2 axis-related proteins in HT29 and HCT116 cells. Data are presented as the mean±SD. * P<0.05, ** P<0.01, *** P<0.001, compared with the blank/control group (0 μM or 0 mg/kg GRh3); ## P<0.01, ### P<0.001, compared with the 40 μM GRh3 group.
None
Figure 3
GRh3 induces pyroptosis in HT29 and HCT116 cells (A) Frequencies of pyroptotic cells treated with different concentrations of GRh3 in medium with or without VX-765 (pyroptosis inhibitor) or Z-VAD (apoptosis inhibitor) pretreatment for 48 h as determined by annexin V/PI staining assay. (B) Effects of different concentrations of GRh3 or pretreatment with a pyroptosis inhibitor or ferroptosis inhibitor before incubation with GRh3-containing medium on cell growth and morphology. Scale bar= 50 μm. (C) IL-1β released into the culture medium was detected by ELISA. (D) IL-18 released into the culture medium was detected by ELISA. (E‒G) Cells were treated with GRh3-containing medium or pretreated with pyroptosis inhibitor, and then, GRh3-containing medium was added and incubated for 48 h. The expression levels of pyroptosis-related proteins were determined by western blot analysis. Data are presented as the mean±SD. ** P<0.01, *** P<0.001 compared with the blank group (0 μM GRh3). ## P<0.01, ### P<0.001 compared with the 40 μM GRh3 group, n=3.
None
Figure 4
GRh3 induces ferroptosis in HT29 and HCT116 cells (A) Relative concentrations of lipid ROS in HT29 and HCT116 cells exposed to different concentrations of GRh3 in medium with or without Fer-1 pretreatment (4 h) for 48 h. (B) Relative concentrations of GSH in HT29 and HCT116 cells. (C) Iron concentrations in HT29 and HCT116 cells. (D) Concentrations of MDA in HT29 and HCT116 cells. (E) Representative western blots of ferroptosis-related protein expression in HT29 and HCT116 cells. (F,G) Relative expression levels of ferroptosis-related proteins in HT29 and HCT116 cells. Data are presented as the mean±SD. ** P<0.01, *** P<0.001 compared with the blank group (0 μM GRh3); ### P<0.001 compared with the 40 μM GRh3 group, n=3.
None
Figure 5
Pyroptosis and ferroptosis in CRC cells activated by GRh3 are regulated by the Stat3/p53/NRF2 axis (A) Viability of HT29 cells and HCT116 cells pretreated with or without PFT-α (p53 inhibitor) followed by treatment with GRh3. (B) IL-1β released into the culture medium was detected by ELISA. (C) IL-18 released into the culture medium was detected by ELISA. (D) Relative concentrations of lipid ROS in HT29 and HCT116 cells. (E) Relative concentrations of GSH in HT29 and HCT116 cells. (F) Iron concentrations in HT29 and HCT116 cells. (G) Concentrations of MDA in HT29 and HCT116 cells. (H) Representative western blots of the Stat3/p53/NRF2 axis, pyroptosis, and ferroptosis-related protein expression in HT29 and HCT116 cells exposed to GRh3-containing medium for 48 h with or without PFT-α pretreatment for 4 h. (I,J) Relative expression levels of Stat3/p53/NRF2 axis-, pyroptosis-, and ferroptosis-related proteins in HT29 and HCT116 cells. Data are presented as the mean±SD. * P<0.05, ** P<0.01, *** P<0.001, vs the blank group (0 μM GRh3). # P<0.01, ## P<0.01, ### P<0.001 vs the 40 μM GRh3 group; n=3.
None
Figure 6
GRh3 induces pyroptosis and ferroptosis in human CRC cells in vivo Mice were treated with or without GRh3. (A) HE staining of tumor specimens. Scale bar= 100 μm. (B) TUNEL staining of tumor specimens. Scale bar= 100 μm. (C) Immunohistochemical staining of tumor specimens. Scale bar= 100 μm. (D) IL-1β concentrations in nude mouse serum. (E) IL-18 concentrations in nude mouse serum. (F) Relative ROS concentrations in tumor tissues. (G) Relative GSH concentrations in tumor tissues. (H) Iron concentrations in tumor tissues. (I) MDA concentrations in tumor tissues. (J) Western blot analysis was performed to analyze the expression levels of pyroptosis- and ferroptosis-related proteins in tumor tissues. (K,L) Relative expression levels of pyroptosis- and ferroptosis-related proteins in HT29 and HCT116 cell xenograft tumor tissues. Data are presented as the mean±SD. ** P<0.01, *** P<0.001, n=3.
None
Figure 7
Schematic illustration of the potential underlying mechanism responsible for GRh3-induced pyroptosis and ferroptosis

References

    1. Sung H, Ferlay J, Siegel RL, Laversanne M, Soerjomataram I, Jemal A, Bray F. Global cancer statistics 2020: GLOBOCAN estimates of incidence and mortality worldwide for 36 cancers in 185 countries. CA Cancer J Clin. . 2021;71:209–249. doi: 10.3322/caac.21660. - DOI - PubMed
    1. Benson AB, Venook AP, Al-Hawary MM, Cederquist L, Chen YJ, Ciombor KK, Cohen S, et al. NCCN guidelines insights: colon cancer, version 2.2018. J Natl Compr Canc Netw. . 2018;16:359–369. doi: 10.6004/jnccn.2018.0021. - DOI - PMC - PubMed
    1. Benson AB, Venook AP, Al-Hawary MM, Arain MA, Chen YJ, Ciombor KK, Cohen S, et al. NCCN guidelines insights: rectal cancer, version 6.2020. J Natl Comprehensive Cancer Network. . 2020;18:806–815. doi: 10.6004/jnccn.2020.0032. - DOI - PubMed
    1. Bedoui S, Herold MJ, Strasser A. Emerging connectivity of programmed cell death pathways and its physiological implications. Nat Rev Mol Cell Biol. . 2020;21:678–695. doi: 10.1038/s41580-020-0270-8. - DOI - PubMed
    1. Hersh D, Monack DM, Smith MR, Ghori N, Falkow S, Zychlinsky A. The Salmonella invasin SipB induces macrophage apoptosis by binding to caspase-1 . Proc Natl Acad Sci USA. . 1999;96:2396–2401. doi: 10.1073/pnas.96.5.2396. - DOI - PMC - PubMed