. 2023 May 25;205(5):e0042022.
doi: 10.1128/jb.00420-22. Epub 2023 Apr 24.

Initiator AUGs Are Discriminated from Elongator AUGs Predominantly through mRNA Accessibility in C. crescentus

Affiliations

Initiator AUGs Are Discriminated from Elongator AUGs Predominantly through mRNA Accessibility in C. crescentus

Aishwarya Ghosh et al. J Bacteriol. .

Abstract

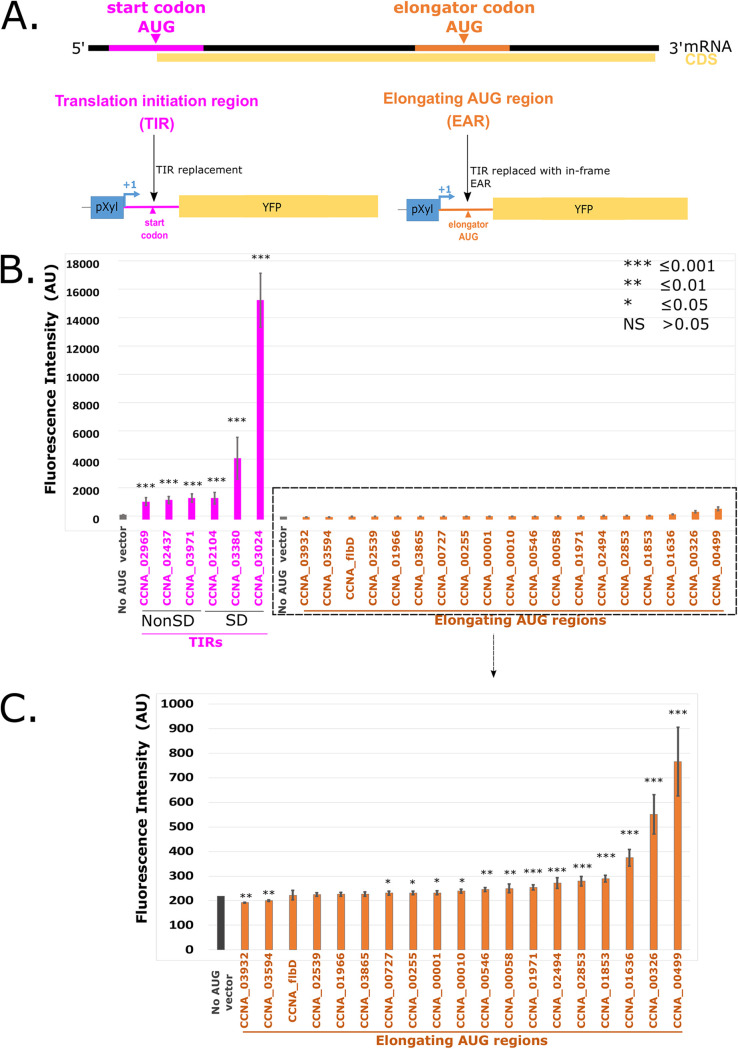
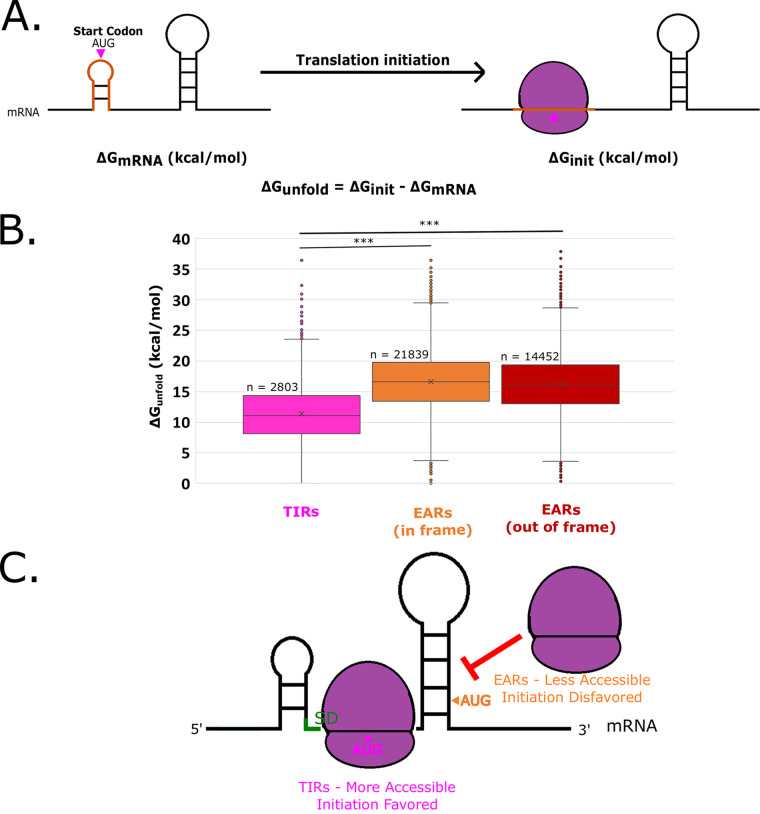
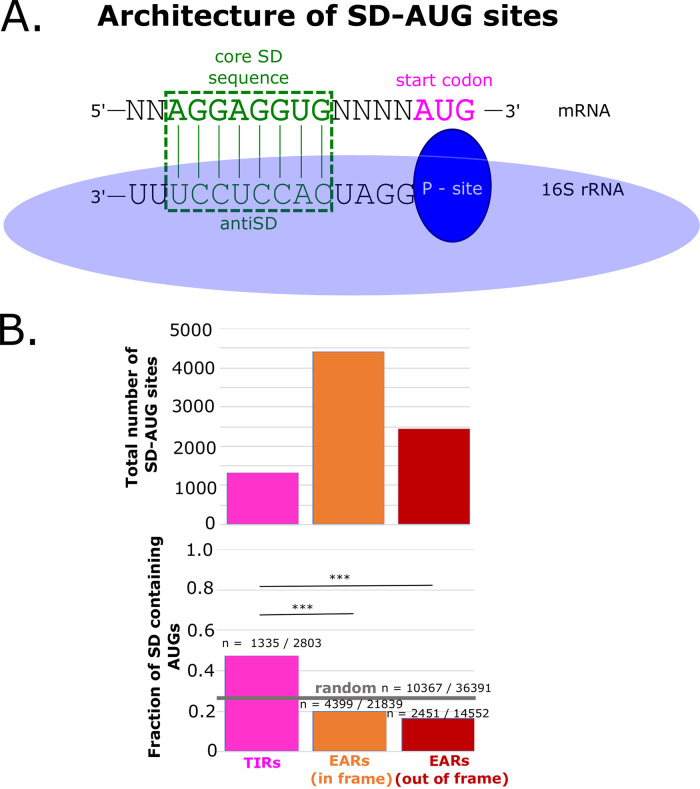
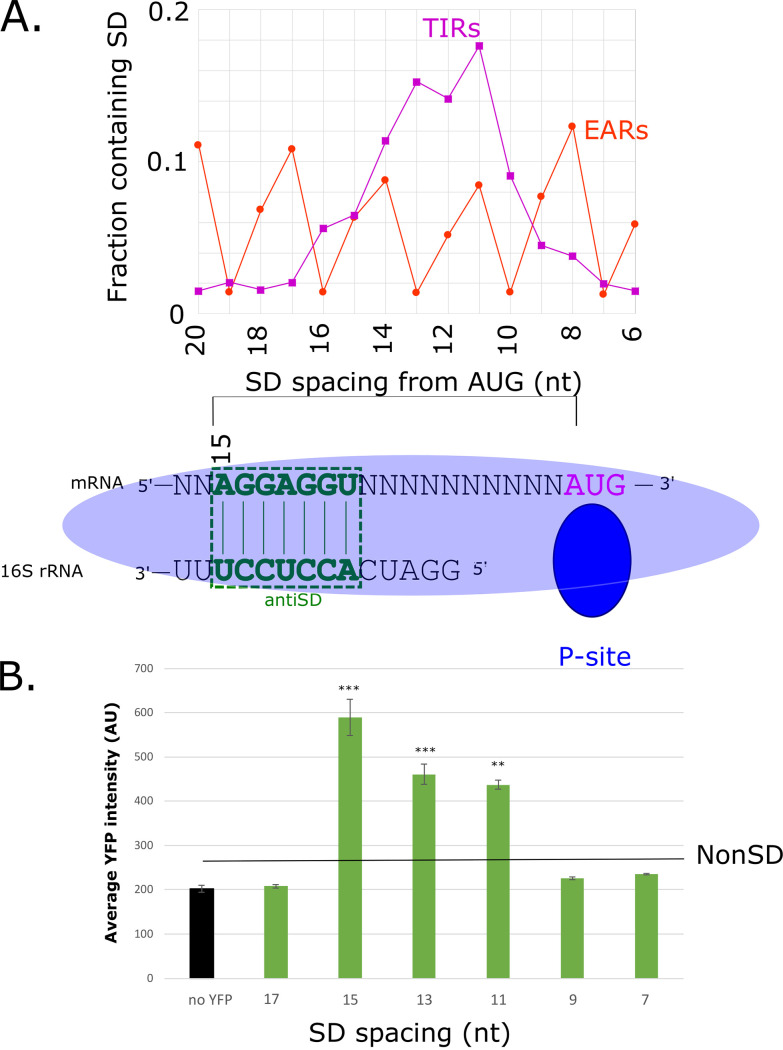
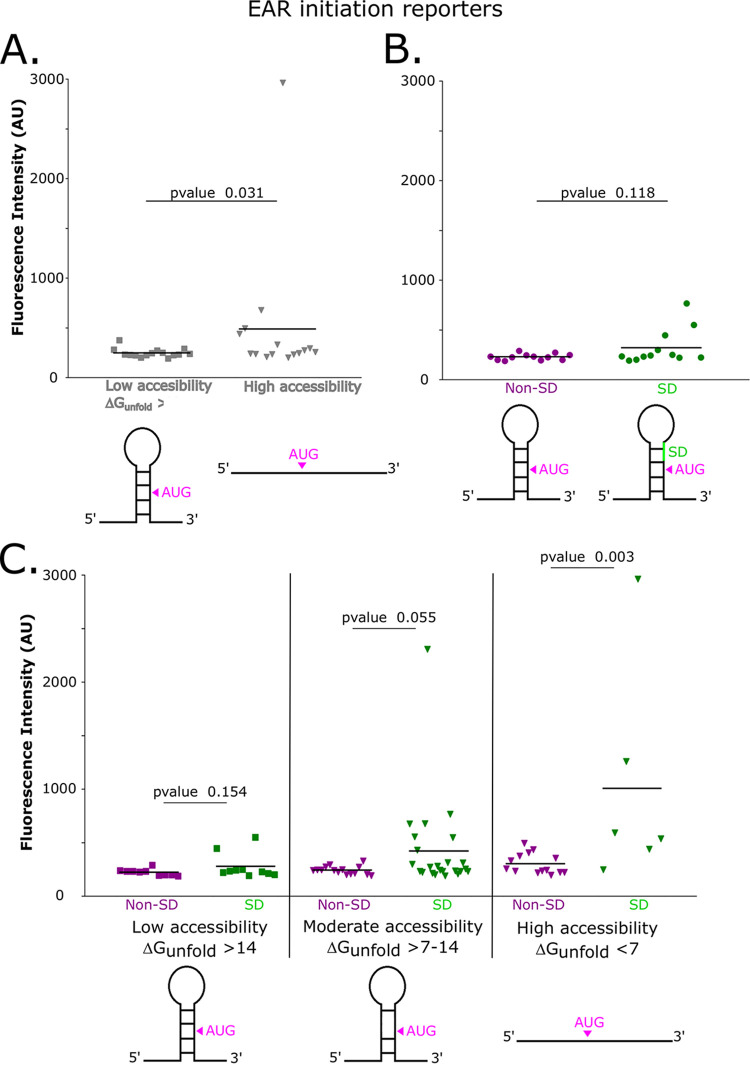
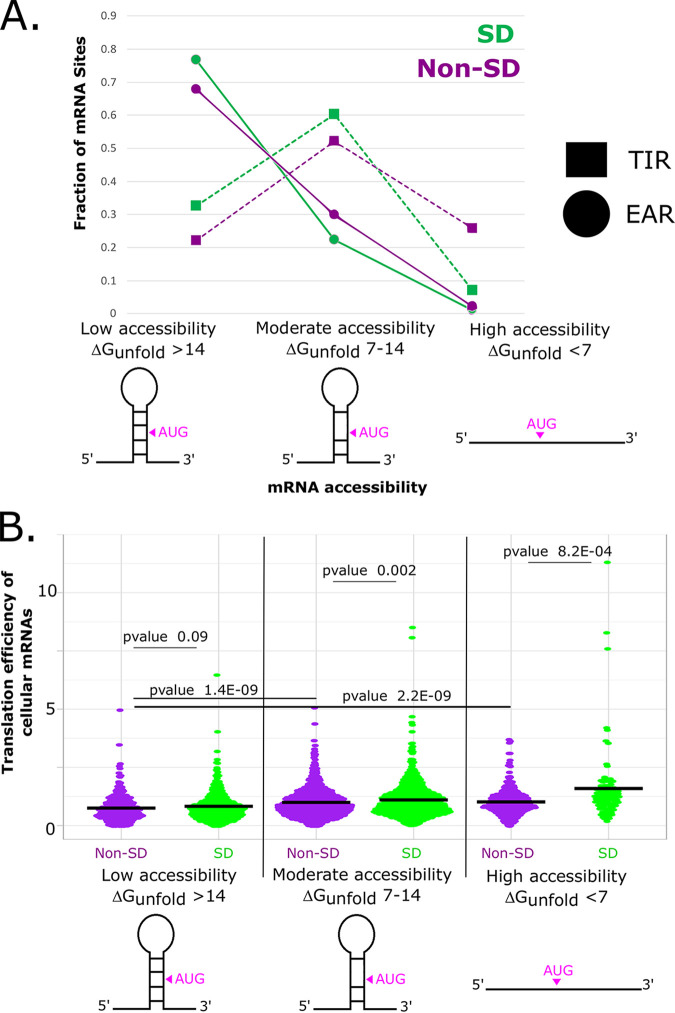
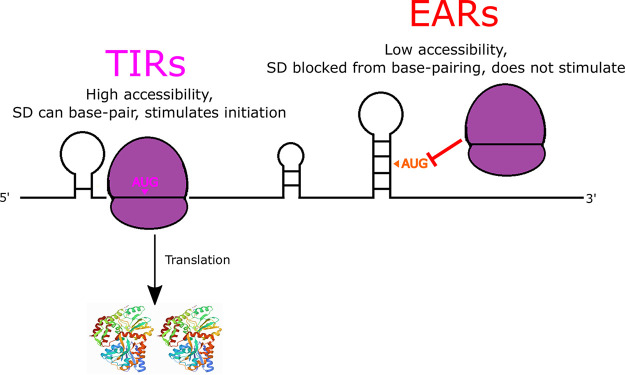
The initiation of translation in bacteria is thought to occur upon base pairing between the Shine-Dalgarno (SD) site in the mRNA and the anti-SD site in the rRNA. However, in many bacterial species, such as Caulobacter crescentus, a minority of mRNAs have SD sites. To examine the functional importance of SD sites in C. crescentus, we analyzed the transcriptome and found that more SD sites exist in the coding sequence than in the preceding start codons. To examine the function of SD sites in initiation, we designed a series of mutants with altered ribosome accessibility and SD content in translation initiation regions (TIRs) and in elongator AUG regions (EARs). A lack of mRNA structure content is required for initiation in TIRs, and, when introduced into EARs, can stimulate initiation, thereby suggesting that low mRNA structure content is a major feature that is required for initiation. SD sites appear to stimulate initiation in TIRs, which generally lack structure content, but SD sites only stimulate initiation in EARs if RNA secondary structures are destabilized. Taken together, these results suggest that the difference in secondary structure between TIRs and EARs directs ribosomes to start codons where SD base pairing can tune the efficiency of initiation, but SDs in EARs do not stimulate initiation, as they are blocked by stable secondary structures. This highlights the importance of studying translation initiation mechanisms in diverse bacterial species. IMPORTANCE Start codon selection is an essential process that is thought to occur via the base pairing of the rRNA to the SD site in the mRNA. This model is based on studies in E. coli, yet whole-genome sequencing revealed that SD sites are absent at start codons in many species. By examining the transcriptome of C. crescentus, we found more SD-AUG pairs in the CDS of mRNAs than preceding start codons, yet these internal sites do not initiate. Instead, start codon regions have lower mRNA secondary structure content than do internal SD-AUG regions. Therefore, we find that start codon selection is not controlled by the presence of SD sites, which tune initiation efficiency, but by lower mRNA structure content surrounding the start codon.

Keywords: Caulobacter crescentus; mRNA structure; ribosomes; translation initiation.


Conflict of interest statement

The authors declare no conflict of interest.

Figures

FIG 1
FIG 1
An in vivo translation initiation reporter assay shows greater initiation in translation initiation regions (TIRs), compared to elongator AUG regions (EARs). (A) A graphical representation showing the mRNA with the translation initiation region (TIR) highlighted in pink and an elongator AUG region (EAR) highlighted in orange. Both the TIR and EAR are cloned into a translation initiation reporter plasmid that is downstream of the pXyl TSS, replacing the start codon of the yellow fluorescent protein (YFP) so that translation initiation must occur at the transplanted TIR or EAR to yield YFP fluorescence. (B) Bar chart showing the average YFP intensity of the TIRs in pink, the EARs in orange, and a vector lacking an AUG start codon in gray. The TIRs containing SD sites are indicated. A t test with unequal variances was done to compare all constructs to the no AUG vector with *** indicating a P value of ≤0.001, ** indicating a P value of ≤0.01, and * indicating a P value of ≤0.05. (C) Zoomed-in view of the low reporter levels of EARs from panel B.
FIG 2
FIG 2
EARs are less accessible than TIRs across the C. crescentus transcriptome. (A) mRNA accessibility can be estimated by the calculation of ΔGunfold. The predicted mRNA minimum free energy (ΔGmRNA) is represented on the left. The orange translation initiation region indicates a ribosome footprint surrounding the start codon (pink). The image on the right represents the mRNA upon initiation (ΔGinit), and the orange initiation region is unfolded by the ribosome. The ΔGunfold represents the amount of energy required to unfold the translation initiation region of the mRNA. (B) Box and whisker plot showing the distribution of ΔGunfold across all mapped TIRs and EARs in the C. crescentus transcriptome (20). The pink box and whiskers represent TIRs, whereas orange represents in-frame EARs and red represents out-of-frame EARs. *** indicates a P value of ≤0.001 for a two-tailed t test with unequal variances. (C) A graphical representation showing that TIRs are generally more accessible, thereby facilitating initiation, whereas EARs are less accessible, thereby blocking ribosome access.
FIG 3
FIG 3
SD-AUG pairs are more abundant in EARs than in TIRs. (A) A graphical representation of the optimal alignment of the core SD sequence “AGGAGGUG” in the mRNA shown in green, with the anti-SD sequence in the rRNA below. The base pairing is highlighted in the green dotted box. (B) The abundance of SD-AUG pairs across TIRs and EARs. The total number of SD-AUG pairs across TIRs and EARs is on the top. The pink bar represents the TIRs, whereas the orange bar represents the in-frame EARs and the red bar represents the out-of-frame EARs. Below is the fraction of SD enrichment in the TIRs and EARs. The random probability of SD enrichment is shown as a gray horizontal line (estimated from 36,391 random sequences of the 67% genomic GC% of C. crescentus). *** indicates a P value of ≤0.001, as calculated from a two-sample z test.
FIG 4
FIG 4
Strong, optimally spaced SD-sites boost the translation efficiency of a TIR. (A) Distribution of SD site spacing in TIRs (dark magenta) and EARs (orange) across the C. crescentus transcriptome. Aligned spacing is calculated from the 5′ end of the core SD site after alignment to the anti-SD, as shown below. (B) Bar chart showing the average YFP production in the control (empty vector), compared to plasmids with a poly-A 5′ UTR and SD sites spaced, relative to the AUG, as indicated below. The poly-A 5′ UTR was chosen, as it limits the base pairing of the SD site with other bases in the TIR. A t test with unequal variances was done to compare all constructs to a non-SD control, with *** indicating a P value of ≤0.001, ** indicating a P value of ≤0.01, and * indicating a P value of ≤0.05.
FIG 5
FIG 5
Low EAR accessibility prevents the stimulation of initiation by SD sites. (A) Distribution plot showing the average YFP levels of nonaccessible wild-type EARs, which are represented by square data points, versus accessible mutant EARs, which are represented by inverted triangle data points. EAR mutants contain point mutations in the region upstream of the AUG, and these reduce potential base pairing in the EAR region. Each point represents a single EAR reporter construct’s in vivo YFP level (Table S2). A Mann-Whitney U test was calculated between low accessibility and high accessibility constructs to assess significance. (B) Distribution plot showing the average YFP level of non-SD EARs, which are represented by dark magenta data points, versus SD EARs, which are represented by green data points. A Mann-Whitney U test between the non-SD and SD EAR initiation reporters was used to assess significance. (C) Distribution plot showing the average YFP of non-SD and SD TIRs with different degrees of accessibility. Dark magenta data points represent non-SD TIRs, and green data points represents SD TIRs. Squared data points represent low accessibility TIRs, and inverted triangle data points represent moderately accessible and highly accessible TIRs. A Mann-Whitney U test was performed for the non-SD and SD pairs in each accessibility category to compare the skewed distributions for significance.
FIG 6
FIG 6
TIRs with accessible SD-AUG pairs have higher translation efficiencies in natural mRNAs. (A) Plot showing the distribution of SDs in TIRs and EARs, classified with respect to their accessibility. Non-SD TIRs/EARs are shown in dark magenta, and SD TIRs/EARs are shown in green. (B) Translation efficiency values of C. crescentus mRNAs across six categories of accessibility and SD site prevalence, as measured by ribosome profiling (16). Dark magenta data points represent non-SD TIRs, and green data points represents SD TIRs. Squared data points represent low accessibility TIRs, and inverted triangle data points represent moderate accessibility and high accessibility TIRs. The P-values of Mann-Whitney U tests that were calculated for the non-SD and SD pairs for each accessibility category were used to compare the skewed distributions for significance.
FIG 7
FIG 7
AUG accessibility dictates start codon selection, while the SD can boost initiation efficiency. Cartoon showing that TIRs are more accessible than are EARs, thereby promoting TIR initiation (dark magenta) and preventing initiation on EARs (red orange). SD-AUG pairs are abundant in both TIRs and EARs, but they only increase initiation efficiency in TIRs in which the mRNA is highly accessible.

Similar articles

Cited by

References

    1. de Smit MH, van Duin J. 1990. Secondary structure of the ribosome binding site determines translational efficiency: a quantitative analysis. Proc Natl Acad Sci USA 87:7668–7672. doi:10.1073/pnas.87.19.7668. - DOI - PMC - PubMed
    1. Mustoe AM, Busan S, Rice GM, Hajdin CE, Peterson BK, Ruda VM, Kubica N, Nutiu R, Baryza JL, Weeks KM. 2018. Pervasive regulatory functions of mRNA structure revealed by high-resolution SHAPE probing. Cell 173:181–195.e118. doi:10.1016/j.cell.2018.02.034. - DOI - PMC - PubMed
    1. Gu W, Zhou T, Wilke CO. 2010. A universal trend of reduced mRNA stability near the translation-initiation site in prokaryotes and eukaryotes. PLoS Comput Biol 6:e1000664. doi:10.1371/journal.pcbi.1000664. - DOI - PMC - PubMed
    1. Baez WD, Roy B, McNutt ZA, Shatoff EA, Chen S, Bundschuh R, Fredrick K. 2019. Global analysis of protein synthesis in Flavobacterium johnsoniae reveals the use of Kozak-like sequences in diverse bacteria. Nucleic Acids Res 47:10477–10488. doi:10.1093/nar/gkz855. - DOI - PMC - PubMed
    1. Salis HM. 2011. The ribosome binding site calculator. Methods Enzymol 498:19–42. doi:10.1016/B978-0-12-385120-8.00002-4. - DOI - PubMed

Publication types

LinkOut - more resources