. 2023 May 25;205(5):e0009923.
doi: 10.1128/jb.00099-23. Epub 2023 Apr 24.

The Periplasmic Tail-Specific Protease, Tsp, Is Essential for Secondary Differentiation in Chlamydia trachomatis

Affiliations

The Periplasmic Tail-Specific Protease, Tsp, Is Essential for Secondary Differentiation in Chlamydia trachomatis

Abigail R Swoboda et al. J Bacteriol. .

Abstract

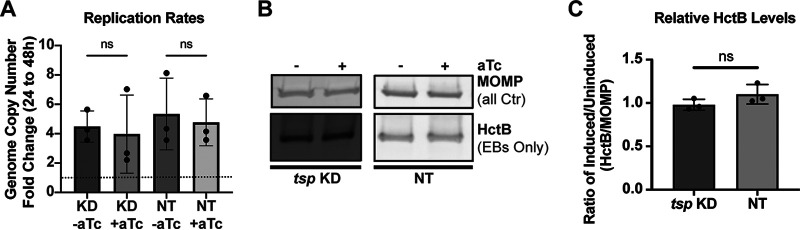
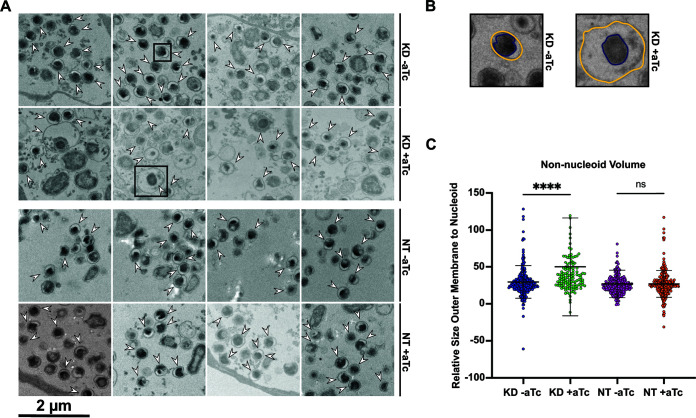
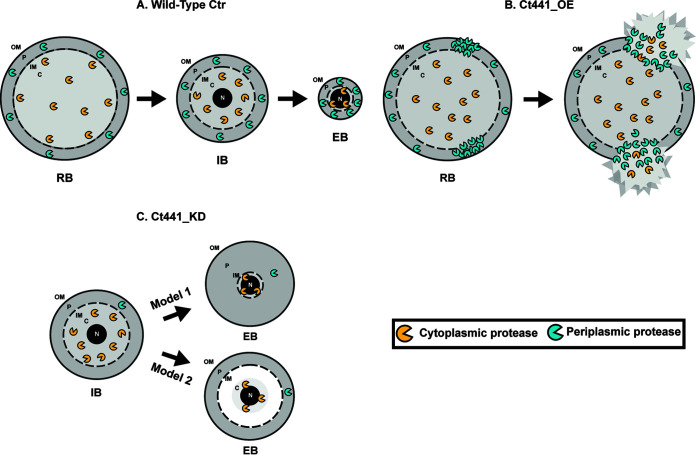
The obligate intracellular human pathogen Chlamydia trachomatis (Ctr) undergoes a complex developmental cycle in which the bacterium differentiates between two functionally and morphologically distinct forms: the elementary body (EB) and the reticulate body (RB). The EB is the smaller, infectious, nondividing form which initiates infection of a susceptible host cell, whereas the RB is the larger, non-infectious form which replicates within a membrane-bound vesicle called an inclusion. The mechanism(s) which drives differentiation between these developmental forms is poorly understood. Bulk protein turnover is likely required for chlamydial differentiation given the significant differences in the protein repertoires and functions of the EB and RB. We hypothesize that periplasmic protein turnover is also critical for the reorganization of an RB into an EB, referred to as secondary differentiation. Ct441 is a periplasmic protease ortholog of tail-specific proteases (i.e., Tsp, Prc) and is expressed in Ctr during secondary differentiation. We investigated the effect of altering Tsp expression on developmental cycle progression. Through assessment of bacterial morphology and infectious progeny production, we found that both overexpression and CRISPR interference/dCas9 (CRISPRi)-mediated knockdown of Tsp negatively impacted chlamydial development through different mechanisms. We also confirmed that catalytic activity is required for the negative effect of overexpression and confirmed the effect of the mutation in in vitro assays. Electron microscopic assessments during knockdown experiments revealed a defect in EB morphology, directly linking Tsp function to secondary differentiation. These data implicate Ct441/Tsp as a critical factor in secondary differentiation. IMPORTANCE The human pathogen Chlamydia trachomatis is the leading cause of preventable infectious blindness and bacterial sexually transmitted infections worldwide. This pathogen has a unique developmental cycle that alternates between distinct forms. However, the key processes of chlamydial development remain obscure. Uncovering the mechanisms of differentiation between its metabolically and functionally distinct developmental forms may foster the discovery of novel Chlamydia-specific therapeutics and limit development of resistant bacterial populations derived from the clinical use of broad-spectrum antibiotics. In this study, we investigate chlamydial tail-specific protease (Tsp) and its function in chlamydial growth and development. Our work implicates Tsp as essential to chlamydial developmental cycle progression and indicates that Tsp is a potential drug target for Chlamydia infections.

Keywords: Chlamydia; Prc; Tsp; development; differentiation; periplasm; protease.


Conflict of interest statement

The authors declare no conflict of interest.

Figures

FIG 1
FIG 1
Purification and activity analyses of Ct_Tsp. (A) Multiple sequence alignment of the active site in Ct_Tsp and Ec_Prc denoting the conserved catalytic residues S455A (mutated in this study), K481A (mutated in this study), and Q485. (B) 6×His-tagged recombinant proteins were assessed for purity and stability on SDS-PAGE stained with Coomassie brilliant blue for total protein (top left) or probed via Western blotting for the 6×His-tag or a C-terminal region of tail-specific protease (Tsp). (C and D) To assess enzyme activity, 1 μg of enzyme and 3 μg of (C) chlamydial SsrA-tagged green fluorescent protein (GFP) (abbreviated as VAA) or (D) casein were incubated at 37°C for 3 h and the products were resolved on SDS-PAGE and Coomassie-stained. Images represent results from replicate experiments with two independently purified protein preparations. Expected sizes: Ec_Prc, 75.3 kDa after signal processing; and Ct_Tsp, 74.6 kDa. (E) Transcripts of euo, clpP2, omcB, and tsp throughout the Ctr L2 48-h developmental cycle.
FIG 2
FIG 2
Overexpression of Ct_Tsp_6×His negatively impacts Chlamydia. (A and B) Immunofluorescence assay (IFA) of wild-type (WT) Ct_Tsp_6×His overexpression at 24 and 48 hpi (A) and mutant (MUT) Ct_Tsp_6×His (S455A/K481A) overexpression at 24 and 48 hpi (B). Samples were induced at 16 hpi with 20 nM anhydrotetracycline (aTc), aldehyde-fixed at the indicated time, and stained for major outer membrane protein (MOMP; gray), 6×His (red), and DAPI (4′,6-diamidino-2-phenylindole; blue) to label DNA. GFP expressed constitutively from the overexpression plasmid is shown in green. Scale bars = 10 μm. Images captured using a Zeiss AxioImager Z.2 with Apotome2 at ×100 magnification. (C) Representative localization of induced Ct_Tsp_6×His in an individual organism. White box in panel A represents chosen bacteria for the zoomed image in panel C. (D) Transcriptional analysis of tsp using reverse transcription-quantitative PCR (RT-qPCR) following induction of WT or MUT overexpression at 16 hpi. RNA and genomic DNA (gDNA) were harvested at 24 hpi. Data are presented as a ratio of cDNA to gDNA for the induced relative to the uninduced. ns, not significant by paired Student’s t test. (E) Inclusion-forming unit (IFU) assay following overexpression of WT or MUT induced at 16 hpi and harvested at 24 or 48 hpi. IFUs were normalized to uninduced samples and plotted on a log scale. ****, P < 0.000001; ns, not significant by multiple unpaired Student’s t test. Data represent three biological replicates.
FIG 3
FIG 3
Overexpression of Ct_Tsp_6×His impairs replication of Chlamydia. (A) Quantification of genomic DNA (gDNA) determined by qPCR following overexpression of WT or MUT (S455A/K481A) Ct_Tsp. Samples were induced at 16 hpi with 20 nM aTc, and gDNA was harvested at 24 or 48 hpi. Samples were normalized to the genome copy number at 24 hpi and presented as fold change from 24 to 48 hpi. Dotted line represents the normalization of the 24-hpi sample to 1. **, P < 0.01; ns, not significant by paired Student’s t test. Individual points represent biological replicates. (B) Western blots of HctB (EBs only) and MOMP (all Ctr) levels from uninduced and induced cultures of WT or MUT overexpression strains. Samples were induced at 16 hpi with 20 nM aTc, and protein was harvested at 48 hpi. Blot is representative of three biological replicates. (C) HctB levels quantified from Western blots shown in panel B. Levels are displayed as the HctB to MOMP ratio of induced samples relative to uninduced samples. Individual points represent biological replicates. ***, P < 0.0001 by paired Student’s t test.
FIG 4
FIG 4
Knockdown of ct441/tsp reduces infectious progeny but does not affect inclusion size. (A to D) Assessment of temporal gene regulation and confirmation of ct441/tsp knockdown by RT-qPCR. euo (A), clpP2 (B), omcB (C), and tsp (D) transcripts measured during ct441/tsp knockdown (KD) or nontargeting (NT) conditions. Ratio of cDNA normalized to gDNA is plotted on a log scale. Samples were induced at 4 hpi, and RNA or gDNA samples were taken at 10 and 36 hpi for the ct441/tsp KD and NT strains. (E) IFA of ct441/tsp KD and NT at 24 and 48 hpi. Samples were induced at 4 hpi with 20 nM aTc and stained for MOMP (gray), dCas9 (red), and DAPI (blue) to label DNA. Scale bars = 10 μm. A Zeiss AxioImager Z.2 with Apotome2 was used to take images at ×100 magnification. (F) IFU assay following ct441/tsp KD or NT induced at 4 hpi and harvested at 24 or 48 hpi. IFUs were normalized to uninduced samples and plotted on a log scale. ****, P < 0.000001; ns, not significant by multiple unpaired Student’s t test. Results are representative of three biological replicates.
FIG 5
FIG 5
Knockdown of ct441/tsp does not alter replication or production of an elementary body (EB)-specific marker. (A) Quantification of gDNA determined by qPCR following ct441/tsp KD or NT control conditions. Samples were induced at 4 hpi with 20 nM aTc, and gDNA was harvested at 24 or 48 hpi. Samples were normalized to the genome copy number at 24 hpi and presented as fold change from 24 to 48 hpi. Dotted line represents the normalization of the 24-hpi sample to 1. ns, not significant by paired Student’s t test. (B) Western blot of HctB (EBs only) and MOMP (all Ctr) levels from uninduced and induced cultures of KD or NT knockdown strains. Samples were induced at 4 hpi with 20 nM aTc, and protein was harvested at 48 hpi. Blot is representative of three biological replicates. (C) HctB levels quantified from Western blots shown in panel B. Levels are displayed as the HctB to MOMP ratio of induced samples relative to uninduced samples. Individual points represent biological replicates. ns, not significant by paired Student’s t test.
FIG 6
FIG 6
Knockdown of ct441/tsp alters EB morphology as revealed by electron microscopy (EM) analysis. (A) Representative EM images for the ct441/tsp KD or NT control transformant strains. Scale bar = 2 μm. Samples were induced at 4 hpi with 20 nM aTc and harvested at 40 hpi. White arrows represent organisms that were identified as having condensing or condensed nucleoids (in a blinded fashion by one person) and quantified (in a blinded fashion by a different person). Black boxes show the organisms represented in panel B. (B) Representation of procedure for measuring the perimeter of the nucleoid and outer membrane for each organism. Yellow line represents the outer membrane perimeter, purple line shows the nucleoid perimeter. (C) Quantification of the non-nucleoid volume displayed as the total volume constrained by the outer membrane with the nucleoid volume subtracted. ****, P < 0.000001; ns, not significant by an ordinary one-way analysis of variance.
FIG 7
FIG 7
Proposed model for Ct441/Tsp function in secondary differentiation. (A) Hypothesized model of Ct441/Tsp targeting reticulate body (RB)-specific proteins during secondary differentiation. During differentiation, Tsp degrades periplasmic proteins to facilitate reduction of periplasmic volume concurrent with reduction of cytoplasmic volume. (B) Depiction of effects of increased Ct441/Tsp activity on RBs. Excess active Tsp degrades periplasmically exposed proteins (either specifically or nonspecifically), leading to compromised membrane integrity. (C) Two potential models in which nonfunctional EBs are produced during ct441/tsp knockdown: the membrane separation model (Model 1) and the stationary periplasmic model (Model 2). In Model 1, the inner membrane separates from the outer membrane as the cytoplasmic volume decreases, resulting in a large increase in periplasmic volume. The separation of the membranes results in a decrease in protein density, leaving only diffusible molecules to fill the space. In Model 2, the inner and outer membranes remain anchored and do not reduce in size with the cytoplasm, resulting in a “void” space between the condensing nucleoid and the inner membrane. This space likely contains readily diffusible metabolites and ions with few (if any) proteins or nucleic acids. OM, outer membrane; P, periplasm; IM, inner membrane.

Similar articles

Cited by

References

    1. Gober JW, Marques MV. 1995. Regulation of cellular differentiation in Caulobacter crescentus. Microbiol Rev 59:31–47. doi:10.1128/mr.59.1.31-47.1995. - DOI - PMC - PubMed
    1. Thomashow MF, Cotter TW. 1992. Bdellovibrio host dependence: the search for signal molecules and genes that regulate the intraperiplasmic growth cycle. J Bacteriol 174:5767–5771. doi:10.1128/jb.174.18.5767-5771.1992. - DOI - PMC - PubMed
    1. Julien B, Kaiser AD, Garza A. 2000. Spatial control of cell differentiation in Myxococcus xanthus. Proc Natl Acad Sci USA 97:9098–9103. doi:10.1073/pnas.97.16.9098. - DOI - PMC - PubMed
    1. Abdelrahman YM, Belland RJ. 2005. The chlamydial developmental cycle. FEMS Microbiol Rev 29:949–959. doi:10.1016/j.femsre.2005.03.002. - DOI - PubMed
    1. Clifton DR, Dooley CA, Grieshaber SS, Carabeo RA, Fields KA, Hackstadt T. 2005. Tyrosine phosphorylation of the chlamydial effector protein Tarp is species specific and not required for recruitment of actin. Infect Immun 73:3860–3868. doi:10.1128/IAI.73.7.3860-3868.2005. - DOI - PMC - PubMed

Publication types