. 2023 May 17;67(5):e0156322.
doi: 10.1128/aac.01563-22. Epub 2023 Apr 24.

The Novel DNA Binding Mechanism of Ridinilazole, a Precision Clostridiodes difficile Antibiotic

Affiliations

The Novel DNA Binding Mechanism of Ridinilazole, a Precision Clostridiodes difficile Antibiotic

Clive S Mason et al. Antimicrob Agents Chemother. .

Abstract

Clostridioides difficile infection (CDI) causes substantial morbidity and mortality worldwide with limited antibiotic treatment options. Ridinilazole is a precision bisbenzimidazole antibiotic being developed to treat CDI and reduce unacceptably high rates of infection recurrence in patients. Although in late clinical development, the precise mechanism of action by which ridinilazole elicits its bactericidal activity has remained elusive. Here, we present conclusive biochemical and structural data to demonstrate that ridinilazole has a primary DNA binding mechanism, with a co-complex structure confirming binding to the DNA minor groove. Additional RNA-seq data indicated early pleiotropic changes to transcription, with broad effects on multiple C. difficile compartments and significant effects on energy generation pathways particularly. DNA binding and genomic localization was confirmed through confocal microscopy utilizing the intrinsic fluorescence of ridinilazole upon DNA binding. As such, ridinilazole has the potential to be the first antibiotic approved with a DNA minor groove binding mechanism of action.

Keywords: Clostridium difficile; antibiotic; mechanisms of action.


Conflict of interest statement

The authors declare a conflict of interest. C.S.M., T.A., C.C., E.D., N.N., M.M., and D.J.P. are employees of and/or hold stock/stock options in Summit Therapeutics. Work contributed by K.R.F. was funded through a research collaboration agreement between University of Southampton and Summit Therapeutics. Work contributed by S. M. and S. R. was funded through a research collaboration agreement between Domainex Ltd and Summit Therapeutics. Work contributed by C.H., K.B., K.G., M.J.A., E.B., and K.W.G. was funded through a research collaboration agreement between University of Houston and Summit Therapeutics. K.W.G. has additional research funding paid to his university from Acurx Pharmaceuticals, Paratek Pharmaceuticals, and Seres Health.

Figures
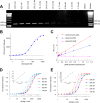
FIG 1
FIG 1
Primary characterization of ridinilazole binding to DNA. (A) UV visualization of ridinilazole (1250 to 1.22 nM) bound to DNA (2 μg C. difficile amplicon). (B) Densitometry plot of the fluorescent bands seen in Fig. 1A, an apparent Kd of 87 nM was determined. (C) Titration of DNA polymers with 2 μM ridinilazole. No increase in fluorescence was observed for (poly[dG-dC])2 DNA polymer. Enhanced fluorescence was observed with (poly[dA-dT])2 and poly(dA)·poly(dT) polymers. (D and E) Titrations of two double-stranded DNA oligonucleotides with fixed concentrations of ridinilazole. Extrapolated dissociation constants in insets yielding Kd values of 21.6 nM for dsOligo 1 (CGCGAATTGCGC) and 21.3 nM for dsOligo 2 (CGCAAATTTGCG). Binding data represents mean of three replicates.
FIG 2
FIG 2
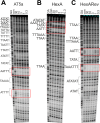
DNase I footprinting patterns for ridinilazole on three DNA AT based templates AT5a (A), HexA (B), and HexARev (C). The ligand concentration (μM) is shown at the top of each gel lane. Tracks labeled “GA” are Maxam-Gilbert markers specific for purines, while “con” indicates (control) cleavage without added ligand. The position of each of the AT sites is indicated in brackets. Sequences located at the top of HexA are toward the bottom of HexARev and vice versa. Areas of proposed ridinilazole interaction are boxed in red.
FIG 3
FIG 3
Ridinilazole-DNA structural studies. (A) Co-complex crystals were identified through UV illumination of screen plates; ridinilazole:DNA crystal complexes appeared as intense blue. (B) The resulting ridinilazole complex structure with the antibiotic clearly positioned in the DNA minor groove. (C) Ridinilazole adopts an angled conformation wrapping the dsDNA oligonucleotide. (D) The bonding interactions between ridinilazole and the DNA substrate, each benzimidazole NH H-bonding to separate nonpaired adenine and thymine bases. (E) A two-dimensional (2D) interaction map providing more bonding detail, the nonpaired adenine and thymine bases bonding to each benzimidazole group interaction are highlighted in red or blue, respectively, in the dsOligo1 sequence.
FIG 4
FIG 4
Colocalization analysis of ridinilazole (RDZ) and DRAQ5 fluorescence by confocal laser scanning microscopy in the C. difficile strain 630. Upper and lower panels represent the cells exposed to DMSO (A to F) and 40 × MIC of RDZ (G to L) for 15 min. Cells were stained with DNA dye DRAQ5. RDZ fluorescence (shown in green) and DRAQ5 fluorescence (shown in red) was excited by the violet (405 nm) and red (640 nm) laser, respectively. BF denotes the brightfield image whereas “+” denotes the merging mode of two or three different images. Scale bar, 5 μm.
FIG 5
FIG 5
The role of efflux in ridinilazole susceptibility in E. coli. (A) Summary of MIC values of E. coli BW25113 strains (wild-type [WT] and its efflux pump-defective mutant ΔEff6), and C. difficile strains (ATCC700057, R20291, and 630). (B) Binding curves of E. coli and C. difficile genomic DNA with ridinilazole (RDZ), the corresponding DMSO treatment was the control. (C) Confocal laser scanning microscopic images of E. coli BW25113 WT and pump-defective mutant ΔEff6 cells that were exposed to 4 × MIC of RDZ for 2 h. BF+RDZ denotes the composite of brightfield and RDZ fluorescent images. For comparative analysis, the Lookup table (LUT) settings were consistent for both strains. Scale bar, 2 μm. (D) Overlayed flow cytometric histograms showing the contrasted RDZ fluorescence between E. coli BW25113 WT and ΔEff6 that were exposed to 4 × MIC of RDZ for 2 h. The DMSO treatment was the control. Each histogram was a representative one from two independent duplicate experiments for each experimental group. The median RDZ fluorescence for the DMSO-treated WT, DMSO-treated ΔEff6, 4 × MIC-treated WT, 4 × MIC-treated ΔEff6 was 169, 238, 541, and 4325 AU (arbitrary unit), respectively; and the count of the corresponding cell event was 98104, 98477, 29668, and 29674, respectively. (E) Colocalization analysis of RDZ and DRAQ5 fluorescence by confocal laser scanning microscopy in the mutant ΔEff6. Upper and lower panels represent the cells exposed to DMSO and 40 × MIC of RDZ for 15 min. Both DMSO- and RDZ-treated cells were stained with DNA dye DRAQ5. RDZ fluorescence (shown in green) and DRAQ5 fluorescence (shown in red) were excited by the violet (405 nm) and red (640 nm) laser, respectively. BF denotes the brightfield image whereas “+” denotes the merging mode of two or three different images. Scale bar, 5 μm.
FIG 6
FIG 6
Transcriptional changes induced by Ridinilazole. (A) Scatterplot of Principal Component Analysis scores from all genes in C. difficile strain 630 treated with 4× MIC ridinilazole (0.25 μg/mL) or DMSO at 15 min, 1 h, 2 h, and 3 h postexposure. Principal Components 1 and 2 together accounted for 63.33% of variance in the data set. (B) Heatmap of 163 genes (top 100 differentially expressed genes and the genes involved in oxidative phosphorylation, bacterial chemotaxis, cationic antimicrobial peptide [CAMP] resistance, and Stickland metabolism pathways). The rows represent genes and the columns represent samples from all four time points. A high-resolution copy (Supplementary Data File 2) of this heatmap with gene names has been made available through GitHub (see Data Availability section). The genes are also listed in Table S6. (C) KEGG pathway enrichment at 15 min time-point. The bars represent the negative logarithm (base 10) of the enrichment P-values. The numbers inside the bars represent the ratio of the number of differentially expressed genes in the query set and the total number of genes in the pathway.

References

    1. CDC. 2019. Antibiotic resistance threats in the United States, 2019. CDC, Atlanta, GA.
    1. Aslam S, Hamill RJ, Musher DM. 2005. Treatment of Clostridium difficile-associated disease: old therapies and new strategies. Lancet Infect Dis 5:549–557. doi:10.1016/S1473-3099(05)70215-2. - DOI - PubMed
    1. Kelly CP. 2012. Can we identify patients at high risk of recurrent Clostridium difficile infection? Clin Microbiol Infect 18 Suppl 6:21–27. doi:10.1111/1469-0691.12046. - DOI - PubMed
    1. Olsen MA, Yan Y, Reske KA, Zilberberg MD, Dubberke ER. 2015. Recurrent Clostridium difficile infection is associated with increased mortality. Clin Microbiol Infect 21:164–170. doi:10.1016/j.cmi.2014.08.017. - DOI - PubMed
    1. Enoch DA, Murray-Thomas T, Adomakoh N, Dedman D, Georgopali A, Francis NA, Karas A. 2020. Risk of complications and mortality following recurrent and non-recurrent Clostridioides difficile infection: a retrospective observational database study in England. J Hosp Infect 106:793–803. doi:10.1016/j.jhin.2020.09.025. - DOI - PubMed

Publication types

MeSH terms