

Getting Smaller by Denaturation: Acid-Induced Compaction of Antibodies
- PMID: 37093025
- PMCID: PMC10150727
- DOI: 10.1021/acs.jpclett.3c00258
Getting Smaller by Denaturation: Acid-Induced Compaction of Antibodies
Abstract
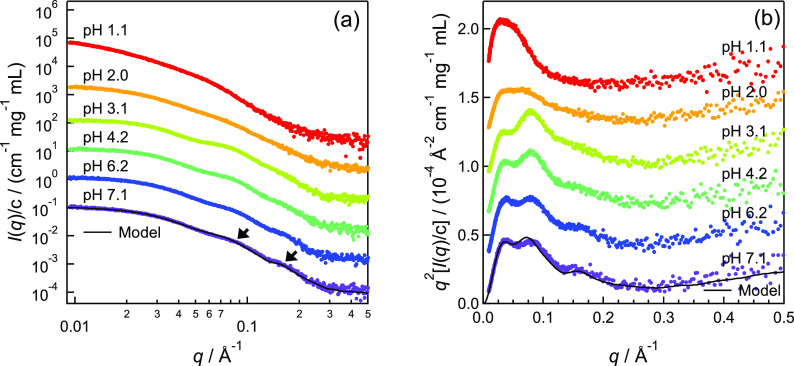
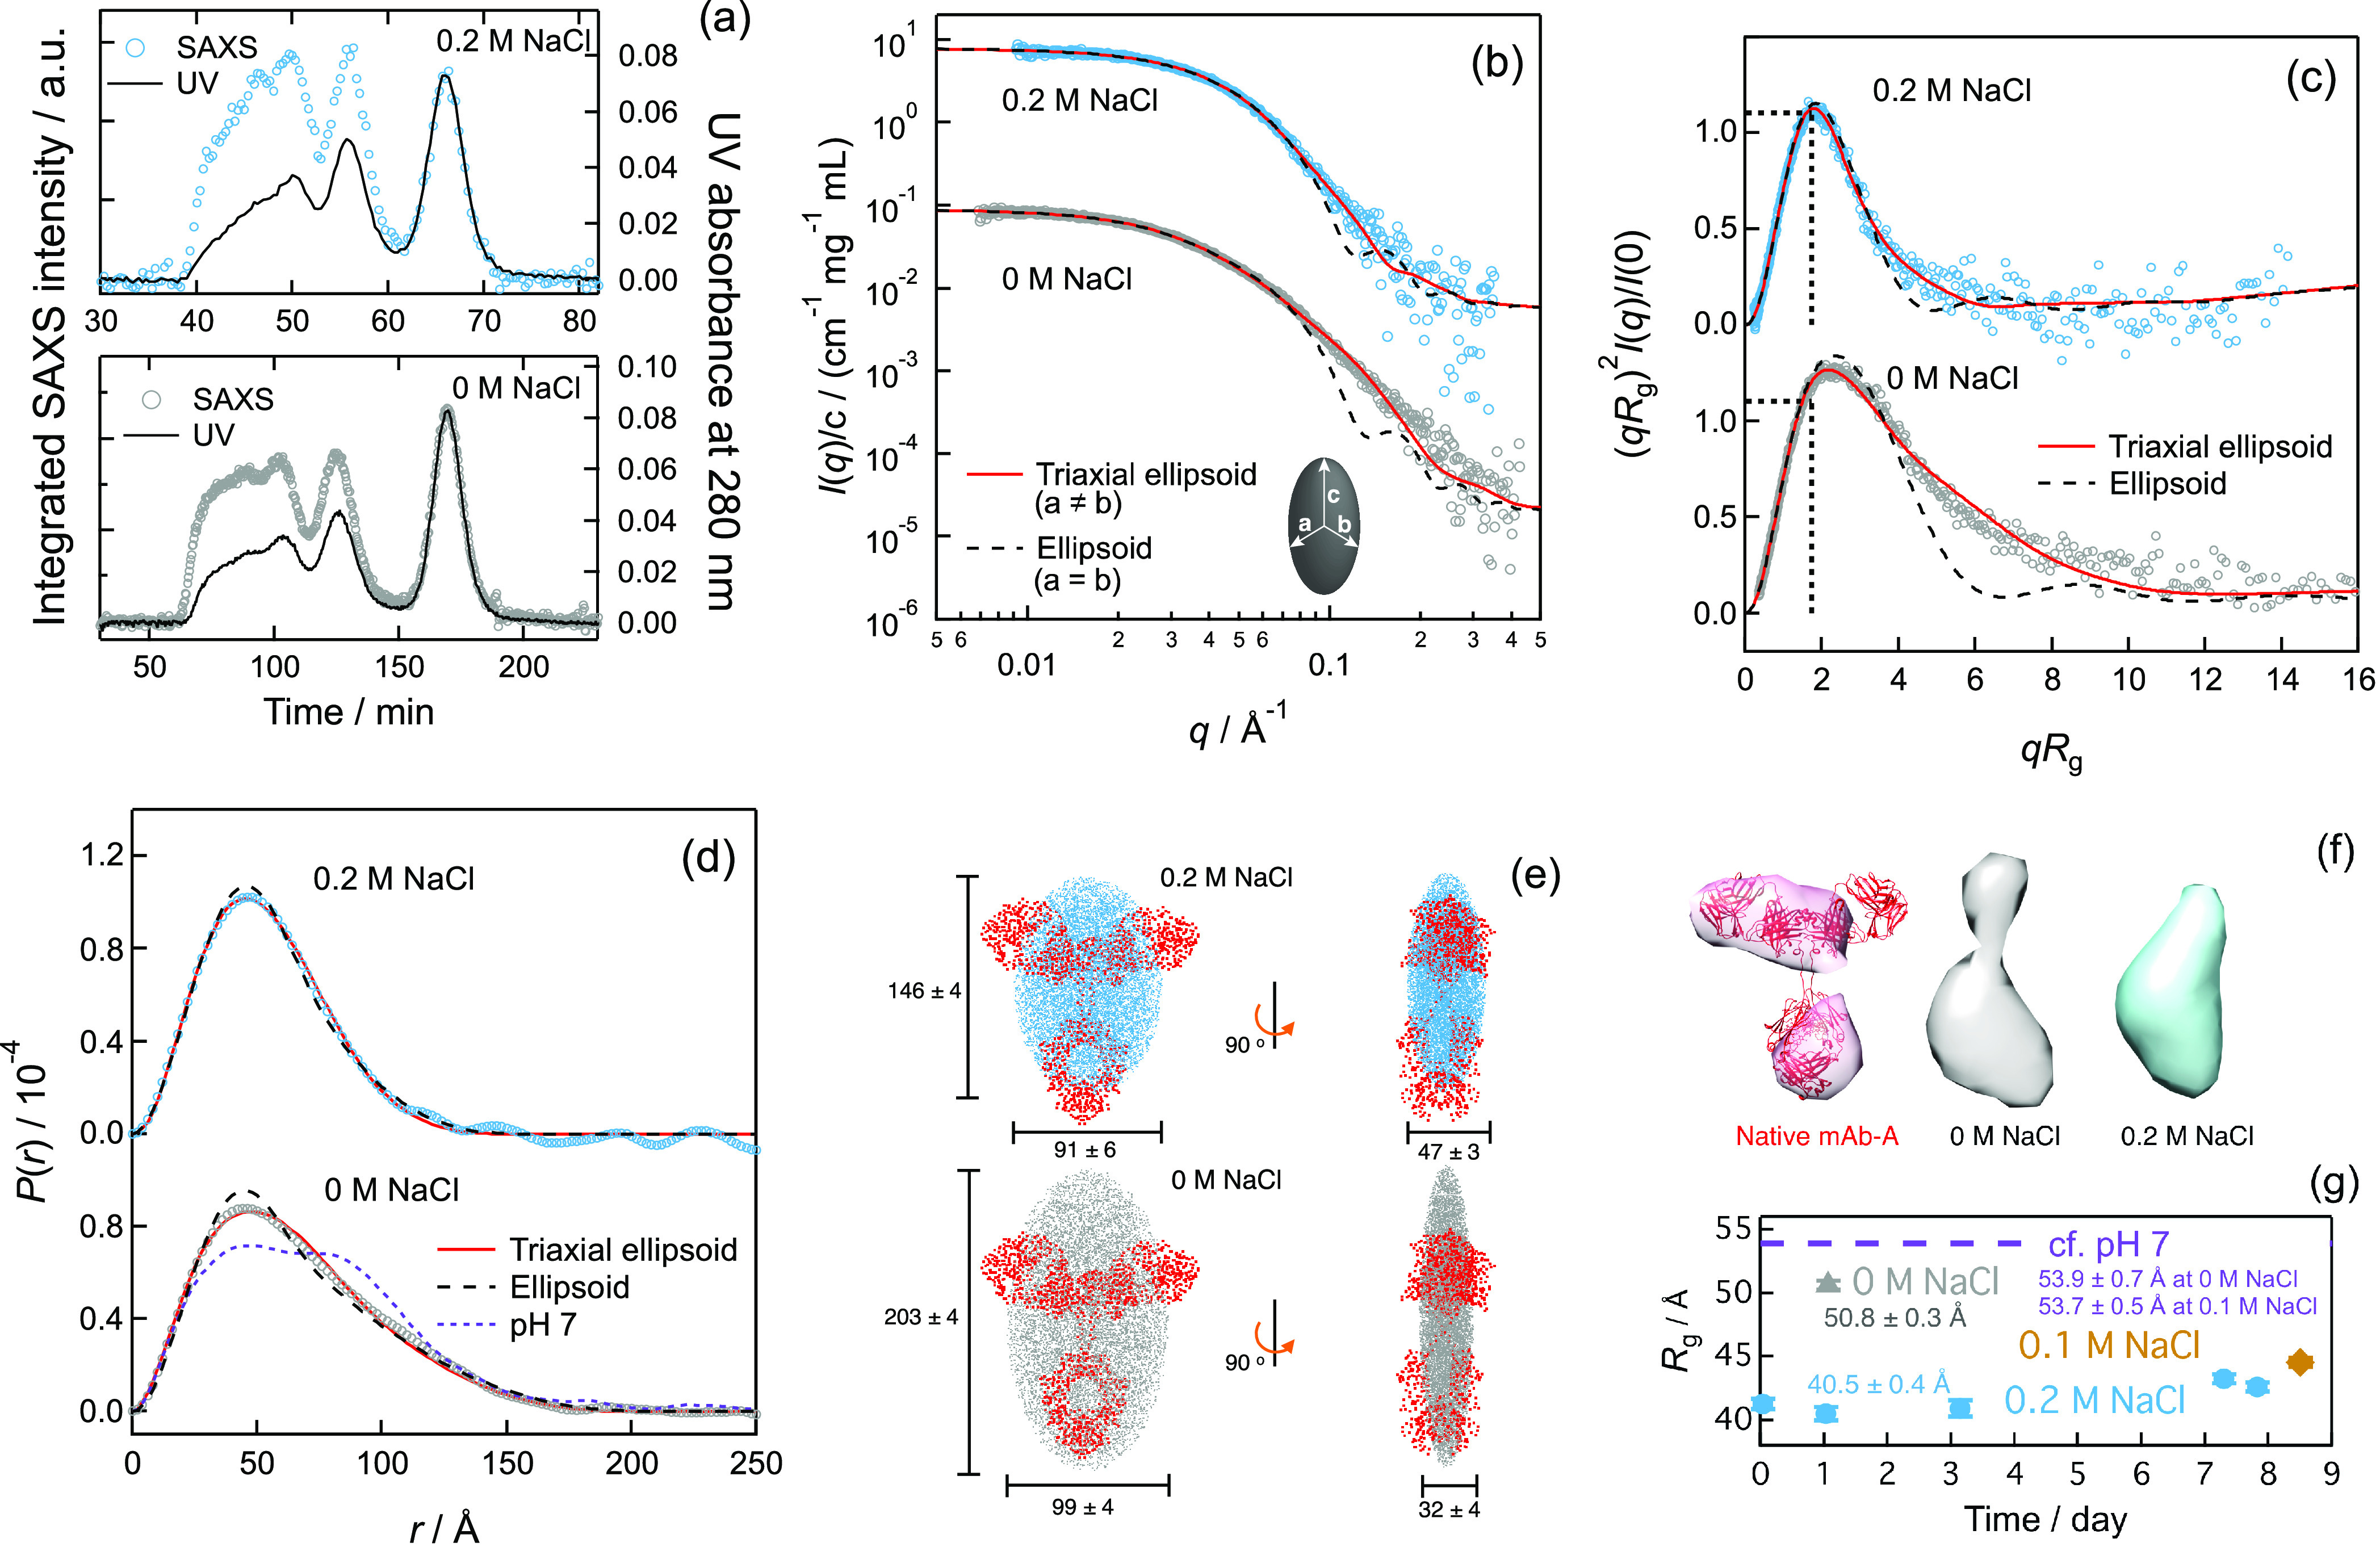
Protein denaturation is a ubiquitous process that occurs both in vitro and in vivo. While our molecular understanding of the denatured structures of proteins is limited, it is commonly accepted that the loss of unique intramolecular contacts makes proteins larger. Herein, we report compaction of the immunoglobulin G1 (IgG1) protein upon acid denaturation. Small-angle X-ray scattering coupled with size exclusion chromatography revealed that IgG1 radii of gyration at pH 2 were ∼75% of those at a neutral pH. Scattering profiles showed a compact globular shape, supported by analytical ultracentrifugation. The acid denaturation of proteins with a decrease in size is energetically costly, and acid-induced compaction requires an attractive force for domain reorientation. Such intramolecular aggregation may be widespread in immunoglobulin proteins as noncanonical structures. Herein, we discuss the potential biological significance of these noncanonical structures of antibodies.
Conflict of interest statement
The authors declare no competing financial interest.
Figures


Similar articles
-
Cue to Acid-Induced Long-Range Conformational Changes in an Antibody Preceding Aggregation: The Structural Origins of the Subpeaks in Kratky Plots of Small-Angle X-ray Scattering.Int J Mol Sci. 2023 Jul 27;24(15):12042. doi: 10.3390/ijms241512042. Int J Mol Sci. 2023. PMID: 37569415 Free PMC article.
-
IgG4 and IgG1 undergo common acid-induced compaction into an alternatively folded state.FEBS Lett. 2025 May;599(10):1433-1441. doi: 10.1002/1873-3468.70031. Epub 2025 Mar 17. FEBS Lett. 2025. PMID: 40095324
-
The methanol-induced globular and expanded denatured states of cytochrome c: a study by CD fluorescence, NMR and small-angle X-ray scattering.J Mol Biol. 1996 Jun 14;259(3):512-23. doi: 10.1006/jmbi.1996.0336. J Mol Biol. 1996. PMID: 8676385
-
Size-exclusion chromatography combined with solution X-ray scattering measurement of the heat-induced aggregates of water-soluble proteins at low ionic strength in a neutral solution.J Chromatogr A. 2019 Oct 11;1603:190-198. doi: 10.1016/j.chroma.2019.06.042. Epub 2019 Jun 22. J Chromatogr A. 2019. PMID: 31277950
-
Denatured states of yeast phosphoglycerate kinase.Biochemistry (Mosc). 1998 Mar;63(3):259-75. Biochemistry (Mosc). 1998. PMID: 9526123 Review.
Cited by
-
Nanoparticle Targeting Strategies for Lipid and Polymer-Based Gene Delivery to Immune Cells In Vivo.Small Sci. 2024 Jul 30;4(9):2400248. doi: 10.1002/smsc.202400248. eCollection 2024 Sep. Small Sci. 2024. PMID: 40212067 Free PMC article.
-
Hybrid Mass Spectrometry Applied across the Production of Antibody Biotherapeutics.J Am Soc Mass Spectrom. 2025 Jan 1;36(1):44-57. doi: 10.1021/jasms.4c00253. Epub 2024 Nov 21. J Am Soc Mass Spectrom. 2025. PMID: 39573914 Free PMC article.
-
Mechanistic Insight into Poly-Reactivity of Immune Antibodies upon Acid Denaturation or Arginine Mutation in Antigen-Binding Regions.Antibodies (Basel). 2023 Oct 13;12(4):64. doi: 10.3390/antib12040064. Antibodies (Basel). 2023. PMID: 37873861 Free PMC article. Review.
-
Phone2SAS: 3D scanning by smartphone aids the realization of small-angle scattering.Biophys Physicobiol. 2023 May 10;20(2):e200021. doi: 10.2142/biophysico.bppb-v20.0021. eCollection 2023. Biophys Physicobiol. 2023. PMID: 38496242 Free PMC article.
-
Cue to Acid-Induced Long-Range Conformational Changes in an Antibody Preceding Aggregation: The Structural Origins of the Subpeaks in Kratky Plots of Small-Angle X-ray Scattering.Int J Mol Sci. 2023 Jul 27;24(15):12042. doi: 10.3390/ijms241512042. Int J Mol Sci. 2023. PMID: 37569415 Free PMC article.
References
-
- Lesk A. M.Introduction to Protein Science: Architecture, Function, and Genomics, 3rd ed.; Oxford University Press: Oxford, U.K., 2016.
-
- Joubert M. K.; Hokom M.; Eakin C.; Zhou L.; Deshpande M.; Baker M. P.; Goletz T. J.; Kerwin B. A.; Chirmule N.; Narhi L. O.; et al. Highly Aggregated Antibody Therapeutics Can Enhance the in Vitro Innate and Late-Stage T-Cell Immune Responses. J. Biol. Chem. 2012, 287, 25266–25279. 10.1074/jbc.M111.330902. - DOI - PMC - PubMed
-
- Guidance for Industry: Immunogenicity Assessment for Therapeutic Protein Products. Food and Drug Administration, Center for Drug Evaluation and Research (CDER), Center for Biologics Evaluation and Research (CBER), 2014.
MeSH terms
Substances
LinkOut - more resources
Full Text Sources
