. 2023 Jun 1;324(6):C1199-C1212.
doi: 10.1152/ajpcell.00425.2022. Epub 2023 Apr 24.

p38 MAPK activation and STIM1-Orai3 association mediate TRPC6 externalization

Affiliations

p38 MAPK activation and STIM1-Orai3 association mediate TRPC6 externalization

Pinaki Chaudhuri et al. Am J Physiol Cell Physiol. .

Abstract

Endothelial cell (EC) migration is critical for the repair of monolayer disruption following angioplasties, but migration is inhibited by lipid oxidation products, including lysophosphatidylcholine (lysoPC), which open canonical transient receptor potential 6 (TRPC6) channels. TRPC6 activation requires an increase in intracellular Ca2+ concentration ([Ca2+]i), the source of which is unknown. LysoPC can activate phospholipase A2 to release arachidonic acid (ArA). ArA can activate arachidonic acid-regulated calcium (ARC) channels that are formed by stromal interaction molecule 1 (STIM1) and Orai1 and Orai3 proteins. Both lysoPC and ArA can activate p38 mitogen-activated protein kinase (MAPK) that induces the phosphorylation required for STIM1-Orai3 association. This is accompanied by an increase in [Ca2+]i and TRPC6 externalization. The effect of lysoPC and ArA is not additive, suggesting activation of the same pathway. The increase in [Ca2+]i activates an Src kinase that leads to TRPC6 activation. Downregulation of Orai3 using siRNA blocks the lysoPC- or ArA-induced increase in [Ca2+]i and TRPC6 externalization and preserves EC migration. These data show that lysoPC induces activation of p38 MAPK, which leads to STIM1-Orai3 association and increased [Ca2+]i. This increase in [Ca2+]i activates an Src kinase leading to TRPC6 externalization, which initiates a cascade of events ending in cytoskeletal changes that disrupt EC migration. Blocking this pathway preserves EC migration in the presence of lipid oxidation products.NEW & NOTEWORTHY The major lysophospholipid component in oxidized LDL, lysophosphatidylcholine (lysoPC), can activate p38 MAP kinase, which in turn promotes externalization of Orai3 and STIM1-Orai3 association, suggesting involvement of arachidonic acid-regulated calcium (ARC) channels. The subsequent increase in intracellular calcium activates an Src kinase required for TRPC6 externalization. TRPC6 activation, which has been shown to inhibit endothelial cell migration, is blocked by p38 MAP kinase or Orai3 downregulation, and this partially preserves endothelial migration in lysoPC.

Keywords: TRPC6; arachidonic acid; calcium; endothelial; migration.


Conflict of interest statement

No conflicts of interest, financial or otherwise, are declared by the authors.

Figures

None
Graphical abstract
Figure 1.
Figure 1.
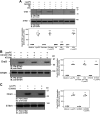
Exogenous ArA and lysoPC induce TRPC6 externalization and inhibit EC migration. EA.hy926 ECs were incubated with ArA (8 µmol/L or 40 µmol/L) (A) or with lysoPC (12.5 µmol/L) and/or ArA (8 µmol/L) (B) for 15 min. Externalization of TRPC6 was detected by biotinylation assay and total TRPC6 by immunoblot analysis. Actin served as the loading control. Densitometry measurements of Biotin-TRPC6 are represented in dot-whisker plots in the right panels of A and B (n = 3 independent experiments, for A: *P = 0.0001 compared with control, †P = 0.999 compared with 40 µmol/L; for B: *P = 0.0014 compared with control, †P = 0.999 compared with LysoPC or ArA alone). C: EA.hy926 ECs were made quiescent for 6 h. The migration assay was initiated in the presence or absence of lysoPC (12.5 µmol/L) and/or ArA (8 µmol/L), and was assessed after 24 h. Upper panel: representative images are shown at ×40 magnification (scale bar, 100 µm). Arrow indicates the starting line of EC migration. Lower panel: EC migration was quantitated and represented as a dot-whisker plot (n = 3 independent experiments, *P < 0.0001 compared with medium, †P = 0.227 compared with LysoPC + ArA, ‡P = 0.999 compared with LysoPC+ArA). D: EA.hy926 ECs were pretreated with the CRAC channel inhibitor Synta66 (5 µmol/L) for 1 h and then incubated with lysoPC (12.5 µmol/L) for 15 min. TRPC6 externalization was detected by biotinylation assay and total TRPC6 by immunoblot analysis. Actin served as the loading control. Densitometry measurements of Biotin-TRPC6 are represented in dot-whisker plots in the right panel (n = 3 independent experiments, *P = 0.0042 compared with medium, †P = 0.0044 compared with Synta66 alone, ‡P = 0.999 compared with LysoPC alone). A–D: statistical analysis was performed using one-way ANOVA with Tukey’s multiple comparison test. ArA, arachidonic acid; EC, endothelial cell; lysoPC, lysophosphatidylcholine; TRPC6, canonical transient receptor potential 6.
Figure 2.
Figure 2.
Exogenous lysoPC and ArA induce Orai3 externalization. A and B: EA.hy926 ECs were incubated with lysoPC (12.5 µmol/L) or ArA (8 µmol/L) for 15 min. Externalization of Orai3 after incubation with lysoPC (A) or ArA (B) was determined by biotinylation assay and total Orai3 by immunoblot analysis. Actin served as the loading control. Densitometry measurements of Biotin-Orai3 are represented in dot-whisker plots in the right panels of A and B. Statistical analysis for A and B was performed with unpaired Student’s t test (n = 3 independent experiments, for A: *P = 0.009 compared with medium; for B: *P = 0.0001 compared with medium). ArA, arachidonic acid; lysoPC, lysophosphatidylcholine.
Figure 3.
Figure 3.
Downregulation of Orai3 blocks lysoPC- and ArA-induced TRPC6 externalization. A and B: EA.hy926 ECs were transiently transfected with control siRNA (NsiRNA) (40 nmol/L), Orai3 siRNA (20 nmol/L), or Orai1 siRNA (20 nmol/L) for 24 h. After 48 h, Orai3 (A) and Orai1 (B) protein levels were determined by immunoblot analysis. Actin served as the loading control. Densitometry measurements of Orai protein levels are represented in dot-whisker plots in the right panel of A and B (n = 3 independent experiments). C and D: EA.hy926 ECs were transiently transfected with control siRNA (NsiRNA) (40 nmol/L) or Orai3 siRNA (20 nmol/L) for 24 h before incubation with lysoPC (12.5 µmol/L) or ArA (8 µmol/L) for 15 min. After downregulation of Orai3, externalization of TRPC6 in response to lysoPC (C) or ArA (D) was detected by biotinylation assay and total TRPC6 by immunoblot analysis. Actin served as the loading control. Black lines indicate lanes rearranged from the same gel. All bands are from the same gel. Densitometry measurements of Biotin-TRPC6 are represented in dot-whisker plots in the right panels of C and D (n = 3 independent experiments). Statistical analysis for A–D was performed using one-way ANOVA with Tukey’s multiple comparison test (for A: *P < 0.0001 compared with NsiRNA; for B: *P = 0.0039 compared with NsiRNA, †P = 0.0039 compared with Orai3 siRNA; for C: *P < 0.0001 compared with NsiRNA, †P < 0.0001 compared with Orai3 siRNA + LysoPC; for D: *P < 0.0001 compared with NsiRNA, †P < 0.0001 compared with Orai3 siRNA + ArA). ArA, arachidonic acid; EC, endothelial cell; lysoPC, lysophosphatidylcholine; NsiRNA, control siRNA with no homology to any known gene; siRNA, small interfering RNA; TRPC6, canonical transient receptor potential 6.
Figure 4.
Figure 4.
Downregulation of Orai3 blocks lysoPC- and ArA-induced increase in [Ca2+]i and inhibition of EC migration. A and B: EA.hy926 ECs were transfected with control NsiRNA (40 nmol/L) (left panels) or Orai3 siRNA (20 nmol/L) (middle panels) for 24 h, then loaded with the FITC-conjugated fluorophore Calbryte 520 AM dye. ECs were suspended and loaded into the sort chamber of a BD FACSMelody cell sorter maintained at 37°C. After adjusting the baseline, lysoPC (12.5 µmol/L) (A) or ArA (8 µmol/L) (B) was added. Using the kinetic reading mode at Ex/Em 490/525 nm, relative changes in [Ca2+]i were recorded. The lysoPC-induced or ArA-induced fold increase in relative [Ca2+]i from baseline was calculated and presented as a dot-whisker plot (right panels) (n = 3 independent experiments). Statistical analysis was performed using unpaired Student’s t test (for A: *P = 0.0096 compared with NsiRNA; for B: *P = 0.0049 compared with NsiRNA). C and D: EA.hy926 ECs were transiently transfected with control siRNA (NsiRNA) (40 nmol/L) or Orai3 siRNA (20 nmol/L) for 24 h. Then EA.hy926 ECs were made quiescent for 6 h. The migration assay was initiated and migration in the presence or absence of lysoPC (12.5 µmol/L) (C) or ArA (8 µmol/L) (D) was assessed after 24 h. Upper panels: representative images are shown at ×40 magnification (scale bar, 100 µm). Arrow indicates the starting line of EC migration. Lower panels: EC migration was quantitated and represented graphically as a dot-whisker plot (n = 3 independent experiments). Statistical analysis for C and D was performed using one-way ANOVA with Tukey’s multiple comparison test (for C and D: *P < 0.0001 compared with NsiRNA; for C: †P < 0.0001 compared with Orai3 siRNA, and §P = 0.0002 compared with NsiRNA + LysoPC; for D: §P = 0.0077 compared with NsiRNA + ArA). ArA, arachidonic acid; EC, endothelial cell; lysoPC, lysophosphatidylcholine; NsiRNA, control siRNA with no homology to any known gene; siRNA, small interfering RNA; TRPC6, canonical transient receptor potential 6.
Figure 5.
Figure 5.
LysoPC-induced STIM1-Orai3 association is blocked by inhibition of serine/threonine kinases. A–C: EA.hy926 EC were pretreated with inhibitors, and then incubated with lysoPC (12.5 µmol/L) for 15 min. ECs were permeabilized, and cytosol and membrane fractions were separated. After membrane solubilization, the membrane STIM1 was immunoprecipitated with anti-STIM1 antibody, and Orai3 was detected by immunoblot analysis. Total STIM1 in the membrane fraction was determined by immunoblot analysis. A: EA.hy926 ECs were pretreated with a general tyrosine kinase inhibitor Genisten (30 µmol/L) for 1 h, a general serine/threonine kinase inhibitor H8 (15 µmol/L) for 30 min, or a Src kinase inhibitor PP2 (10 µmol/L) for 30 min. Black lines indicate lanes rearranged from the same gel. All bands are from the same gel. EA.hy926 ECs were pretreated a protein kinase D inhibitor CID 2011756 (5 µmol/L) or a protein kinase A inhibitor KT5720 (500 nmol/L) for 1 h (B), or with a protein kinase C inhibitor GO6983 (2 µmol/L) for 1 h (C). Densitometry measurements of Orai3 are represented in dot-whisker plots in the lower panel of A and right panels of B and C (n = 3 independent experiments). Statistical analysis was performed using one-way ANOVA with Tukey’s multiple comparisons test (for A: aP < 0.0001 compared with medium, bP < 0.0001 compared with Genisten alone, cP = 0.999 compared with LysoPC alone, dP = 0.999 compared with H8 alone, eP < 0.0001 compared with LysoPC alone, fP < 0.0001 compared with PP2 alone, gP = 0.7452 compared with LysoPC alone; for B: *P < 0.0001 compared with medium, †P < 0.0001 compared with CID 2011756 alone, ‡P = 0.999 compared with LysoPC alone, and §P < 0.0001 compared with KT5720 alone; for C: *P < 0.0001 compared with medium, †P < 0.0001 compared with GO6983 alone, and ‡P = 0.0.822 compared with lysoPC alone). ArA, arachidonic acid; EC, endothelial cell; lysoPC, lysophosphatidylcholine; NsiRNA, control siRNA with no homology to any known gene; siRNA, small interfering RNA; STIM1, stromal interaction molecule 1; TRPC6, canonical transient receptor potential 6.
Figure 6.
Figure 6.
LysoPC-induced STIM1-Orai3 association is blocked by p38 MAPK inhibition. A and B: EA.hy926 ECs were pretreated with a p38 MAPK inhibitor SB203580 (5 µmol/L) for 1 h, and then incubated with lysoPC (12.5 µmol/L) for 15 min. A: ECs were permeabilized, and cytosol and membrane fractions were separated. After membrane solubilization, the membrane STIM1 was immunoprecipitated with anti-STIM1 antibody, and Orai3 was detected by immunoblot analysis. Total STIM1 in the membrane fraction was determined by immunoblot analysis. Black lines indicate lanes rearranged from the same gel. All bands are from the same gel. B: ECs were lysed and total Orai3 level was determined by immunoblot analysis. Actin served as the loading control. Densitometry measurements of Orai3 are represented in dot-whisker plots in the right panels of A and B. Statistical analysis for A and B was performed using one-way ANOVA with Tukey’s multiple comparisons test (n = 3 independent experiments, for A: *P < 0.0001 compared with medium, †P = 0.788 compared with SB203580 alone, and ‡P < 0.0001 compared with LysoPC alone; for B *P = 0.999 for all comparisons between groups). ArA, arachidonic acid; EC, endothelial cell; lysoPC, lysophosphatidylcholine; MAPK, mitogen-activated protein kinase; STIM1, stromal interaction molecule 1.
Figure 7.
Figure 7.
LysoPC and ArA induce p38 MAPK phosphorylation, and downregulation of p38 MAPK prevents STIM1-Orai3 association in the presence of lysoPC. EA.hy926 ECs were incubated with lysoPC (12.5 µmol/L) (A) or ArA (8 µmol/L) (B) for 0, 2, 10, or 20 min. After cell lysis, phosphorylated p38 MAPK was detected by immunoblot analysis. Alpha-tubulin served as the loading control. Densitometry measurements of phospho-p38 MAPK protein levels are represented in dot-whisker plots in the right panels. C–E: EA.hy926 ECs were transiently transfected with control siRNA (NsiRNA) (40 nmol/L) or p38 MAPK siRNA (35 nmol/L) for 24 h. After 48 h, p38 MAPK (C) and ERK1/ERK2 (D) protein levels were determined by immunoblot analysis. α-Tubulin served as the loading control (n = 3 independent experiments). E: after transient transfection, ECs were incubated with lysoPC (12.5 µmol/L) for 15 min. ECs were permeabilized, and cytosol and membrane fractions were separated. After membrane solubilization, the membrane STIM1 was immunoprecipitated with anti-STIM1 antibody, and Orai3 was detected by immunoblot analysis. Total STIM1 in the membrane fraction was determined by immunoblot analysis. For A and B, black lines indicate lanes rearranged from the same gel. All bands are from the same gel. Densitometry measurements of phospho-p38 MAPK (A-B), p38 MAPK (C), ERK1/2 (D), or Orai3 (E) are represented in dot-whisker plots in the right panels of A–E. Statistical analysis for A–E was performed using one-way ANOVA with Tukey’s multiple comparison test (n = 3 independent experiments, for A: *P < 0.0001 compared with 0 min, †P = 0.0001 compared with 2 min, ‡P = 0.0315 compared with 0 min, §P < 0.0001 compared with 10 min; for B: *P < 0.0001 compared with 0 min, †P = 0.0026 compared with 0 min, ‡P = 0.0031 compared with 2 min, §P = 0.0002 compared with 2 min; for C, *P = 0.0002 compared with NsiRNA; for E, *P < 0.0001 compared with NsiRNA, †P < 0.0001 compared with NsiRNA + lysoPC). ArA, arachidonic acid; EC, endothelial cell; ERK: extracellular regulated kinase; lysoPC, lysophosphatidylcholine; MAPK, mitogen-activated protein kinase; NsiRNA, control siRNA with no homology to any known gene; siRNA, small interfering RNA; STIM1, stromal interaction molecule 1; TRPC6, canonical transient receptor potential 6.
Figure 8.
Figure 8.
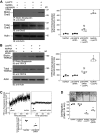
Downregulation of p38 MAPK prevents Orai3 externalization, increased [Ca2+]i, and inhibition of EC migration in the presence of lysoPC. A–D: EA.hy926 ECs were transiently transfected with control siRNA (NsiRNA) (40 nmol/L) or p38 MAPK siRNA (35 nmol/L) for 24 h. After transient transfection, ECs were incubated with lysoPC (12.5 µmol/L) for 15 min. Externalization of Orai3 (A) or TRPC6 (B) was detected by biotinylation assay and total Orai3 (A) or TRPC6 (B) by immunoblot analysis. Actin served as the loading control. Black lines in A indicate lanes rearranged from the same gel. All bands are from the same gel. Densitometry measurements of Biotin-Orai3 or Biotin-TRPC6 are represented in dot plot in the right panels. Statistical analysis was performed using one-way ANOVA with Tukey’s multiple comparison test (n = 3 independent experiments, for A, *P < 0.0001 compared with NsiRNA, †P < 0.0001 compared with NsiRNA + LysoPC, ‡P = 0.0011 compared with p38 MAPK siRNA; for B: *P < 0.0001 compared with NsiRNA, †P < 0.0001 compared with NsiRNA + LysoPC, ‡P = 0.0135 compared with p38 MAPK siRNA). C: after transient transfection, ECs were loaded with the FITC-conjugated fluorophore Calbryte 520 AM dye. ECs were suspended and loaded into the sort chamber of a BD FACSMelody cell sorter maintained at 37°C. After adjusting the baseline, lysoPC (12.5 µmol/L) was added. Using the kinetic reading mode at Ex/Em 490/525 nm, relative changes in [Ca2+]i were recorded in NsiRNA-transfected cells (left panel) or in p38 MAPK siRNA-transfected cells (right panel) (n = 3 independent experiments). The lysoPC-induced fold increase in relative [Ca2+]i from baseline was calculated and presented as a dot-whisker plot (lower panel). Statistical analysis was performed using unpaired Student’s t test (n = 3 independent experiments, *P < 0.0001 compared with NsiRNA). D: after transient transfection, ECs were made quiescent for 6 h. The migration assay was initiated in the presence or absence of lysoPC (12.5 µmol/L), and migration was assessed after 24 h. Upper panel: representative images are shown at ×40 magnification (scale bar, 100 µm). Arrow indicates the starting line of EC migration. Lower panel: EC migration was quantitated and represented as a dot-whisker plot. Statistical analysis was performed using one-way ANOVA with Tukey’s multiple comparison test (n = 3 independent experiments, *P < 0.0001 compared with NsiRNA, †P < 0.0001 compared with p38 MAPK siRNA, and ‡P = 0.0035 compared with NsiRNA + LysoPC). ArA, arachidonic acid; EC, endothelial cell; ERK: extracellular regulated kinase; lysoPC, lysophosphatidylcholine; MAPK, mitogen-activated protein kinase; NsiRNA, control siRNA with no homology to any known gene; siRNA, small interfering RNA; STIM1, stromal interaction molecule 1; TRPC6, canonical transient receptor potential 6.
Figure 9.
Figure 9.
ArA activates a Src kinase, and Src kinase inhibition blocks TRPC6 externalization, but not Orai3 externalization. A: EA.hy926 ECs were pretreated with the BAPTA/AM (300 µmol/L) for 30 min and then incubated with ArA (8 µmol/L) for 2 min. After lysis of the cells, phosphorylated Src kinase was detected by immunoblot analysis. B: EA.hy926 ECs were transiently transfected with control siRNA (NsiRNA) (40 nmol/L) or Orai3 siRNA (20 nmol/L) for 24 h. After downregulation, the cells were incubated with ArA (8 µmol/L) for 2 min. After lysis of the cells, phosphorylated Src kinase was detected by immunoblot analysis. C and D: EA.hy926 ECs were pretreated with a Src kinase inhibitor, PP2 (10 µmol/L) or SU6656 (0.5 µmol/L), for 30 min and then incubated with ArA (8 µmol/L) for 10 min. Orai3 externalization (C) was determined by biotinylation assay and total Orai3 by immunoblot analysis. TRPC6 externalization (D) was determined by biotinylation assay and total TRPC6 by immunoblot analysis. For A–D, actin served as the loading control (n = 3 independent experiments). For A, and C-D, black lines indicate lanes rearranged from the same gel. All bands are from the same gel. Densitometry measurements of phospho-Src (A–B), Biotin-Orai3 (C), or Biotin-TRPC6 (D) are represented in dot-whisker plots in the right panels of AD. Statistical analysis was performed using one-way ANOVA with Tukey’s multiple comparisons test (n = 3 independent experiments, for A: *P = 0.0003 compared with medium; for A: †P = 0.0005 compared with ArA alone; for B: *P < 0.0001 compared with NsiRNA alone, †P = 0.977 compared with Orai3 siRNA alone, and ‡P = 0.0001 compared with NsiRNA + LysoPC; for C: *P < 0.0001 compared with medium alone, †P < 0.0001 compared with PP2 alone, ‡P = 0.999 compared with ArA alone, and §P < 0.0001 compared with SU6656 alone; for D: *P < 0.0001 compared with medium, †P < 0.0001 compared with ArA alone, ‡P = 0.9985 compared with PP2 alone, and §P = 0.999 compared with SU6656 alone). ArA, arachidonic acid; EC, endothelial cell; ERK: extracellular regulated kinase; lysoPC, lysophosphatidylcholine; MAPK, mitogen-activated protein kinase; NsiRNA, control siRNA with no homology to any known gene; siRNA, small interfering RNA; STIM1, stromal interaction molecule 1; TRPC6, canonical transient receptor potential 6.
Figure 10.
Figure 10.
Model of proposed events following EC exposure to lysoPC. LysoPC activates iPLA2, which releases ArA from the plasma membrane. ArA activates p38 MAPK, which causes STIM1 to associate with Orai3 in the plasma membrane, possibly forming or activating ARC channels. The increase in [Ca2+]i activates a Src-family kinase, which leads to TRPC6 channel externalization and activation. (Model created using BioRender.) ArA, arachidonic acid; EC, endothelial cell; ERK: extracellular regulated kinase; lysoPC, lysophosphatidylcholine; MAPK, mitogen-activated protein kinase; STIM1, stromal interaction molecule 1; TRPC6, canonical transient receptor potential 6.

Similar articles

Cited by

References

    1. Murugesan G, Chisolm GM, Fox PL. Oxidized low density lipoprotein inhibits the migration of aortic endothelial cells in vitro. J Cell Biol 120: 1011–1019, 1993. doi:10.1083/jcb.120.4.1011. - DOI - PMC - PubMed
    1. Murugesan G, Fox PL. Role of lysophosphatidylcholine in the inhibition of endothelial cell motility by oxidized low density lipoprotein. J Clin Invest 97: 2736–2744, 1996. doi:10.1172/JCI118728. - DOI - PMC - PubMed
    1. Chaudhuri P, Colles SM, Bhat M, Van Wagoner DR, Birnbaumer L, Graham LM. Elucidation of a TRPC6-TRPC5 channel cascade that restricts endothelial cell movement. Mol Biol Cell 19: 3203–3211, 2008. doi:10.1091/mbc.e07-08-0765. - DOI - PMC - PubMed
    1. Chaudhuri P, Colles SM, Damron DS, Graham LM. Lysophosphatidylcholine inhibits endothelial cell migration by increasing intracellular calcium and activating calpain. Arterioscler Thromb Vasc Biol 23: 218–223, 2003. doi:10.1161/01.atv.0000052673.77316.01. - DOI - PubMed
    1. Rosenbaum MA, Chaudhuri P, Graham LM. Hypercholesterolemia inhibits reendothelialization of arterial injuries by TRPC channel activation. J Vasc Surg 62: 1040–1047.e2, 2015. doi:10.1016/j.jvs.2014.04.033. - DOI - PMC - PubMed

Publication types

MeSH terms

LinkOut - more resources