

Azithromycin Exposure Induces Transient Microbial Composition Shifts and Decreases the Airway Microbiota Resilience from Outdoor PM2.5 Stress in Healthy Adults: a Randomized, Double-Blind, Placebo-Controlled Trial
- PMID: 37093053
- PMCID: PMC10269807
- DOI: 10.1128/spectrum.02066-22
Azithromycin Exposure Induces Transient Microbial Composition Shifts and Decreases the Airway Microbiota Resilience from Outdoor PM2.5 Stress in Healthy Adults: a Randomized, Double-Blind, Placebo-Controlled Trial
Abstract
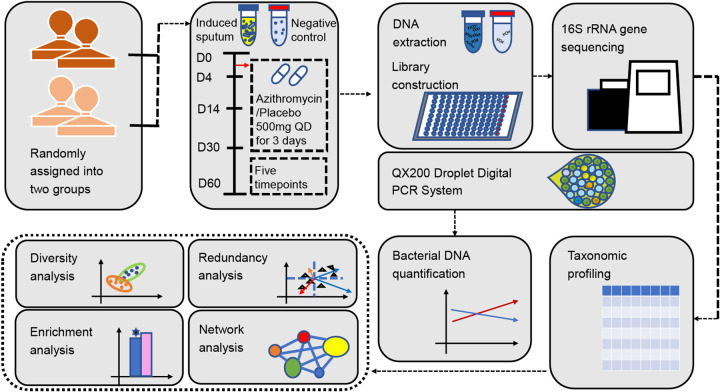
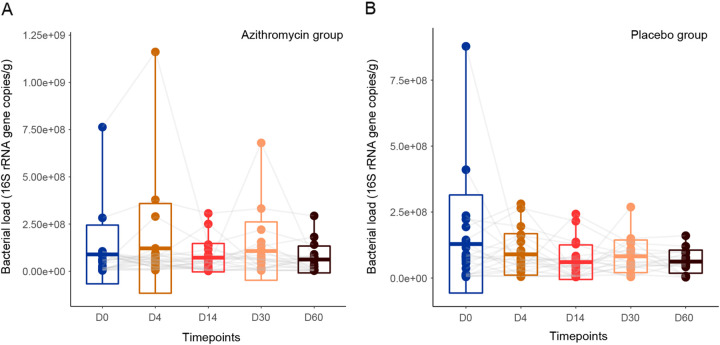
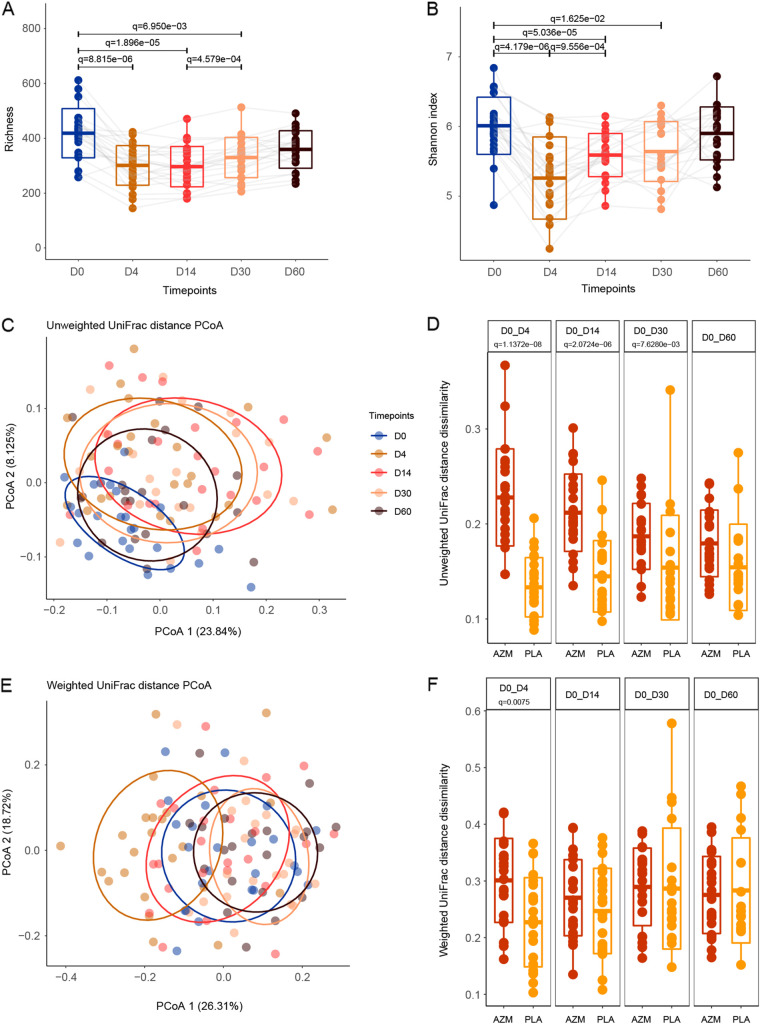
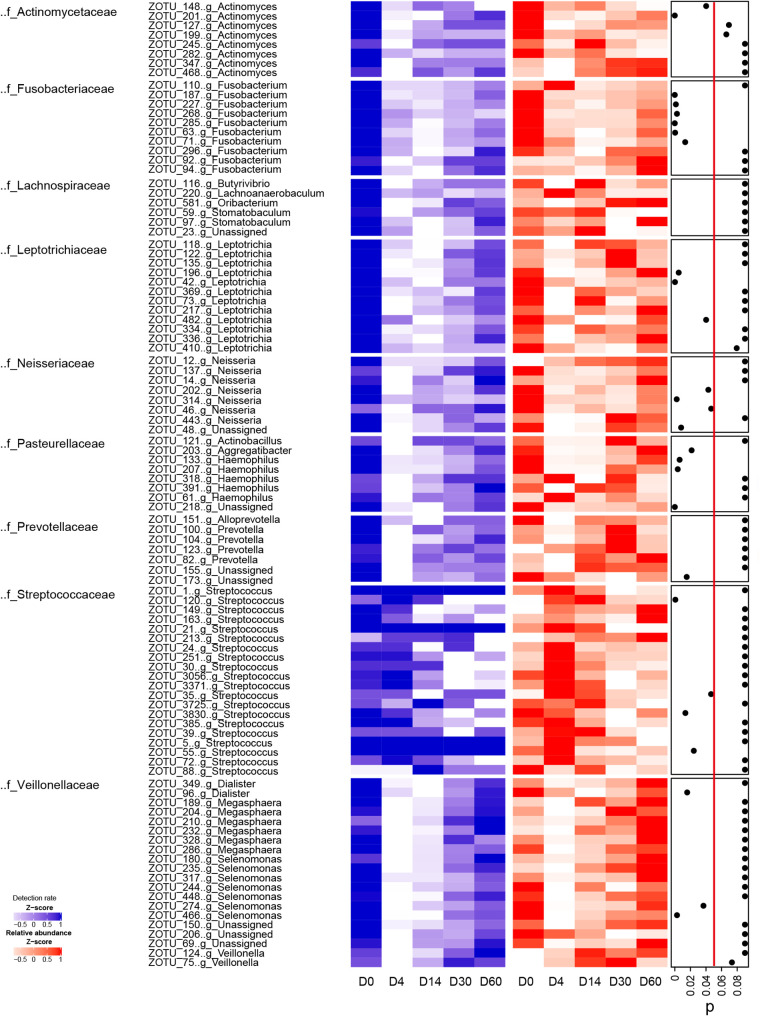
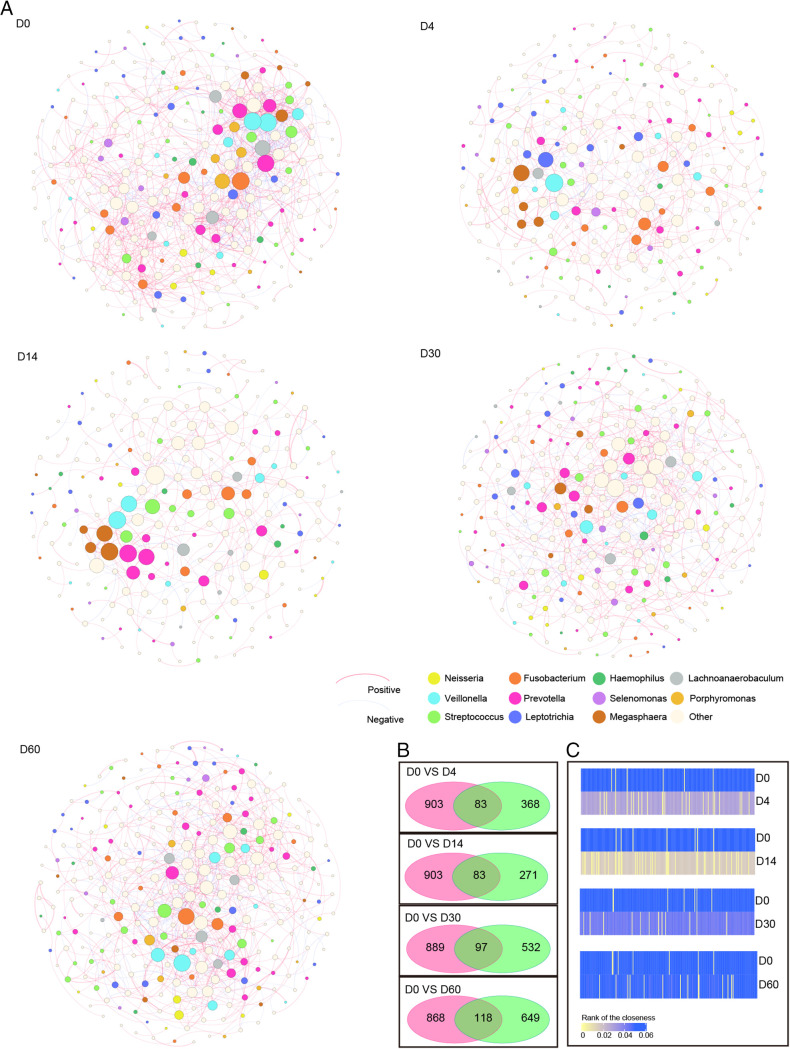
Inappropriate antibiotic prescriptions are common for patients with upper respiratory tract infections (URTIs). Few data exist regarding the effects of antibiotic administration on airway microbiota among healthy adults. We conducted a randomized, double-blind, placebo-controlled trial to characterize the airway microbiota longitudinally in healthy adults using 16S rRNA gene sequencing and quantification. Both the induced sputum and oral wash samples were collected over a 60-day period following a 3-day intervention with 500 mg azithromycin or placebo. Environmental information, including air quality data (particulate matter [PM2.5] and PM10, air quality index [AQI] values), were also collected during the study. A total of 48 healthy volunteers were enrolled and randomly assigned into two groups. Azithromycin did not alter bacterial load but significantly reduced species richness and Shannon index. Azithromycin exposure resulted in a decrease in the detection rate and relative abundance of different genera belonging to Veillonellaceae, Leptotrichia, Fusobacterium, Neisseria, and Haemophilus. In contrast, the relative abundance of taxa belonging to Streptococcus increased immediately after azithromycin intervention. The shifts in the diversity of the microbiology composition took between 14 and 60 days to recover, depending on the measure used: either UniFrac phylogenetic distance or α-diversity. Outdoor environmental perturbations, especially the high concentration of PM2.5, contributed to novel variability in microbial community composition of the azithromycin group at D30 (30 days after baseline). The network analysis found that azithromycin altered the microbial interactions within airway microbiota. The influence was still obvious at D14 when the relative abundance of most taxa had returned to the baseline level. Compared to the sputum microbiota, oral cavity microbiota had a different pattern of change over time. The induced sputum microbial data can represent the airway microbiota composition in healthy adults. Azithromycin may have transient effects in the airway microbiota of healthy adults and decrease the airway microbiota resilience against outdoor environmental stress. The influence of azithromycin on microbial interactions is noteworthy, although the airway microbiota has returned to a near-baseline level. IMPORTANCE The influence of antibiotic administration on the airway microbiota of healthy adults remains unknown. This study is a randomized, double-blind, placebo-controlled trial aiming to investigate the microbial shifts in airways after exposure to azithromycin among heathy adults. We find that azithromycin changes the airway microbial community composition of healthy adults and decreases the airway microbiota resilience against outdoor environmental stress. This study depicts the longitudinal recovery trajectory of airway microbiota after the antibiotic perturbation and may provide reference for appropriate antibiotic prescription.
Keywords: PM2.5; airway microbiota; azithromycin; biodiversity; healthy volunteers; network; stability.
Conflict of interest statement
The authors declare no conflict of interest.
Figures
References
-
- Dickson RP, Erb-Downward JR, Falkowski NR, Hunter EM, Ashley SL, Huffnagle GB. 2018. The lung microbiota of healthy mice are highly variable, cluster by environment, and reflect variation in baseline lung innate immunity. Am J Respir Crit Care Med 198:497–508. doi: 10.1164/rccm.201711-2180OC. - DOI - PMC - PubMed
-
- Pattaroni C, Watzenboeck ML, Schneidegger S, Kieser S, Wong NC, Bernasconi E, Pernot J, Mercier L, Knapp S, Nicod LP, Marsland CP, Roth-Kleiner M, Marsland BJ. 2018. Early-life formation of the microbial and immunological environment of the human airways. Cell Host Microbe 24:857–865.e4. doi: 10.1016/j.chom.2018.10.019. - DOI - PubMed
-
- Segal LN, Clemente JC, Tsay JJ, Koralov SB, Keller BC, Wu BG, Li Y, Shen N, Ghedin E, Morris A, Diaz P, Huang L, Wikoff WR, Ubeda C, Artacho A, Rom WN, Sterman DH, Collman RG, Blaser MJ, Weiden MD. 2016. Enrichment of the lung microbiome with oral taxa is associated with lung inflammation of a Th17 phenotype. Nat Microbiol 1:16031. doi: 10.1038/nmicrobiol.2016.31. - DOI - PMC - PubMed
Publication types
MeSH terms
Substances
LinkOut - more resources
Full Text Sources
