. 2023 Apr 15;12(4):bio059889.
doi: 10.1242/bio.059889. Epub 2023 Apr 21.

Zika virus-induces metabolic alterations in fetal neuronal progenitors that could influence in neurodevelopment during early pregnancy

Affiliations

Zika virus-induces metabolic alterations in fetal neuronal progenitors that could influence in neurodevelopment during early pregnancy

Javier Gilbert-Jaramillo et al. Biol Open. .

Abstract

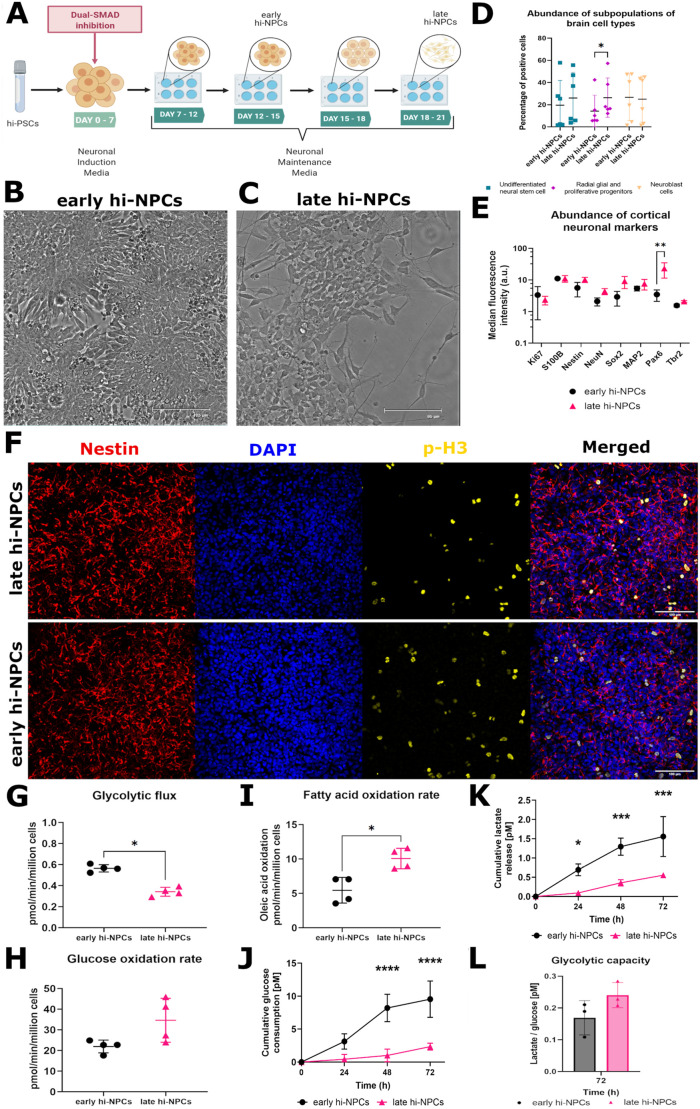
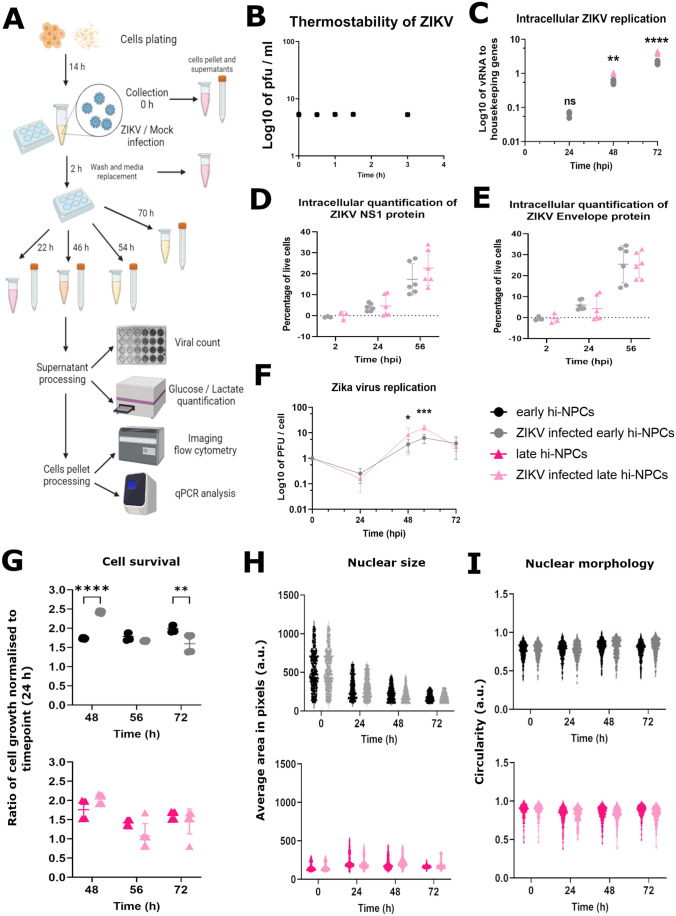
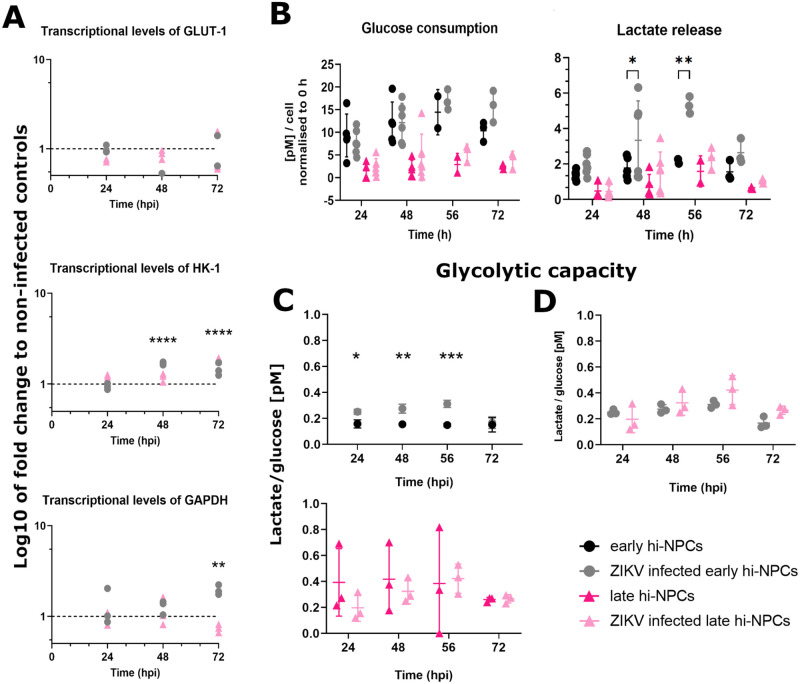
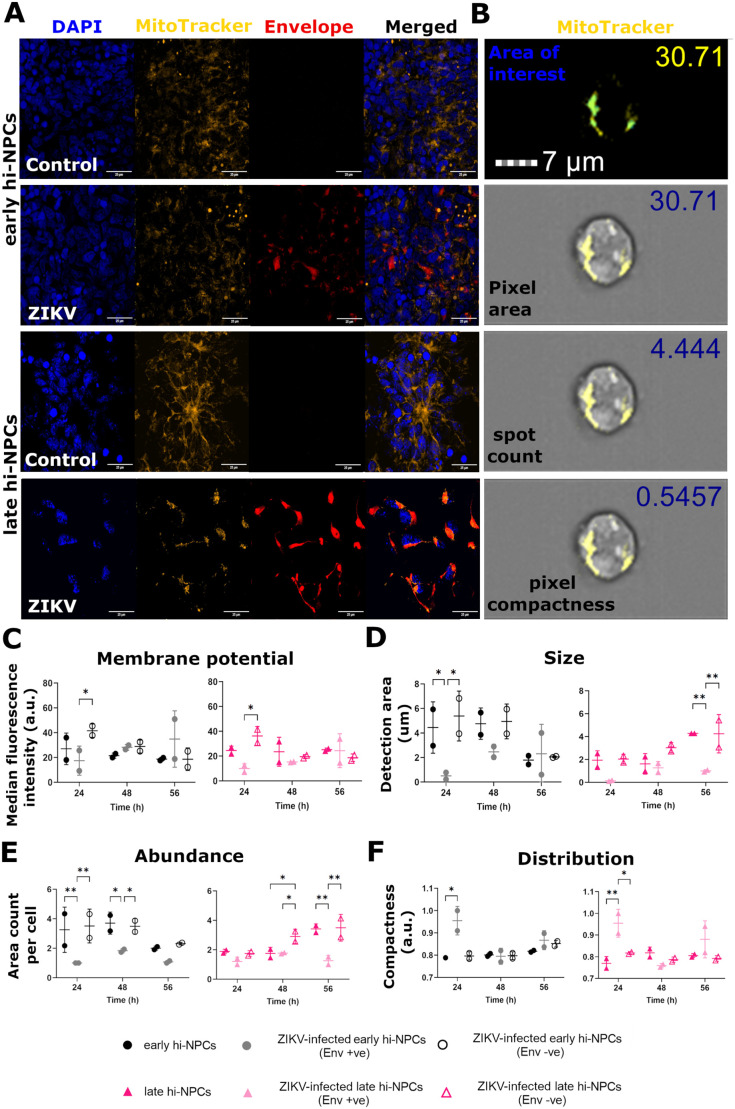
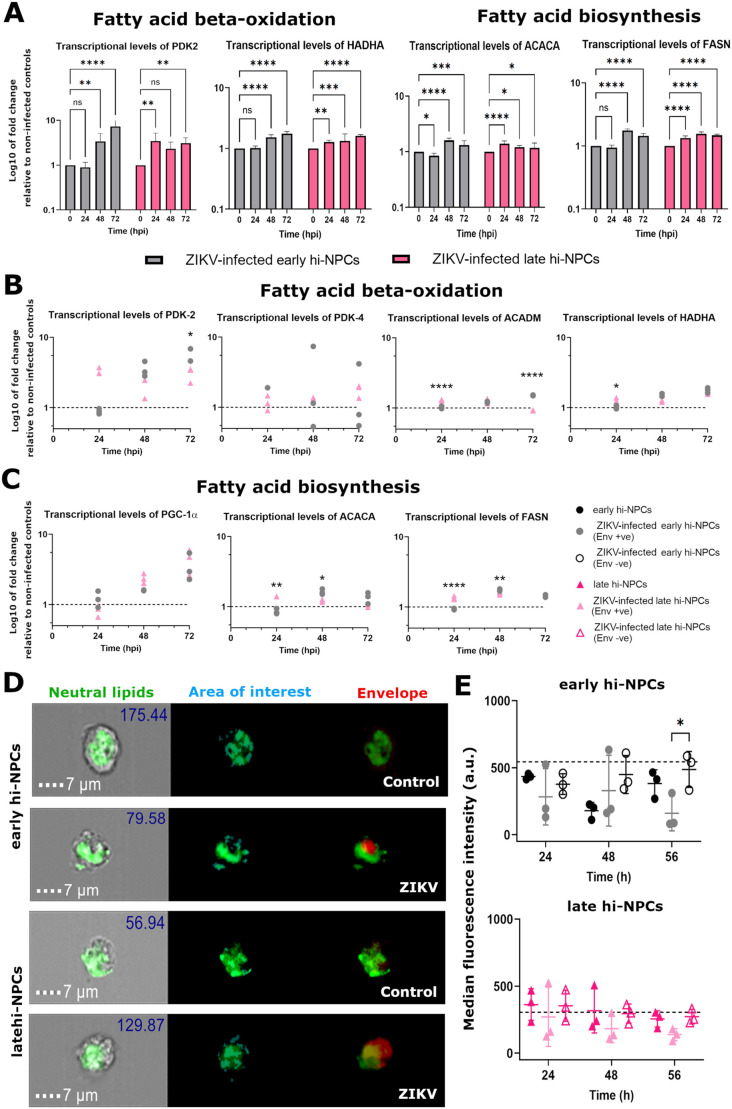
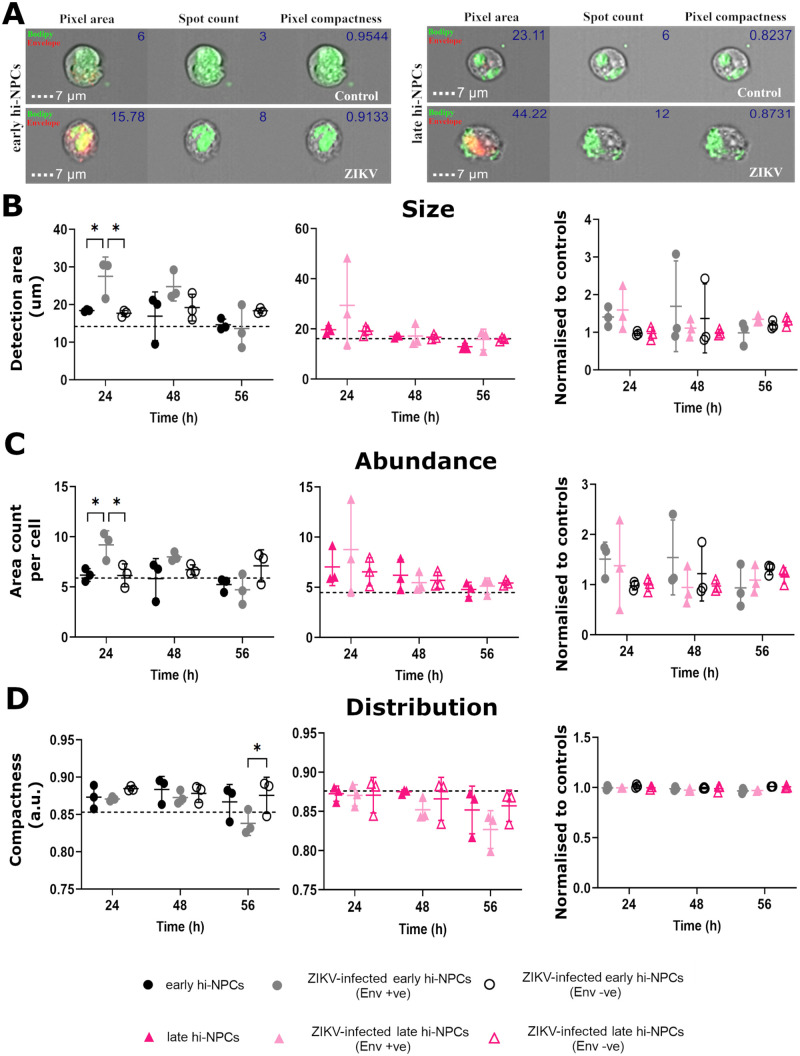
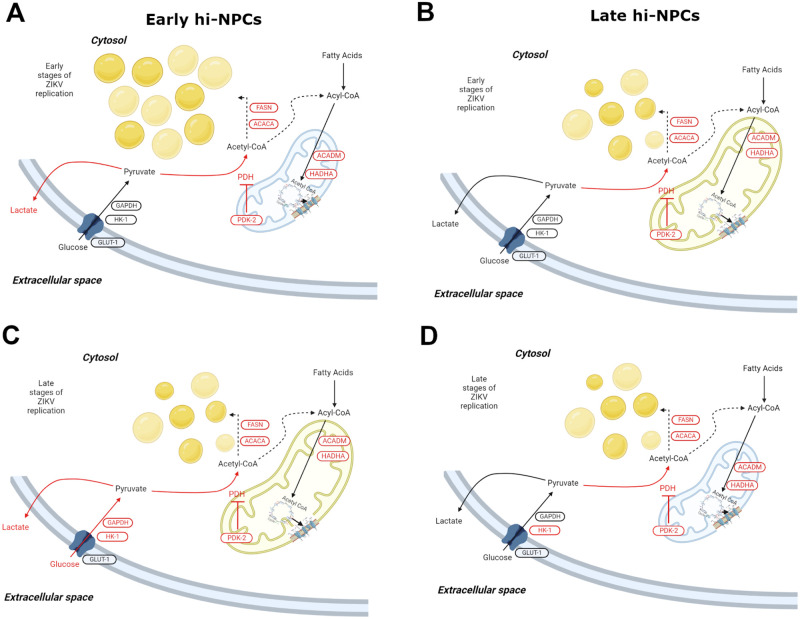
Cortical development consists of an orchestrated process in which progenitor cells exhibit distinct fate restrictions regulated by time-dependent activation of energetic pathways. Thus, the hijacking of cellular metabolism by Zika virus (ZIKV) to support its replication may contribute to damage in the developing fetal brain. Here, we showed that ZIKV replicates differently in two glycolytically distinct pools of cortical progenitors derived from human induced pluripotent stem cells (hiPSCs), which resemble the metabolic patterns of quiescence (early hi-NPCs) and immature brain cells (late hi-NPCs) in the forebrain. This differential replication alters the transcription of metabolic genes in both pools of cortical progenitors but solely upregulates the glycolytic capacity of early hi-NPCs. Analysis using Imagestream® revealed that, during early stages of ZIKV replication, in early hi-NPCs there is an increase in lipid droplet abundance and size. This stage of ZIKV replication significantly reduced the mitochondrial distribution in both early and late hi-NPCs. During later stages of ZIKV replication, late hi-NPCs show reduced mitochondrial size and abundance. The finding that there are alterations of cellular metabolism during ZIKV infection which are specific to pools of cortical progenitors at different stages of maturation may help to explain the differences in brain damage over each trimester.

Keywords: Fetal neurodevelopment; Metabolism; Neurometabolism; Neuronal progenitors; ZIKV; Zika virus.


Conflict of interest statement

Competing interests The authors declare no competing or financial interests.

Figures

Fig. 1.
Fig. 1.
hiPSC cortical differentiation produces forebrain progenitors at different stages of maturation. (A) Schematic of 2D differentiation of hiPSCs to cortical neuronal progenitors (hi-NPCs). Brightfield images showing differences in morphology between early (B) and late hi-NPCs (C). Scale bars of 125 µm and 95 µm, respectively. (D) Dot plot showing the percentage summary of brain cell types in early and late hi-NPCs. N=1 cortical differentiation done in triplicates for each of three independent patients' lines. Significance was calculated by two-way ANOVA with Šidák's multiple comparisons post-hoc test. (C) Dot plot showing the relative median fluorescence intensity of a panel of conventional early cortical neuronal progenitor markers in early and late hi-NPCs. n=1 cortical differentiation of two independent patients' lines each conducted in four replicates. Significance was calculated by a mixed-effects model with Šidák correction. (F) Representative confocal images (10x) of the detection of markers of cellular proliferation phospho-Histone3 (p-H3) and of in vitro cortical neuronal progenitors nestin in early and late hi-NPCs. Scale bar: 100 µm. Intracellular radioactive tracing showing the metabolic remodelling of the (G) glycolytic flux, (H) glucose oxidation rate and, (I) fatty acid oxidation rate between early and late hi-NPCs. n=2 cortical differentiations each measured at two different time-points, 10 and 14 h post plating, in five replicates for a patient line. Significance was calculated by non-parametric two-tailed Mann–Whitney U-test. Dot plots showing the estimated cumulative glucose consumption (J) and lactate release (K) in hi-NPCs cultured over 72 h. (L) Bar graphs displaying the glycolytic capacity of per hi-NPC subtype at 72 h post-culture. n=1 cortical differentiation measured in triplicates for three independent patients' lines. Significance was calculated by two-way ANOVA with Šidák's multiple comparisons post-hoc test. Error bars display mean±s.d. Significance is shown when *P<0.05, **P<0.01, ***P<0.001, ****P<0.0001.
Fig. 2.
Fig. 2.
ZIKV exhibits differential replication rates and cellular stress in cortical progenitors at different stages of maturation. (A) Schematic 2D representation of the protocol conducted to investigate the effects of hi-NPCs exposure to ZIKV. (B) Dot plot showing the stability of ZIKV at 37°C. n=3 experiments titrated by plaque assay in triplicates. Significance was calculated by a mixed-effects model with Dunnett's multiple comparisons test. (C) Intracellular ZIKV replication relative to housekeeping genes. qPCR conducted in four replicates. Dots displaying the values of each patient line. n=1 viral infection conducted in duplicates of three independent patients' lines. Significance was calculated by two-way ANOVA with Šidák's multiple comparisons post-hoc test. Percentage of live cells containing (D) ZIKV NS1 protein a©(E) ZIKV Envelope protein. A minimum of 10,000 cells per patient line were processed by flow cytometry. (F) Dot plot showing extracellular release of ZIKV infectious particles by hi-NPCs. ZIKV quantification was done by plaque assay in triplicates. n=2 viral infection conducted in duplicates of three independent patients' lines. Significance was calculated by mixed-effects model with Šidák correction. (G) Dot plots showing the cell viability of hi-NPCs infected with ZIKV compared to non-infected controls. n=2 viral infection conducted in triplicates for each of the three patients' line. Significance was calculated by two-way ANOVA with Šidák's multiple comparisons. Violin plots displaying the mean value for ≥150 nuclei per condition. Nuclei stained with DAPI showing (H) nuclear size and (I) nuclear morphology of hi-NPCs. Significance was calculated by mixed-effects model with Šidák's multiple comparisons test. Error bars display mean±s.d. Significance is shown when *P<0.05, **P<0.01, ***P<0.001.
Fig. 3.
Fig. 3.
ZIKV infection increments the glycolytic capacity of early but not late neuronal progenitors (hi-NPCs). The metabolism of glucose was assessed by (A) transcriptional levels of genes relevant for glycolysis in ZIKV-infected hi-NPCs relative to non-infected controls. qPCR conducted in four replicates. Dots displaying the values of each patient line. Significance was calculated by two-way ANOVA with Šidák's multiple comparisons post-hoc test. Line graphs displaying (B) the calculated glucose consumption and lactate release from ZIKV-infected and non-infected hi-NPCs, (C) the ratio of change compared to their respective non-infected controls and, (D) comparison of the glycolytic capacity of infected early and late hi-NPCs. n=2 viral infections conducted in duplicates of three independent patients' lines. Significance was calculated by mixed-effects model with Holm-Šidák correction. Error bars display mean±s.d. Significance is shown when *P<0.05, **P<0.01, ***P<0.001.
Fig. 4.
Fig. 4.
ZIKV induces neuronal progenitor subtype-specific mitochondrial stress. Analysis of several characteristics of mitochondria homeostasis in cortical progenitors at different stages of maturation in infected to ZIKV compared to non-infected controls. (A) Representative confocal images with high magnification (60x) of z-stack projections (25 µm) confirming positive staining of mitochondria (orange) and ZIKV Envelope protein (red) in hi-NPCs. DAPI staining (blue). (B) AMNIS Imaging flow cytometer digital images show representative mitochondria staining (yellow) with different quantified parameters, selected by defined mask (blue) in hi-NPCs. Dot plots showing (C) mitochondrial membrane potential by measurements of the median fluorescence intensity of MitoTracker™ Red CMXRos, (D) mitochondria size estimated by the quantification of the total occupied area within the cells, (E) abundance of areas occupied by mitochondria and, (F) distribution of mitochondria determined by the proximity of positive areas within the cells. A minimum of 500 in focus cells were analysed per patient line out of 10,000 cells recorded. n=1 viral infection conducted in duplicates of two patients' lines. Significance was calculated by mixed-effects model with Tukey's correction. Error bars display mean±s.d. Significance is shown when *P<0.05, **P<0.01, ***P<0.001.
Fig. 5.
Fig. 5.
ZIKV replication induces simultaneous differential gene expression of fatty acid beta-oxidation and lipid biosynthesis in neuronal progenitor cells independently to their maturation. (A) Bar graphs showing the simultaneous upregulation of genes involved in fatty acid beta-oxidation and biosynthesis in hi-NPCs during ZIKV replication. Bars displaying the results of four independent replicates. Dot plots showing the transcriptional levels of genes relevant in (B) fatty acid beta-oxidation and, (C) fatty acid biosynthesis in ZIKV-infected hi-NPCs relative to non-infected controls. qPCR conducted in four replicates. Dots displaying the values of each patient line. (D) AMNIS Imaging flow cytometer digital images showing representative lipid droplet staining (green), selected by defined mask (light blue), and ZIKV-Envelope staining (red). (E) Dot plots showing the abundance of lipid droplets in ZIKV Envelope positive, Envelope negative, and non-infected hi-NPC controls. Values reflect the median fluorescence intensity (MFI) of CellTracker™ green BODIPY dye. A minimum of 500 in focus cells were analysed per patient line out of 10,000 cells recorded. n=1 viral infection conducted in three independent patients' lines. Significance was calculated by two-way ANOVA with Šidák's multiple comparisons post-hoc test. Error bars display mean±s.d. Significance is shown when *P<0.05, **P<0.01, ***P<0.001.
Fig. 6.
Fig. 6.
Early stages of ZIKV replication promotes accumulation of lipid droplets exclusively in less differentiated neuronal progenitor cells. Analysis of several characteristics of the lipid droplets in hi-NPCs infected to ZIKV compared to non-infected controls. (A) AMNIS Imaging flow cytometer digital images showing representative lipid droplet staining (green), and ZIKV-Envelope staining (red) in non-infected and infected early (left) and late (right) hi-NPCs. Values calculated for the size, abundance and distribution of lipid droplets are represented within the figures. Dot plots showing (B) lipid droplet sizes estimated by the quantification of the total occupied area within the cells, (C) abundance of areas occupied by lipid droplets and, (D) distribution of lipid droplets determined by the proximity of positive areas within the cells. Graphs showing (left) the quantification by hi-NPCs and (right) the ratio of change of each hi-NPC subtype relative to their respective non-infection controls. A minimum of 500 in focus cells were analysed per patient line out of 10,000 cells recorded. n=1 viral infection conducted in three independent patients' lines. Significance was calculated by two-way ANOVA with Šidák's multiple comparisons post-hoc test. Error bars display mean±s.d. Significance is shown when *P<0.05, **P<0.01, ***P<0.001.
Fig. 7.
Fig. 7.
ZIKV-induced neuronal progenitor subtype-specific metabolic alterations. Schematic representation of the differential metabolic dysregulation caused by ZIKV replication in cortical progenitors at different stages of maturation. (A) Increased abundance and size of lipid droplets with reduced mitochondrial size and abundance (blue colour) in Env +ve early hi-NPCs during early stages of ZIKV replication. (B) Normal abundance of lipid droplets, normal mitochondria size and abundance (yellow colour) in Env +ve late hi-NPCs during early stages of ZIKV replication. (C) Normal abundance of lipid droplets, normal mitochondria size and abundance (yellow colour) in Env +ve early hi-NPCs during late stages of ZIKV replication. (D) Normal abundance of lipid droplets with reduced mitochondrial size and abundance (blue colour) in Env +ve late hi-NPCs during late stages of ZIKV replication. Black arrows representing normal fluxes of each main metabolic pathway. Black dotted arrows representing potentially dysregulated metabolic pathways. Red arrows highlighting increased pathways assessed by protein expression. Gene/protein names in red corresponding to increased levels whilst those in black corresponding to unaltered levels compared to non-infected controls.

Similar articles

Cited by

References

    1. Oyarzábal, A., Musokhranova, U., Barros, L.F. and García-Cazorla, A. (2021). Energy metabolism in childhood neurodevelopmental disorders. EBioMedicine 69, 103474. 10.1016/j.ebiom.2021.103474 - DOI - PMC - PubMed
    1. Anfasa, F., Goeijenbier, M., Widagdo, W., Siegers, J. Y., Mumtaz, N., Okba, N., van Riel, D., Rockx, B., Koopmans, M. P. G., Meijers, J. C. M.et al. (2019). Zika virus infection induces elevation of tissue factor production and apoptosis on human umbilical vein endothelial cells. Front. Microbiol. 10, 817. 10.3389/fmicb.2019.00817 - DOI - PMC - PubMed
    1. Aubry, F., Jacobs, S., Darmuzey, M., Lequime, S., Delang, L., Fontaine, A., Jupatanakul, N., Miot, E. F., Dabo, S., Manet, C.et al. (2021). Recent African strains of Zika virus display higher transmissibility and fetal pathogenicity than Asian strains. Nat. Commun. 12, 1-14. 10.1038/s41467-021-21199-z - DOI - PMC - PubMed
    1. Barbeito-Andrés, J., Pezzuto, P., Higa, L. M., Dias, A. A., Vasconcelos, J. M., Santos, T. M. P., Ferreira, J. C. C. G., Ferreira, R. O., Dutra, F. F., Rossi, A. D.et al. (2020). Congenital Zika syndrome is associated with maternal protein malnutrition. Sci. Adv. 6, eaaw6284. 10.1126/sciadv.aaw6284 - DOI - PMC - PubMed
    1. Beers, J., Gulbranson, D. R., George, N., Siniscalchi, L. I., Jones, J., Thomson, J. A. and Chen, G. (2012). Passaging and colony expansion of human pluripotent stem cells by enzyme-free dissociation in chemically defined culture conditions. Nat. Protoc. 7, 2029-2040. 10.1038/nprot.2012.130 - DOI - PMC - PubMed

Publication types