. 2023 Jul 3;222(7):e202110126.
doi: 10.1083/jcb.202110126. Epub 2023 Apr 24.

The motor domain of the kinesin Kip2 promotes microtubule polymerization at microtubule tips

Affiliations

The motor domain of the kinesin Kip2 promotes microtubule polymerization at microtubule tips

Xiuzhen Chen et al. J Cell Biol. .

Abstract

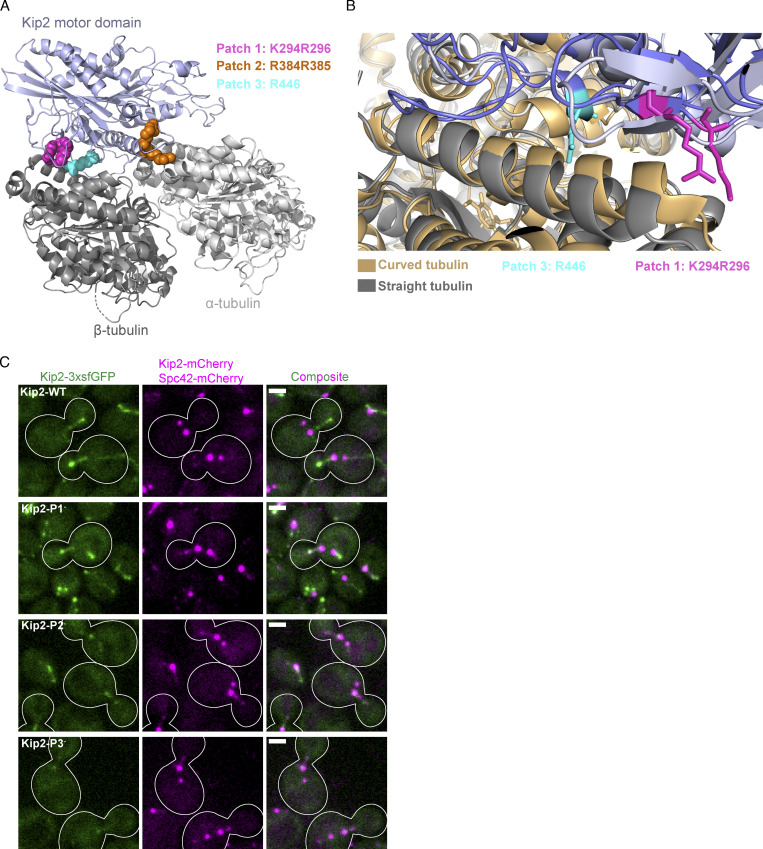
Kinesins are microtubule-dependent motor proteins, some of which moonlight as microtubule polymerases, such as the yeast protein Kip2. Here, we show that the CLIP-170 ortholog Bik1 stabilizes Kip2 at microtubule ends where the motor domain of Kip2 promotes microtubule polymerization. Live-cell imaging and mathematical estimation of Kip2 dynamics reveal that disrupting the Kip2-Bik1 interaction aborts Kip2 dwelling at microtubule ends and abrogates its microtubule polymerization activity. Structural modeling and biochemical experiments identify a patch of positively charged residues that enables the motor domain to bind free tubulin dimers alternatively to the microtubule shaft. Neutralizing this patch abolished the ability of Kip2 to promote microtubule growth both in vivo and in vitro without affecting its ability to walk along microtubules. Our studies suggest that Kip2 utilizes Bik1 as a cofactor to track microtubule tips, where its motor domain then recruits free tubulin and catalyzes microtubule assembly.


Conflict of interest statement

Disclosures: L.A. Widmer reported personal fees from Novartis Pharma AG outside the submitted work. No other disclosures were reported.

Figures

Figure 1.
Figure 1.
Kip2 motor domain and the C-terminal tail domain are essential for microtubule growth in vivo. (A) Schematic representations of protein constructs used. (B) Analysis of the Kip2-NMD amino acid sequence using the MultiCoil-prediction server with a cutoff of 0.5. (C) Representative images of preanaphase cells of indicated genotype expressing Bik1-3xGFP and Spc72-GFP. Scale bars, 2 µm. Magenta arrowheads mark the plus-ends of cytoplasmic microtubules. (D) The maximum intensity z-projection of time point one of a representative preanaphase cell. The 3D coordinates of aMT plus-end, proximal SPB, and distal SPB were tracked throughout the 80 time points. Their kymograph traces are colored in green, magenta, and blue, respectively. (E) The extracted 3D aMT length of each time point was plotted as a function of time, shown as gray dots. For this particular aMT, the maximum aMT length was 2.3 µm, and the lifetime was the full image acquisition window of 85.6 s. Two growth phases (green line over gray dots) and one shrinkage phase (magenta line over gray dots) were observed. The speeds of growth and shrinkage were calculated for each phase by dividing the corresponding ∆length by the ∆time. (F–I) Quantification results are shown. (F) All maximum lengths of microtubules below the detection limit (666.7 nm owing to the microscope resolution) were marked as 0 µm. See Materials and methods for details. The dashed (solid) bar represents the median (mean), the box marks the interquartile range, and the vertical line covers the 95% confidence interval (n = 3 independent clones with a total of >400 cells per genotype analyzed). Statistical significances were calculated using one-way ANOVA, **** P < 0.0001, n.s., not significant. (G) Maximum aMT length shown as histogram, mean of length shown in red (mean ± SD of mean). (H) The lifetime of aMTs shown as cumulative distribution, statistical significance was assessed with the Kolmogorov-Smirnov test. (I) Speeds of microtubule growth and shrinkage. Statistical significances were calculated using two-tailed Student's t test unless otherwise specified. **** P < 0.0001; * P < 0.05; n.s., not significant. Source data are available in Data S1.
Figure S1.
Figure S1.
Representative 3D aMT length tracking results, distribution of Kip2 mutants along microtubules, and SDS-PAGE of proteins used in in vitro assays. (A and B) Representative 3D aMT length was extracted from control (A) and kip2Δ (B) cells using Bik1-3xsfGFP and Spc72-eGFP as microtubule plus- and minus-end markers, respectively. The detection limit (666.7 nm due to the microscope resolution) is marked as a magenta dashed line. Rescue (green) and catastrophe (black) events are marked with triangles. The lifetime of each aMT is indicated with a black line with two arrowheads. (C) Representative images of full-length Kip2-3xsfGFP and Kip2-∆motor-3xsfGFP accumulation on microtubule tips. (D) The chimera protein is composed of Kip3-MD and Kip2-NMD, then C-terminally fused with mNeonGreen, expressed from KIP3 locus. The red arrowhead marks the plus-end of the aMT. SPBs are visualized with Spc72-GFP. Corresponds to Video 1. The time-lapse movie has 1.07 s intervals; only representative time points are shown here. Scale bar, 2 µm. (E) Coomassie-Blue-stained SDS-PAGE analysis of indicated proteins. Details of the constructs are summarized in Table S3. The Kip2-NMD image was cropped from the gel shown in Fig. 2 C. Source data are available for this figure: SourceData FS1.
Figure 2.
Figure 2.
Strong interaction between Kip2 and Bik1 requires the C-terminal tail of Kip2. (A) Schematic representations of protein constructs used in this study. Zn, Zinc knuckle domain. (B) SEC-MALS experiments of Kip2-NMD (green; calculated molecular mass of the monomer: 23 kD), tubulin (dark gray; calculated molecular mass of αβ-tubulin: 110 kD), and a mixture of Kip2-NMD and tubulin (blue). Note that the molecular mass distribution under the Kip2-NMD/tubulin mixture elution profile is in between the ones of the Kip2-NMD dimer and the tubulin heterodimer, indicating no interaction between the two proteins. (C) Coomassie-Blue-stained SDS-PAGE of microtubule pelleting assays using Taxol-stabilized microtubules mixed without and with Kip2-NMD. S, supernatant; P, pellet. The supernatant lane of the Kip2-NMD alone sample is also shown in Fig. S1 E. (D) SEC-MALS analyses of Bik1-CC (green), Kip2-NMD (dark blue), and a mixture of Bik1-CC and Kip2-NMD (purple). (E) SEC-MALS analyses of Bik1-CC (green), Kip2-NMD-ΔT (light blue), and a mixture of Bik1-CC and Kip2-NMD-ΔT complex (orange). The UV absorption at 280 nm and the molecular masses across the peak determined by MALS are plotted. Source data are available for this figure: SourceData F2.
Figure S2.
Figure S2.
The Kip2–Bik1 interaction is not required for efficient targeting of Kip2, but of Bik1, to microtubule plus-ends. (A) Representative kymographs drawn from time-lapse series of preanaphase cells of the indicated genotype. SPBs were visualized with Spc72-GFP. Red arrowheads denote the speckles that appeared along the shaft of microtubules. (B) Quantification of Kip2 speckle moving speed using the kymographs shown in A. More than 90 speckles analyzed per condition. (C) Measurements of Bik1-3xGFP fluorescence intensity (%) on cytoplasmic microtubule plus-ends in cells of the indicated genotype. More than 90 cells analyzed per condition. (D) Western blot analysis of endogenously expressed Kip2-6HA and Kip2-ΔT-6HA. Lysates were prepared from cycling cells of the indicated genotype. (E) Representative images of preanaphase cells expressing the SPB marker Spc42-mCherry (magenta) and the ATPase deficient variant Kip2-G374A-3xsfGFP (green) in the presence and absence of Bik1. (F) Measurements of Kip2-G374A-3xsfGFP fluorescence intensity (%) associated with b-SPBs in cells shown in E. More than 90 speckles cells per condition. Statistical significance was calculated using two-tailed Student's t test. **** P < 0.0001; n.s., not significant. Source data for B, C, and F are available in Data S1. Source data are available for this figure: SourceData FS2.
Figure 3.
Figure 3.
Kip2–Bik1 interaction is required to retain Kip2 on cytoplasmic microtubule plus-ends efficiently. (A) Representative images of preanaphase cells expressing Spc42-mCherry (magenta) and Kip2-3xsfGFP (green) or Kip2-ΔT-3xsfGFP (green) in the presence or absence of Bik1. (B–D) Representative images (left) and quantifications (right) of fluorescence intensities (a.u.) from endogenous Kip2-∆T-3xsfGFP (C) and Kip2-3xsfGFP in the presence (B) or absence (D) of Bik1 along preanaphase cytoplasmic microtubules (boxed areas). Signals were aligned to SPBs using the Spc42-mCherry (magenta) intensity peak and binned by microtubule length (2 pixel = 266.7 nm bin size). Colored lines show mean Kip2-3xsfGFP fluorescence per bin and shaded areas represent 95% confidence intervals for the mean. Gray dashed lines denote weighted linear regressions for the mean GFP fluorescence on plus-ends over all bins. Scale bars, 2 µm. 53 ≤ n ≤ 180 per bin. These graphs have consistent scales for direct comparison and per-bin comparisons are shown in Fig. S3. B has been published as Fig. 1 B in Chen et al. (2019b). (E) Scheme of the mathematically estimated parameters (Chen et al., 2019b). Free Kip2 (with concentration [Kip2]free<[Kip2]total) binds to the microtubule minus-end anchored at the SPB with rate rin=kin[Kip2]free if the minus-end site is free and to any free lattice site with rate ron=kon[Kip2]free. A bound motor can detach with rate koff, and it can advance with rate if the following site toward the plus-end is free. At the plus-end, the motor detaches with a different rate, kout. (F) Likelihood of total Kip2 concentration [Kip2]total estimated from fit in B–D. (G) Likelihood of on rate constant kon and in rate constant kin estimated from fit in B–D. Statistical significance for differences determined by sampling from the likelihood (see supporting information), the difference in the median as indicated. (H) Likelihood of out rate kout constant estimated from fit in B–D. For F–H, median values are indicated as circles, interquartile range (IQR) by thick gray bars, and 1.5×IQR by thin gray bars. Kernel density estimates are computed from 20,000 samples from the likelihood function. Dashed black lines indicate sampled parameter ranges.
Figure S3.
Figure S3.
Experimental and estimate results of Kip2 distribution along microtubules. (A–F) Quantifications of fluorescence intensities (a.u.) from endogenous Kip2-∆T-3xsfGFP and Kip2-3xsfGFP in the presence or absence of Bik1 along preanaphase cytoplasmic microtubules binned by microtubule length: (A) 0.80–1.06 μm, (B) 1.06–1.33 μm, (C) 1.33–1.60 μm, (D) 1.60–1.86 μm, (E) 1.86–2.13 μm, (F) 2.13–2.40 μm. (G–I) Experimental Kip2-∆T-3xsfGFP (H), Kip2-3xsfGFP in the presence (G) or absence (I) of Bik1 fluorescence (a.u.) mean profile (black) and standard error (gray) with respective mean in silico estimation fits (red) for microtubules binned by length. Red dashed lines past plus-end and SPB indicates estimation extrapolations without support by data. (J) In silico kymograph with on rate constant of 6.1E-4 (nM Kip2)−1 s−1, in rate constant of 3.1E-1 (nM Kip2)−1 s−1, off rate constant of 2.3E-2 s−1, and total Kip2 concentration of 35 nM.
Figure 4.
Figure 4.
Kip2-NMD binds to SPBs and tracks microtubule plus-ends by binding to Bik1. (A) Representative images of preanaphase cells expressing Spc42-mCherry (magenta) and Kip2-NMD-3xsfGFP (green) or Kip2-NMD-ΔT-3xsfGFP (green) in the context of control, bik1Δ, or kip3Δ. (B) Quantification of Kip2-NMD-3xsfGFP or Kip2-NMD-ΔT-3xsfGFP localization at preanaphase SPBs and aMT plus-ends in control and mutant cells. Cells from three independent clones were quantified, n as shown in the graph. (C) Kip2-NMD-mNeonGreen accumulates on both the growing and shrinking cytoplasmic microtubule plus-ends. The red arrowhead marks the plus-end. SPBs are visualized with Spc72-GFP. The time-lapse movie has 1.07 s intervals, shown as Video 2; only representative time points are shown here. (D) Representative images of preanaphase heterozygous diploid cells expressing Kip2-G374A-3xsfGFP (green) and the wild-type protein Kip2-mCherry (magenta). Line scan analysis of the two aMTs as highlighted in yellow boxes on the right. All scale bars, 2 µm.
Figure 5.
Figure 5.
The motor–tubulin interactions underlie the microtubule polymerase activity of Kip2. (A) SEC-MALS analysis of a mixture of apo Kip2-MD (calculated molecular mass of the monomer: 44 kD) and tubulin (calculated molecular mass of the dimer: 110 kD). (B) Homology model of the Kip2-MD (blue) in complex with the αβ-tubulin heterodimer (gray). The three positively charged Kip2-MD surface residue patches crucial for tubulin or microtubule-binding are highlighted in different colors (see corresponding legend). (C) SEC-MALS analysis of a mixture of MBP-Kip2-MD-mCherry (calculated molecular mass of the monomer: 125.8 kD) and tubulin. (D) SEC-MALS analysis of a mixture of MBP-Kip2-MD-P1-mCherry (same calculated molecular mass as MBP-Kip2-MD-mCherry) and tubulin. (E) Representative images of metaphase yeast cells expressing Spc42-mCherry (magenta) and wild-type Kip2 or Kip2 containing mutations in tubulin-binding patches C-terminally fused with 3xsfGFP (green). (F) Quantification of GFP fluorescence intensities at aMT plus-ends from cells shown in E, error bars represent mean ± SD (n = 3 independent clones, with a total of >100 cells per genotype analyzed). For P2 and P3 mutant cells, the GFP signal was only weakly associated with SPBs; therefore, in both cases, the intensities on aMT plus-ends were not determined (n.d.). The statistical significance (n.s.: not significant) was test with two-tailed Student’s t test. (G and H) Quantification of 3D length of aMTs. Kip2-wt represents the control of inserting the selection marker TRP1 downstream of the KIP2 gene; see the Materials and methods section for more details. Representative images of metaphase cells of indicated genotype are shown in G; red arrowheads mark the plus-ends of aMTs. Quantification results are shown in H, the dashed (solid) bar represents the median (mean), the box marks the interquartile range, and the vertical line covers a 95% confidence interval (n = 3 independent clones, with a total of >400 cells per genotype analyzed). Statistical significances were calculated using one-way ANOVA; **** P < 0.0001; n.s., not significant. Scale bars, 2 μm. Source data for F and H are available in Data S1.
Figure S4.
Figure S4.
Details of tubulin-bound Kip2-MD homology model and effects of indicated mutants in heterozygous yeast cells. (A) Kip2-MD homology model (blue) in complex with a αβ-tubulin (gray) heterodimer. The three positively charged Kip2-MD surface patches that are crucial for tubulin or microtubule binding are highlighted in different colors (see corresponding legend). (B) Predicted binding of Kip2-MD (blue) to the curved (brown) and straight (gray) conformational states of tubulin. Residues K294 and R296 (P1, purple) and R446 (P3, sky blue) are highlighted to illustrate that P1 may selectively bind to the curved conformation of tubulin. (C) Localization of the wild-type and the tubulin-binding patch mutants of Kip2 in heterozygous diploid cells. Representative images of preanaphase heterozygous diploid cells expressing wild-type and tubulin-binding patch mutants of Kip2 fused to 3xsfGFP (green), together with wild-type Kip2 fused to mCherry. SPBs are visualized with Spc42-mCherry (magenta). Scale bars, 2 μm.
Figure 6.
Figure 6.
Residues K294 and R296 of Kip2 are involved in interaction with free tubulin and are indispensable for efficient microtubule polymerization in vitro. (A) Schematic of the experimental design: porcine tubulin (green) polymerizes onto stabilized microtubule seed (blue) in the presence of Kip2-WT, composed of MBP-Kip2(1-560)-RFP (magenta). And representative images of dynamic microtubules grown from seeds without (top panel) and with increasing amounts (2, 4, 8 nM) of Kip2-WT (middle panel) and Kip2-P1 (bottom panel). (B) Kymographs drawn from time-lapse corresponding to A show microtubule growth without (top) and with increasing amounts (2, 4, 6 nM) of Kip2-WT (middle panel) and Kip2-P1 (bottom). (C–E) Microtubule average length (C), catastrophe frequency (D), and growth speed (E) as a function of Kip2-WT or Kip2-P1 concentration. These results were quantified from more than 100 growth segments per condition. Statistics significance comparing Kip2-WT and Kip2-P1 were calculated with one-way ANOVA. **** P < 0.0001.
Figure S5.
Figure S5.
Kip2 residues K294 and R296 are dispensable for Kip2 motility in vivo and in vitro. (A) Representative preanaphase cells (T1: the first frame), kymographs drawn from time-lapse series, and highlighted trajectories (red dashed lines) of Kip2-3xsfGFP (top) and Kip2-P1-3xsfGFP (bottom) speckles moving along a metaphase aMT. Spc72-GFP was used to visualize SPBs. KIP3 was deleted to increase the aMT length. Scale bars, 2 μm. (B) Quantification of Kip2 speckle moving speed using the kymographs shown in A. More than 90 speckles analyzed per condition. (C) Representative kymographs showing random landing along GMPCPP-stabilized microtubule lattices, processive motility, and plus-end accumulation of individual Kip2-WT and Kip2-P1 motors. (D) Quantification of Kip2 motor speed using the kymographs shown in C. More than 55 speckles analyzed per condition. Statistical significance was calculated using two-tailed Student's t test; * P < 0.05; ** P < 0.01. Source data for C and D are available in Data S1.
Figure 7.
Figure 7.
Model of Kip2 polymerizing microtubules in living cells. Frame 1: The two motor domains of kinesin Kip2 coordinate their ATPase cycles to move toward the microtubule plus-end. Each motor domain (blue or orange to differentiate the two) is bound to a tubulin heterodimer (gray box, β subunit; striped box, α subunit) in its straight conformation along a microtubule protofilament (the cylindrical microtubule is composed of 13 protofilaments). Bik1 is accumulated at the plus-end and is transported there by Kip2. Frame 2: Upon arriving at the plus-end, Kip2 is retained there by binding to Bik1. Frame 3: The unoccupied motor domain (in this case, orange) bound to ATP sequesters a free tubulin dimer in its curved conformation. Frame 4: The motor domain facilitates the incorporation of the newly sequestered dimer. The motor domain ahead (orange) hydrolyzes ATP quickly, allowing the other motor domain (blue) to be released from the microtubule protofilament and sequester the next free tubulin dimer. The Bik1-dependent retention enables Kip2 to perform multiple rounds of tubulin incorporation. Frame 5: While this Kip2 molecule is eventually released from the plus-end, such as by phosphorylation on the N-terminus, new Kip2 motors arrive with Bik1 along the lattice. In the absence of Bik1, Kip2 leaves the plus-end as soon as it arrives. Thus, Kip2 fails to promote microtubule growth. The vertical dashed line (black) indicates the length of the microtubule protofilament before Kip2 incorporated tubulin dimers.

References

    1. Akhmanova, A., and Steinmetz M.O.. 2008. Tracking the ends: A dynamic protein network controls the fate of microtubule tips. Nat. Rev. Mol. Cell Biol. 9:309–322. 10.1038/nrm2369 - DOI - PubMed
    1. Arellano-Santoyo, H., Geyer E.A., Stokasimov E., Chen G.Y., Su X., Hancock W., Rice L.M., and Pellman D.. 2017. A tubulin binding switch underlies kip3/kinesin-8 depolymerase activity. Dev. Cell. 42:37–51.e8. 10.1016/j.devcel.2017.06.011 - DOI - PMC - PubMed
    1. Arnal, I., Heichette C., Diamantopoulos G.S., and Chrétien D.. 2004. CLIP-170/tubulin-curved oligomers coassemble at microtubule ends and promote rescues. Curr. Biol. 14:2086–2095. 10.1016/j.cub.2004.11.055 - DOI - PubMed
    1. Berlin, V., Styles C.A., and Fink G.R.. 1990. BIK1, a protein required for microtubule function during mating and mitosis in Saccharomyces cerevisiae, colocalizes with tubulin. J. Cell Biol. 111:2573–2586. 10.1083/jcb.111.6.2573 - DOI - PMC - PubMed
    1. Bieling, P., Kandels-Lewis S., Telley I.A., van Dijk J., Janke C., and Surrey T.. 2008. CLIP-170 tracks growing microtubule ends by dynamically recognizing composite EB1/tubulin-binding sites. J. Cell Biol. 183:1223–1233. 10.1083/jcb.200809190 - DOI - PMC - PubMed

Publication types

MeSH terms