. 2023 Sep 1;29(17):3362-3371.
doi: 10.1158/1078-0432.CCR-22-3578.

A Phase I/II Trial of HER2 Vaccine-Primed Autologous T-Cell Infusions in Patients with Treatment Refractory HER2-Overexpressing Breast Cancer

Affiliations

A Phase I/II Trial of HER2 Vaccine-Primed Autologous T-Cell Infusions in Patients with Treatment Refractory HER2-Overexpressing Breast Cancer

Mary L Disis et al. Clin Cancer Res. .

Abstract

Purpose: High levels of type I T cells are needed for tumor eradication. We evaluated whether the HER2-specific vaccine-primed T cells are readily expanded ex vivo to achieve levels needed for therapeutic infusion.

Patients and methods: Phase I/II nonrandomized trial of escalating doses of ex vivo-expanded HER2-specific T cells after in vivo priming with a multiple peptide-based HER2 intracellular domain (ICD) vaccine. Vaccines were given weekly for a total of three immunizations. Two weeks after the third vaccine, patients underwent leukapheresis for T-cell expansion, then received three escalating cell doses over 7- to 10-day intervals. Booster vaccines were administered after the T-cell infusions. The primary objective was safety. The secondary objectives included extent and persistence of HER2-specific T cells, development of epitope spreading, and clinical response. Patients received a CT scan prior to enrollment and 1 month after the last T-cell infusion.

Results: Nineteen patients received T-cell infusions. Treatment was well tolerated. One month after the last T-cell infusion, 82% of patients had significantly augmented T cells to at least one of the immunizing epitopes and 81% of patients demonstrated enhanced intramolecular epitope spreading compared with baseline (P < 0.05). There were no complete responses, one partial response (6%), and eight patients with stable disease (47%), for a disease control rate of 53%. The median survival for those with progressive disease was 20.5 months and for responders (PR+SD) was 45.0 months.

Conclusions: Adoptive transfer of HER2 vaccine-primed T cells was feasible, was associated with minimal toxicity, and resulted in an increased overall survival in responding patients. See related commentary by Crosby et al., p. 3256.


Conflict of interest statement

Conflict of interests: No disclosures were reported by the other authors.

Figures

Figure 1.
Figure 1.
Expansion of HER2 vaccine-primed T-cells after weekly vaccination in treatment refractory patients is feasible. (A) Fold T-cell expansion (y-axis) in individual patients (x-axis). Bars represent the mean (± SE) of 2 or 3 expansions. The dotted line indicates the median fold T-cell expansion of all patients. (B) The estimated total HER2 specific T-cells infused (y-axis) in individual patient (x-axis). PR+SD (orange), PD (blue) or no available clinical response (CT scan) data 1 month after T-cell infusions (dark gray). The dotted line indicates the median of 19 patients. (C) Percentage of single cells co-secreting 2+ proteins (white), 3+ proteins (orange), 4+ proteins (blue), or 5+ proteins (purple) in the T-cell products. (D) The enhanced PSI of the T cell products from effector (Granzyme B, IFN-Ɣ, MIP-1α, Perforin, TNF-α and TNF-β; white), stimulatory (IL-5 and IL-8; orange), chemoattractive (MIP-1b; blue) and regulatory groups (IL-4, IL-10 and sCD137, purple) respectively.
Figure 2.
Figure 2.
The majority of patients increased HER2 specific T-cells after infusion reflective of both immunizing and intramolecular spreading epitopes. (A) Percentage of patients with measurable IFN-Ɣ response (y-axis) to each of HER2 antigens indicated in x-axis. Blue columns: generated immunity; white columns: no immunity generated. (B) Pre-vaccine (empty circle) and maximal responses (filled circle) 1/frequency (y-axis) on tested antigens (x-axis). Connected points: mean of pre-treatment and maximal response post T-cell infusions in individual patient. Lines are the median of each group. Green lines: stimulating peptides; blue lines: intramolecular epitope spreading (ES).
Figure 3.
Figure 3.
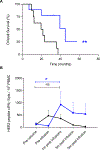
HER2 specific T-cells persisted in patients with a partial response or stable disease. (A) Kaplan-Meier curves of the overall survival (OS) in months from enrollment for responding patients (PR+SD, n=9) in blue and non-responders (PD, n=8) in black. (B) Sum of stimulating HER2 peptides (p776, 927, and p1166) specific T-cell responses (y-axis) in pre-vaccine, pre-infusion (post -vaccine), and 1, 3, and 5 months post T-cell infusion for responders (blue, n=9) vs. non-responders (black, n=8) during the treatment. Each dot represents mean (± SE) at the time point in the group.
Figure 4.
Figure 4.
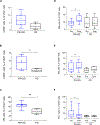
Peripheral blood T-cell memory phenotypes and markers of T-cell activation are associated with clinical response. Shown are CD69+ cells as % of CD3+CD4+ (A) and CD3+CD8+ (B) cells in clinical responders (blue; PR+SD) vs. non-responding (black; PD) patients. (C) CD45RA-CCR7+ CM cells as % of CD3+CD4+ cells. (D) CD45RA-CCR7- effector memory cells % of CD3+CD4+ T cells (E) and % of CD3+CD8+ T cells in PR+SD (blue) and PD patients (black) pre- and post-treatment. (F) PD-1+ Cells % of CD3+CD8+ cells in PR+SD (blue) and PD patients (black) pre- and post-treatment. Data are presented as interquartile box plots with whiskers. Lines are the median of the groups. * p<0.05, ** p<0.01.

Comment in

References

    1. Fridman WH, Pages F, Sautes-Fridman C, Galon J. The immune contexture in human tumours: impact on clinical outcome. Nat Rev Cancer. 2012;12(4):298–306. - PubMed
    1. Ladoire S, Arnould L, Mignot G, Apetoh L, Rebe C, Martin F, et al. T-bet expression in intratumoral lymphoid structures after neoadjuvant trastuzumab plus docetaxel for HER2-overexpressing breast carcinoma predicts survival. Br J Cancer. 2011;105(3):366–71. - PMC - PubMed
    1. Datta J, Berk E, Xu S, Fitzpatrick E, Rosemblit C, Lowenfeld L, et al. Anti-HER2 CD4(+) T-helper type 1 response is a novel immune correlate to pathologic response following neoadjuvant therapy in HER2-positive breast cancer. Breast Cancer Res. 2015;17:71. - PMC - PubMed
    1. Datta J, Fracol M, McMillan MT, Berk E, Xu S, Goodman N, et al. Association of Depressed Anti-HER2 T-Helper Type 1 Response With Recurrence in Patients With Completely Treated HER2-Positive Breast Cancer: Role for Immune Monitoring. JAMA Oncol. 2016;2(2):242–6. - PubMed
    1. Disis ML, Wallace DR, Gooley TA, Dang Y, Slota M, Lu H, et al. Concurrent trastuzumab and HER2/neu-specific vaccination in patients with metastatic breast cancer. J Clin Oncol. 2009;27(28):4685–92. - PMC - PubMed

Publication types