The Role of Apoptotic Genes and Protein-Protein Interactions in Triple-negative Breast Cancer
- PMID: 37093683
- PMCID: PMC10148064
- DOI: 10.21873/cgp.20379
The Role of Apoptotic Genes and Protein-Protein Interactions in Triple-negative Breast Cancer
Abstract
Background/aim: Compared to other breast cancer types, triple-negative breast cancer (TNBC) has historically had few treatment alternatives. Therefore, exploring and pinpointing potentially implicated genes could be used for treating and managing TNBC. By doing this, we will provide essential data to comprehend how the genes are involved in the apoptotic pathways of the cancer cells to identify potential therapeutic targets. Analysis of a single genetic alteration may not reveal the pathogenicity driving TNBC due to the high genomic complexity and heterogeneity of TNBC. Therefore, searching through a large variety of gene interactions enabled the identification of molecular therapeutic genes.
Materials and methods: This study used integrated bioinformatics methods such as UALCAN, TNM plotter, PANTHER, GO-KEEG and PPIs to assess the gene expression, protein-protein interaction (PPI), and transcription factor interaction of apoptosis-regulated genes.
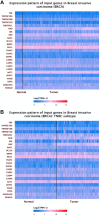
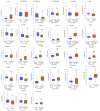
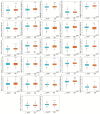
Results: Compared to normal breast tissue, gene expressions of BNIP3, TNFRSF10B, MCL1, and CASP4 were downregulated in UALCAN. At the same time, BIK, AKT1, BAD, FADD, DIABLO, and CASP9 was down-regulated in bc-GeneExMiner v4.5 mRNA expression (BCGM) databases. Based on GO term enrichment analysis, the cellular process (GO:0009987), which has about 21 apoptosis-regulated genes, is the top category in the biological processes (BP), followed by biological regulation (GO:0065007). We identified 29 differentially regulated pathways, including the p53 pathway, angiogenesis, apoptosis signaling pathway, and the Alzheimer's disease presenilin pathway. We examined the PPIs between the genes that regulate apoptosis; CASP3 and CASP9 interact with FADD, MCL1, TNF, TNFRSRF10A, and TNFRSF10; additionally, CASP3 significantly forms PPIs with CASP9, DFFA, and TP53, and CASP9 with DIABLO. In the top 10 transcription factors, the androgen receptor (AR) interacts with five apoptosis-regulated genes (p<0.0001; q<0.01), followed by retinoic acid receptor alpha (RARA) (p<0.0001; q<0.01) and ring finger protein (RNF2) (p<0.0001; q<0.01). Overall, the gene expression profile, PPIs, and the apoptosis-TF interaction findings suggest that the 27 apoptosis-regulated genes might be used as promising targets in treating and managing TNBC. Furthermore, from a total of 27 key genes, CASP2, CASP3, DAPK1, TNF, TRAF2, and TRAF3 were significantly correlated with poor overall survival in TNBC (p-value <0.05); they could play important roles in the progression of TNBC and provide attractive therapeutic targets that may offer new candidate molecules for targeted therapy.
Conclusion: Our findings demonstrate that CASP2, CASP3, DAPK1, TNF, TRAF2, and TRAF3 were substantially associated with the overall survival rate (OS) difference of TNBC patients out of a total of 27 specific genes used in this study, which may play crucial roles in the development of TNBC and offer promising therapeutic interventions.
Keywords: Breast cancer; apoptosis; bioinformatics; triple-negative breast cancer.
Copyright © 2023, International Institute of Anticancer Research (Dr. George J. Delinasios), All rights reserved.
Conflict of interest statement
The Authors declare no conflicts of interest.
Figures


Similar articles
-
Thymoquinone Alterations of the Apoptotic Gene Expressions and Cell Cycle Arrest in Genetically Distinct Triple-Negative Breast Cancer Cells.Nutrients. 2022 May 19;14(10):2120. doi: 10.3390/nu14102120. Nutrients. 2022. PMID: 35631261 Free PMC article.
-
KEGG-expressed genes and pathways in triple negative breast cancer: Protocol for a systematic review and data mining.Medicine (Baltimore). 2020 May;99(18):e19986. doi: 10.1097/MD.0000000000019986. Medicine (Baltimore). 2020. PMID: 32358373 Free PMC article.
-
Identification of a five genes prognosis signature for triple-negative breast cancer using multi-omics methods and bioinformatics analysis.Cancer Gene Ther. 2022 Nov;29(11):1578-1589. doi: 10.1038/s41417-022-00473-2. Epub 2022 Apr 26. Cancer Gene Ther. 2022. PMID: 35474355
-
Identification of Key Prognostic Genes of Triple Negative Breast Cancer by LASSO-Based Machine Learning and Bioinformatics Analysis.Genes (Basel). 2022 May 18;13(5):902. doi: 10.3390/genes13050902. Genes (Basel). 2022. PMID: 35627287 Free PMC article.
-
Identifying therapeutic strategies for triple-negative breast cancer via phosphoproteomics.Expert Rev Proteomics. 2024 Nov 26:1-17. doi: 10.1080/14789450.2024.2432477. Online ahead of print. Expert Rev Proteomics. 2024. PMID: 39588933 Review.
Cited by
-
Thymoquinone Inhibition of Chemokines in TNF-α-Induced Inflammatory and Metastatic Effects in Triple-Negative Breast Cancer Cells.Int J Mol Sci. 2023 Jun 8;24(12):9878. doi: 10.3390/ijms24129878. Int J Mol Sci. 2023. PMID: 37373025 Free PMC article.
-
Profiling the Expression Level of a Gene from the Caspase Family in Triple-Negative Breast Cancer.Int J Mol Sci. 2025 Aug 1;26(15):7463. doi: 10.3390/ijms26157463. Int J Mol Sci. 2025. PMID: 40806590 Free PMC article.
References
MeSH terms
Substances
LinkOut - more resources
Full Text Sources
Research Materials
Miscellaneous
