. 2023 Jan-Dec:15:17590914231170703.
doi: 10.1177/17590914231170703.

Transferrin Enhances Neuronal Differentiation

Affiliations

Transferrin Enhances Neuronal Differentiation

María Julia Pérez et al. ASN Neuro. 2023 Jan-Dec.

Abstract

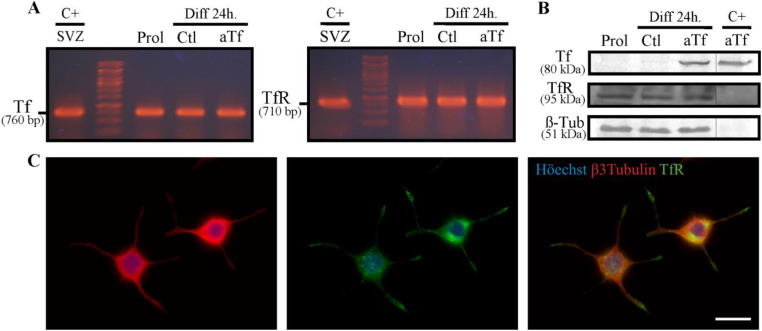
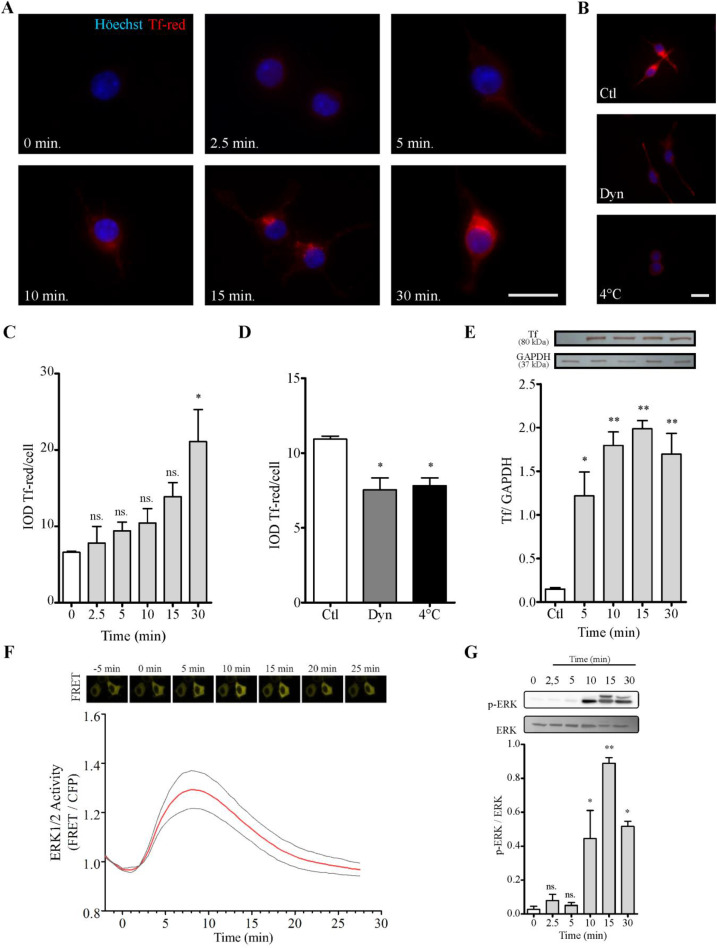
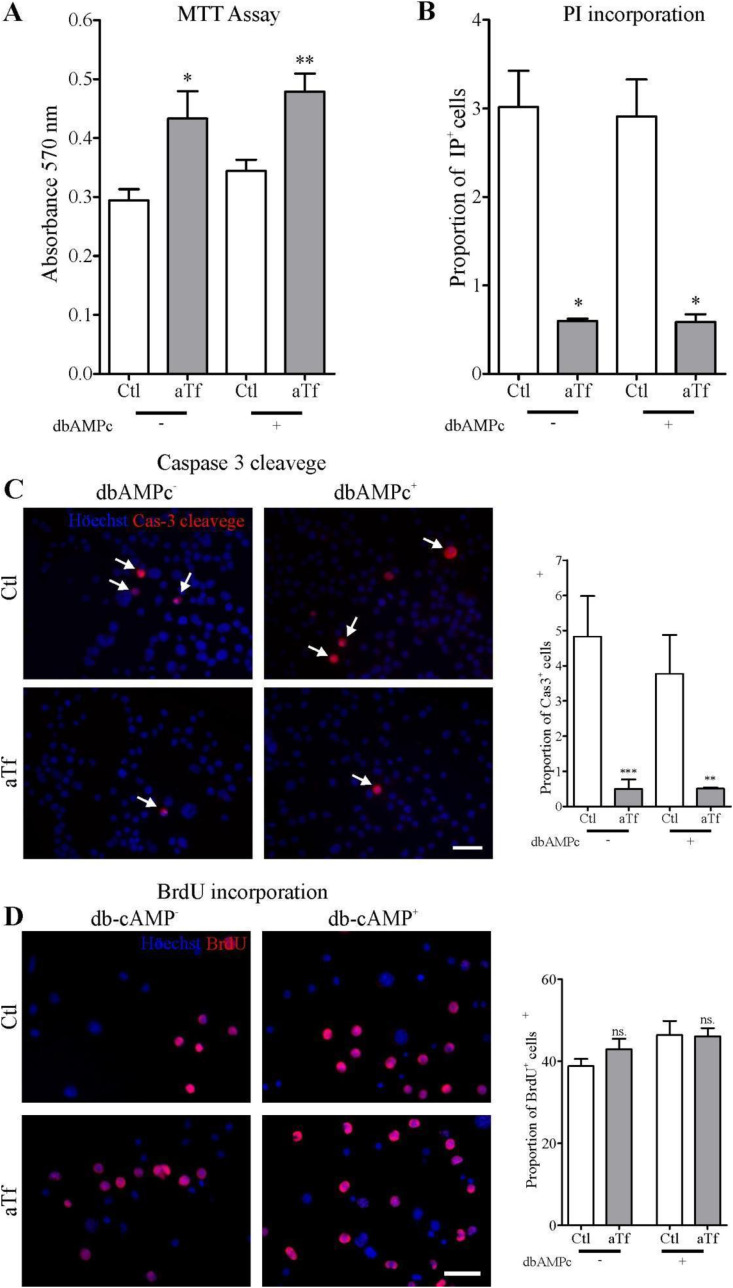
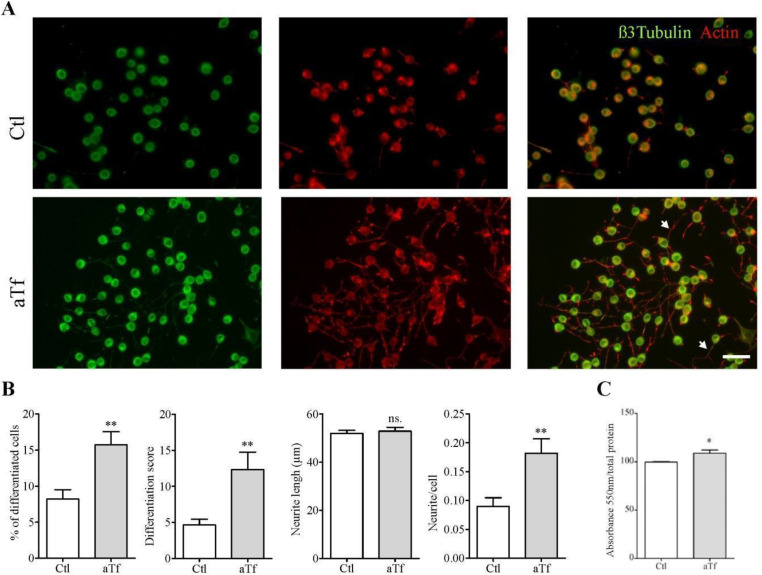
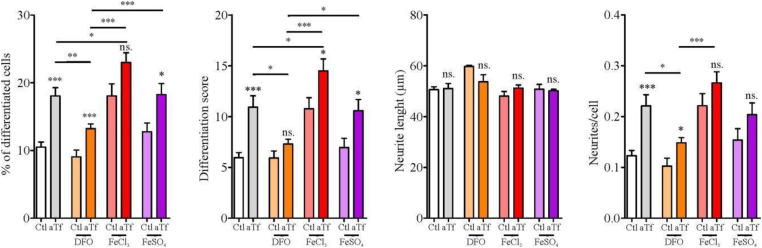
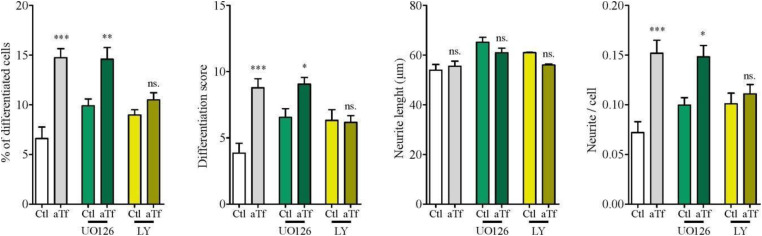
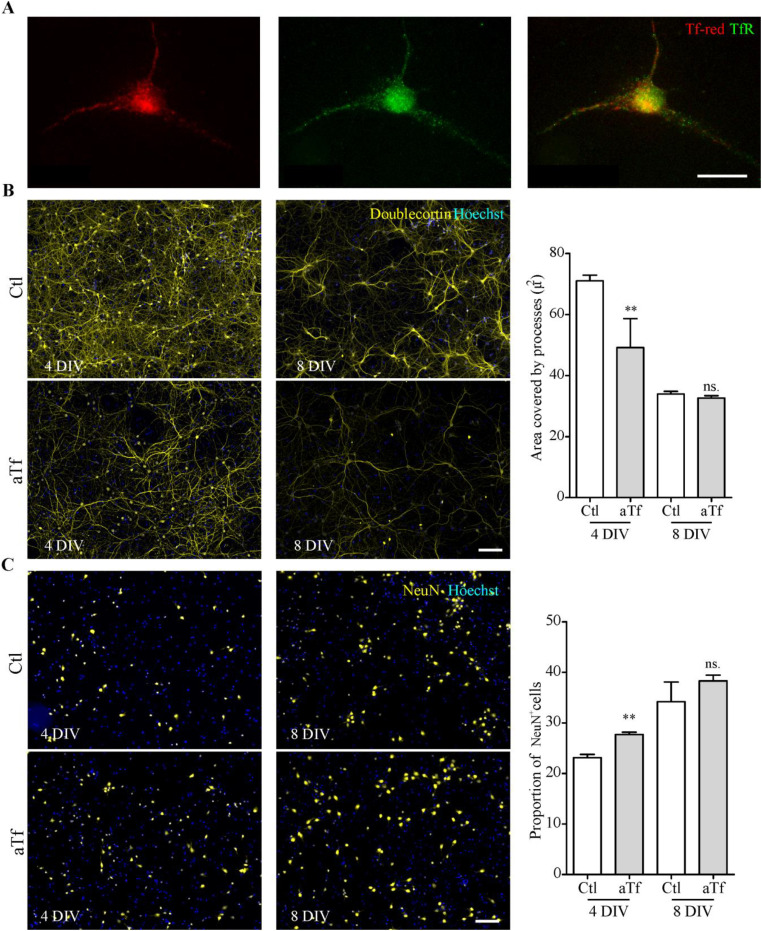
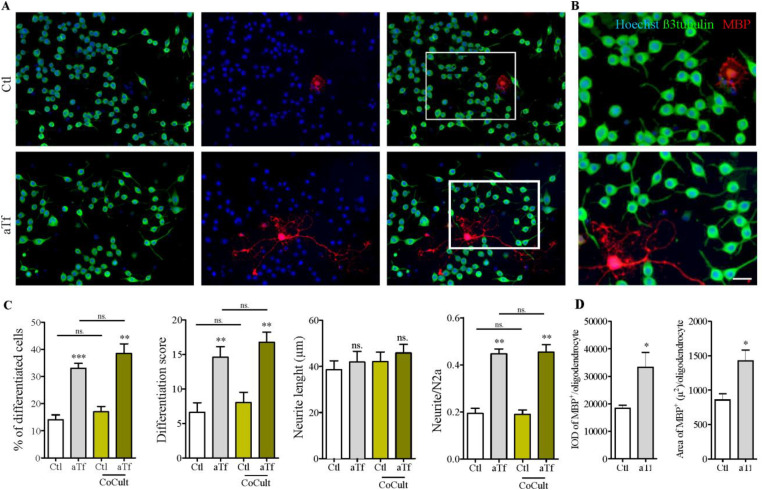
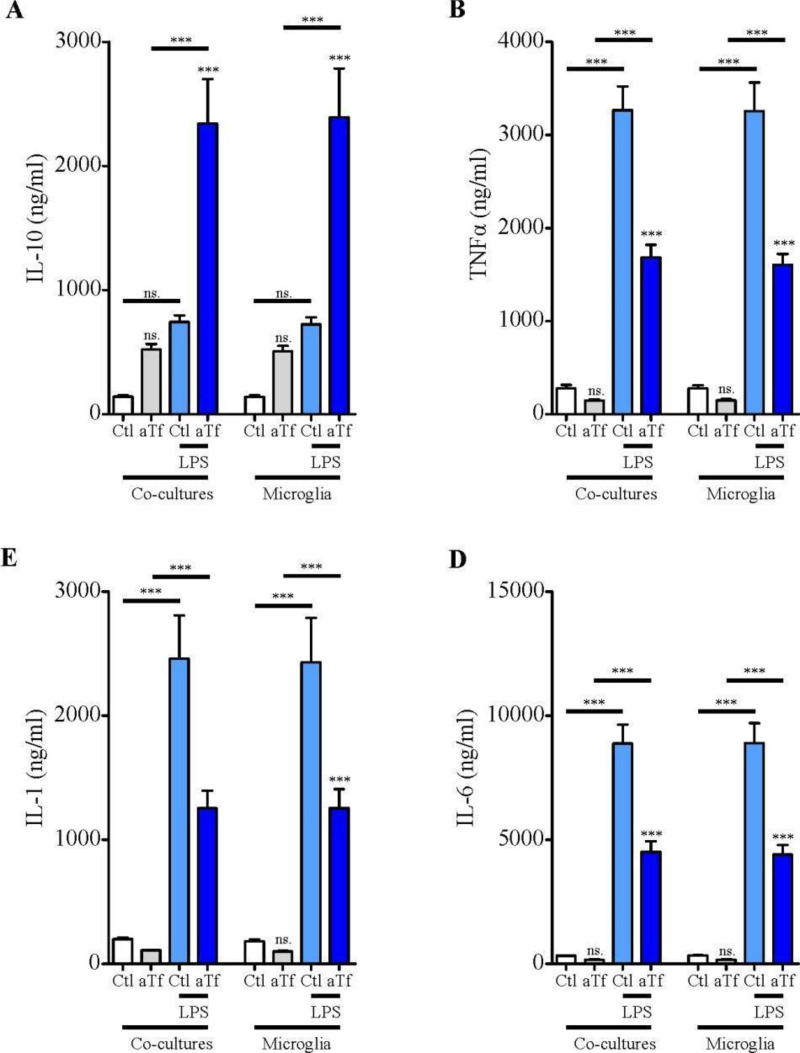
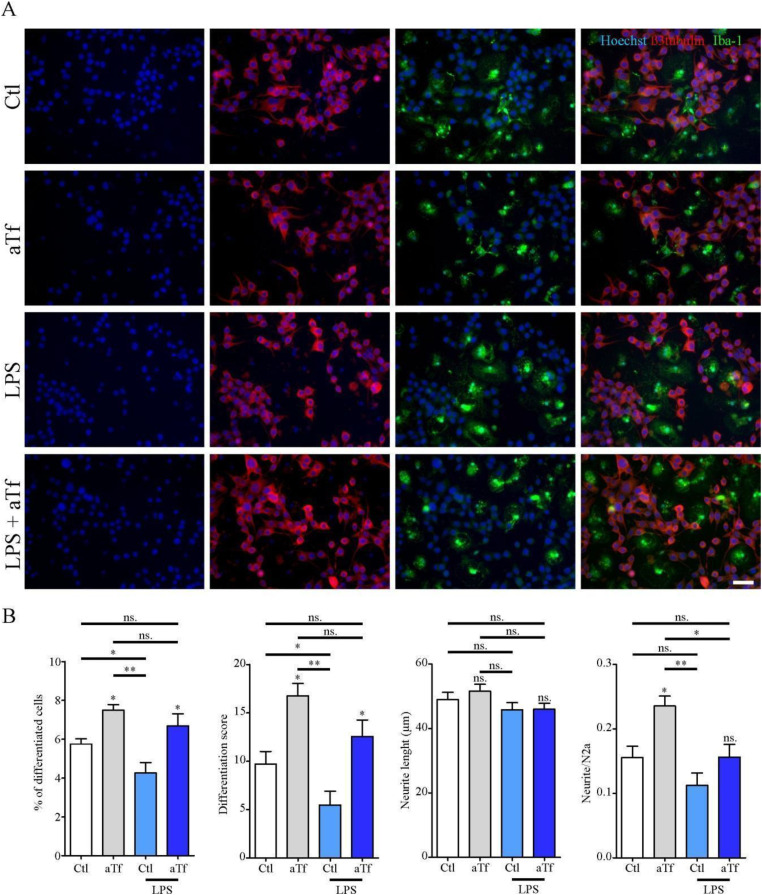
Although transferrin (Tf) is a glycoprotein best known for its role in iron delivery, iron-independent functions have also been reported. Here, we assessed apoTf (aTf) treatment effects on Neuro-2a (N2a) cells, a mouse neuroblastoma cell line which, once differentiated, shares many properties with neurons, including process outgrowth, expression of selective neuronal markers, and electrical activity. We first examined the binding of Tf to its receptor (TfR) in our model and verified that, like neurons, N2a cells can internalize Tf from the culture medium. Next, studies on neuronal developmental parameters showed that Tf increases N2a survival through a decrease in apoptosis. Additionally, Tf accelerated the morphological development of N2a cells by promoting neurite outgrowth. These pro-differentiating effects were also observed in primary cultures of mouse cortical neurons treated with aTf, as neurons matured at a higher rate than controls and showed a decrease in the expression of early neuronal markers. Further experiments in iron-enriched and iron-deficient media showed that Tf preserved its pro-differentiation properties in N2a cells, with results hinting at a modulatory role for iron. Moreover, N2a-microglia co-cultures revealed an increase in IL-10 upon aTf treatment, which may be thought to favor N2a differentiation. Taken together, these findings suggest that Tf reduces cell death and favors the neuronal differentiation process, thus making Tf a promising candidate to be used in regenerative strategies for neurodegenerative diseases.

Keywords: N2a; cytokines; differentiation; neurons; transferrin.


Conflict of interest statement

The author(s) declared no potential conflicts of interest with respect to the research, authorship, and/or publication of this article.

Figures

Figure 1.
Figure 1.
N2a cells express both Tf and TfR mRNA but only the TfR protein. (Panel A) RT-PCR experiments performed on mRNA isolated from N2a cells in proliferating and differentiating conditions, in the presence or absence of exogenous aTf addition (100 µg/ml). The subventricular zone (SVZ) of 2-day-old mice, which is known to express both proteins, was used as a positive control. (Panel B) WB analysis of whole N2a lysates cultured in the same conditions as A and incubated with primary antibodies against Tf, TfR, and β-III-tubulin. Pure aTf was used as a positive control. (Panel C) Immunocytochemical assays of differentiated N2a cells labeled with antibodies against β-III-tubulin and TfR. Scale bars represent 15 µm for all images in Panel C. Note. aTf = human apoTransferrin; Ctl = control; Diff = differentiation; Prol = proliferation; SVZ = subventricular zone; Tf = transferrin; TfR = transferrin receptor.
Figure 2.
Figure 2.
N2a cells incorporate Tf. (Panel A) Immunofluorescence images of Tf-red incorporation performed in cultures incubated with Tf-red (100 µg/ml) for time periods ranging from 0 to 30 min. (Panel B) Images of Tf-red incorporation at 4°C and 37°C in the presence or absence of Dyn, a cell-permeable inhibitor of dynamin, for 15 min. Höechst nuclear dye is shown in blue (A and B). Scale bars represent 20 µm for all images in Panels A and B. (Panel C) Quantitation of Tf-red from images shown in A. Tf-red IOD was normalized to total nuclei. (Panel D) Quantitation of Tf-red from images shown in B. Tf-red IOD was normalized to total nuclei. (Panel E) WB analysis of Tf incorporation at different time periods using an anti-Tf antibody. Quantitation is expressed as the Tf/GAPDH ratio. (Panel F) EKAREV sensor evaluation of ERK1/2 activity in N2a cells stimulated with Tf (100 µg/ml) at time 0. The time course of FRET changes was measured at single-cell level. (Panel G) WB analysis of whole N2a lysates treated with Tf (100 µg/ml) for time periods ranging from 0 to 30 min. ERK phosphorylation levels were assessed as the pERK/ERK ratio. Bars in C, D, E, and G represent the mean  ±  SEM for two independent experiments using one-way ANOVA followed by Dunnett’s multiple comparison test. **p < 0.01, *p < 0.05, ns = non-significant. Symbols above bars indicate significance compared to corresponding control. Note. Dyn = dynasore; GAPDH = glyceraldehyde 3-phosphate dehydrogenase; IOD = integrated optical density; Tf = human transferrin; Tf-red = human transferrin-Texas Red; FRET = fluorescence resonance energy transfer.
Figure 3.
Figure 3.
Tf increases cell survival, dampens cell death and apoptosis, and does not affect proliferation in N2a cells. (Panel A) MTT assays on cell viability after 2 days of Tf treatment and 3-h incubation with MTT (0.5 mg/ml). (Panel B) PI incorporation assays on cell death after 2 days of Tf treatment and 15-min incubation with PI (0.02 mg/ml). Cells were photographed alive. (Panel C) Representative immunofluorescence images showing the immunodetection of cleaved-caspase-3 (red) and quantitation analysis. Cleaved-caspase-3 (red) co-localization with Höechst (blue) is indicated with arrows. (Panel D) Representative immunofluorescence images showing the immunodetection of BrdU (red) and quantitation analysis. Höechst dye is shown in blue. Scale bars represent 40 µm for all images in Panels C and D. Bars in A–D represent the mean  ±  SEM for three independent experiments using Student’s t-tests. ***p < 0.001, **p < 0.01, *p < 0.05, ns = non-significant. Symbols above bars indicate significance compared to corresponding control. Note. aTf = human apoTransferrin; BrdU = 5-bromo-2′-deoxyuridine; Cas-3 cleavage = caspase 3 cleaved; Ctl = control; db-cAMP = N6,2′-O-dibutyryladenosine 3′,5′-cyclic monophosphate sodium salt; MTT = 3-(4,5-dimethylthiazol-2-Yl)-2,5-diphenyltetrazolium bromide.
Figure 4.
Figure 4.
Tf treatment promotes neurite outgrowth and increases intracellular iron levels. (Panel A) Immunocytochemistry images of N2a cells after 2 days of Tf treatment and stained with neuronal marker β-III-tubulin (green) and actin marker phalloidin (red). Neurites are shown with white arrowheads in merge image. Scale bar represents 40 µm for all images in Panel A. (Panel B) Quantitation of four neuronal differentiation parameters after 2 days of Tf treatment: (1) the proportion of differentiated cells measured as the ratio of neurite-bearing cells over total cell nuclei; (2) a differentiation score defined as the rate of total neurite length over total nuclei in a given field; (3) neurite length; and (4) the average number of neurites per cell. (Panel C) Colorimetric ferrozine-based assay on intracellular iron levels after 2 days of Tf treatment. Bars in B and C represent the mean  ±  SEM for three independent experiments using Student’s t-test. **p < 0.01, *p < 0.05, ns = non-significant. Symbols above bars indicate significance compared to corresponding control. Note. aTf = human apoTransferrin; Ctl = control.
Figure 5.
Figure 5.
Tf prodifferentiating effect on N2a cells is modulated by iron. Quantitation of neuronal differentiation parameters (1) the proportion of differentiated cells measured as the ratio of neurite-bearing cells over total cell nuclei; (2) a differentiation score defined as the rate of total neurite length over total nuclei in a given field; (3) neurite length; and (4) the average number of neurites per cell in the presence of normal iron levels (white and grey bars), iron deficiency (DFO, orange bars) or iron surplus (FeCl3 and FeSO4, red and purple bars, respectively). Bars represent the mean  ±  SEM for three independent experiments using one-way ANOVA followed by Dunnett's comparison test. ***p < 0.001, **p < 0.01, *p < 0.05, ns = non-significant. Symbols above bars indicate significance compared to corresponding control. Note. aTf = human apoTransferrin; Ctl = control; DFO = deferoxamine; FeCl3 = iron (III) chloride; FeSO4 = iron (II) sulfate.
Figure 6.
Figure 6.
Tf prodifferentiating effect on N2a cells is dependent on PI3K/Akt but not on MEK/ERK signaling. Quantitation of four neuronal differentiation parameters (1) the proportion of differentiated cells measured as the ratio of neurite-bearing cells over total cell nuclei; (2) a differentiation score defined as the rate of total neurite length over total nuclei in a given field; (3) neurite length; and (4) the average number of neurites per cell in the presence of MEK 1/2 inhibitor UO126 (green bars) and PI3K inhibitor LY294002 (yellow bars). Bars represent the mean  ±  SEM for three independent experiments using one-way ANOVA followed by Dunnett's comparison test. ***p < 0.001, **p < 0.01, *p < 0.05, ns = non-significant. Symbols above bars indicate significance compared to corresponding control. Note. aTf = human apoTransferrin; Ctl = control; LY = LY294002.
Figure 7.
Figure 7.
Tf treatment promotes neuronal differentiation in primary cultures of cortical neurons. (Panel A) Immunocytochemistry images of Tf-red incorporation by cortical neurons incubated with Tf-red (100 mg/ml, red) for 15 min. TfR is stained in green. (Panel B) Immunocytochemistry images of cortical neurons stained with immature neuronal marker DCX (yellow) and quantitation of DCX area after 4 and 8 days of treatment. (Panel C) Immunocytochemistry images of cortical neurons stained with mature neuronal marker NeuN (red) and quantitation of NeuN+ cells after 4 and 8 days of treatment. Scale bars represent 10 µmin A and 30 µm for all images in panels Band C. Bars in B and C represent the mean  ±  SEM for three independent experiments using Student’s t-test. **p < 0.01, ns = non-significant. Symbols above bars indicate significance compared to corresponding control. Note. aTf = human apoTransferrin; Ctl = control; DCX = doublecortin; TfR = transferrin receptor; Tf-red = Human transferrin-Texas Red.
Figure 8.
Figure 8.
Tf promotes neuronal differentiation in co-cultures of N2a and oligodendrocyte. (Panel A) Immunocytochemistry images of co-cultures of N2a cells and OPC labeled with antibodies against neuronal marker β-III-tubulin (green) and mature oligodendrocyte marker MBP (red). (Panel B) Insets in A are shown at higher magnification on the right side of each panel. Scale bar in B represents 30 µm for all images in panels A and B. (Panel C) Quantitation of neuronal differentiation parameters (1) the proportion of differentiated cells measured as the ratio of neurite-bearing cells over total cell nuclei; (2) a differentiation score defined as the rate of total neurite length over total nuclei in a given field; (3) neurite length; and (4) the average number of neurites per cell in single N2a cultures (white and grey bars) and co-cultures (yellow bars). (Panel D) Quantitation of MBP IOD and area as oligodendrocyte differentiation parameters in co-cultures of N2a cells and OPC. Bars represent the mean  ±  SEM for three independent experiments using one-way ANOVA followed by Dunnett's comparison test. ***p < 0.001, **p < 0.01, *p < 0.05, ns = non-significant. Symbols above bars indicate significance compared to corresponding control. Note. aTf = human apoTransferrin; Ctl = control; IOD = integral optical density; MBP = myelin basic protein.
Figure 9.
Figure 9.
Tf induces anti-inflammatory responses in co-cultures of N2a and microglial cells. ELISA of A, IL-10, B, TNF-α, C, IL-1β, and D, and IL-6 release to the culture medium in co-cultures in basal state (white and grey bars) and in the presence of LPS (10 ng/mL, blue bars) after 2 days of Tf treatment (100 µg/mL). Bars in A–D represent the mean  ±  SEM for three independent experiments using one-way ANOVA followed by Dunnett's comparison test. ***p < 0.001, **p < 0.01, *p < 0.05, ns = non-significant. Symbols above bars indicate significance compared to corresponding control. Note. aTf = human apoTransferrin; Ctl = control; LPS = lipopolysaccharide.
Figure 10.
Figure 10.
Tf promotes neurite outgrowth in co-cultures of N2a and microglial cells. (Panel A) Immunocytochemistry images of co-cultures of N2a and microglial cells labeled with neuronal marker β-III-tubulin (red) and microglial marker Iba-1 (green).Scale bar in A represents 40 µm. (Panel B) Quantitation of neuronal differentiation parameters (1) the proportion of differentiated cells measured as the ratio of neurite-bearing cells over total cell nuclei; (2) a differentiation score defined as the rate of total neurite length over total nuclei in a given field; (3) neurite length; and (4) the average number of neurites per cell in basal state (white and grey bars) and in the presence of LPS (10 ng/mL, yellow bars). Bars in B represent the mean  ±  SEM for three independent experiments one-way ANOVA followed by Dunnett's comparison test. **p < 0.01, *p < 0.05, ns = non-significant. Symbols above bars indicate significance compared to the corresponding control. Note. aTf = human apoTransferrin; Ctl = control; LPS = lipopolysaccharide.

Similar articles

Cited by

References

    1. Adamo A. M., Paez P. M., Escobar Cabrera O. E., Wolfson M., Franco P. G., Pasquini J. M., Soto E. F. (2006). Remyelination after cuprizone-induced demyelination in the rat is stimulated by apotransferrin. Experimental Neurology, 198(2), 519–529. 10.1016/j.expneurol.2005.12.027 - DOI - PubMed
    1. Adler A. F., Cardoso T., Nolbrant S., Mattsson B., Hoban D. B., Jarl U., Wahlestedt J. N., Grealish S., Björklund A., Parmar M. (2019). hESC-derived dopaminergic transplants integrate into basal ganglia circuitry in a preclinical model of Parkinson’s disease. Cell Reports, 28(13), 3462–3473. 10.1016/j.celrep.2019.08.058 - DOI - PMC - PubMed
    1. Arya R., White K. (2015). Cell death in development: Signaling pathways and core mechanisms. Seminars in Cell & Developmental Biology, 39, 12–19. 10.1016/j.semcdb.2015.02.001 - DOI - PMC - PubMed
    1. Badaracco M. E., Ortiz E. H., Soto E. F., Connor J., Pasquini J. M. (2008). Effect of transferrin on hypomyelination induced by iron deficiency. Journal of Neuroscience Research, 86(12), 2663–2673. 10.1002/jnr.21709 - DOI - PubMed
    1. Badaracco M. E., Siri M. V., Pasquini J. M. (2010). Oligodendrogenesis: The role of iron. Biofactors, 36(2), 98–102. 10.1002/biof.90 - DOI - PubMed

Publication types

LinkOut - more resources