

Sample Preparation Methods for Targeted Single-Cell Proteomics
- PMID: 37093777
- PMCID: PMC10243106
- DOI: 10.1021/acs.jproteome.2c00429
Sample Preparation Methods for Targeted Single-Cell Proteomics
Abstract
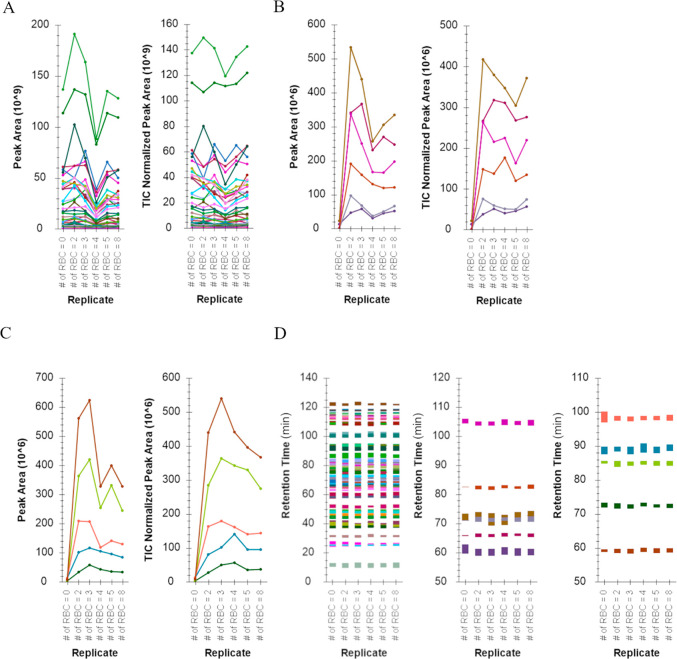
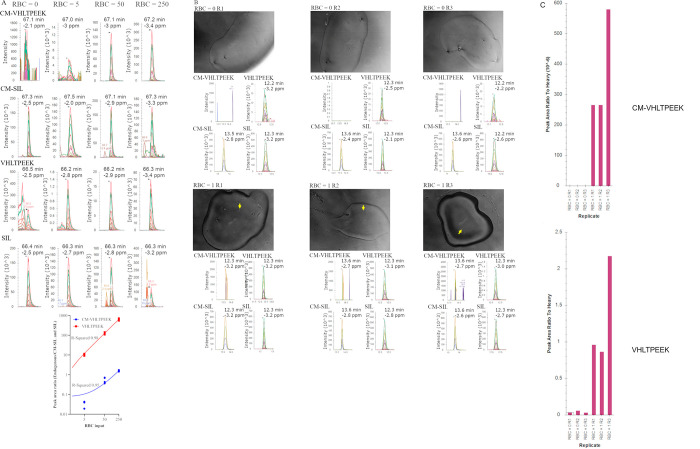
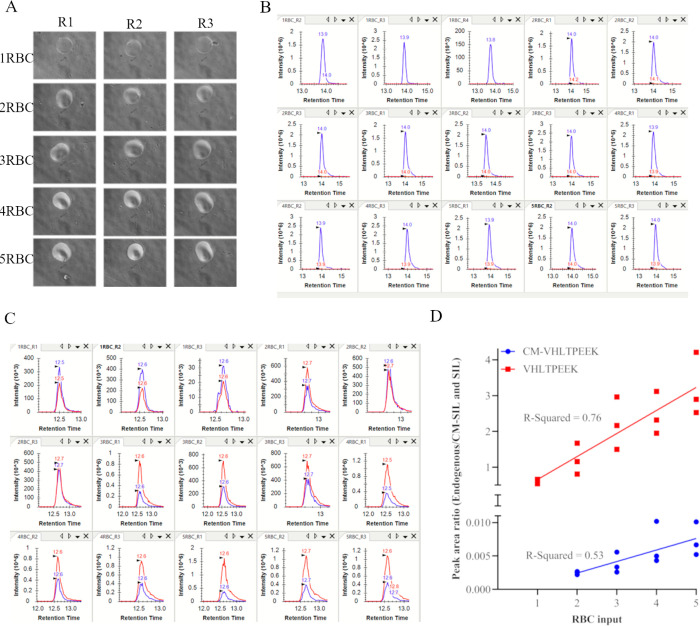
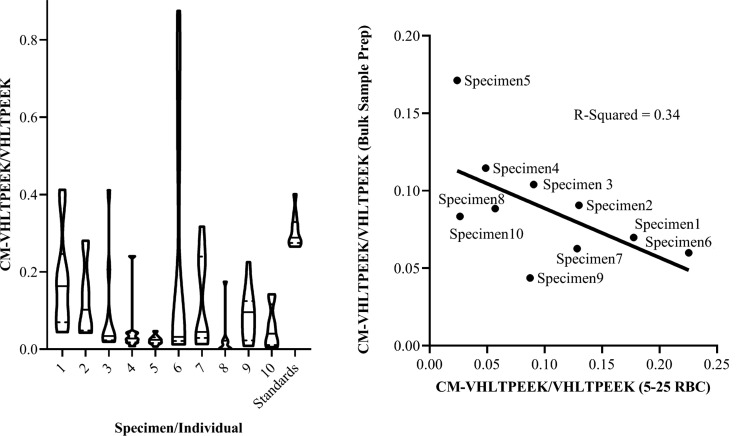
We compared three cell isolation and two proteomic sample preparation methods for single-cell and near-single-cell analysis. Whole blood was used to quantify hemoglobin (Hb) and glycated-Hb (gly-Hb) in erythrocytes using targeted mass spectrometry and stable isotope-labeled standard peptides. Each method differed in cell isolation and sample preparation as follows: 1) FACS and automated preparation in one-pot for trace samples (autoPOTS); 2) limited dilution via microscopy and a novel rapid one-pot sample preparation method that circumvented the need for the solid-phase extraction, low-volume liquid handling instrumentation and humidified incubation chamber; and 3) CellenONE-based cell isolation and the same one-pot sample preparation method used for limited dilution. Only the CellenONE device routinely isolated single-cells from which Hb was measured to be 540-660 amol per red blood cell (RBC), which was comparable to the calculated SI reference range for mean corpuscular hemoglobin (390-540 amol/RBC). FACSAria sorter and limited dilution could routinely isolate single-digit cell numbers, to reliably quantify CMV-Hb heterogeneity. Finally, we observed that repeated measures, using 5-25 RBCs obtained from N = 10 blood donors, could be used as an alternative and more efficient strategy than single RBC analysis to measure protein heterogeneity, which revealed multimodal distribution, unique for each individual.
Keywords: HbA1c; Single-cell proteomics; carboxymethyl hemoglobin; glycated hemoglobin; hemoglobin; one-pot; quantitative; red blood cell; targeted.
Conflict of interest statement
The authors declare the following competing financial interest(s): Fabiana Izaguirre is an employee of Cellenion SASU.
Figures
Similar articles
-
Quantification of the Endogenous Adduction Level on Hemoglobin and Correlation with Albumin Adduction via Proteomics: Multiple Exposure Markers of Catechol Estrogen.J Proteome Res. 2021 Sep 3;20(9):4248-4257. doi: 10.1021/acs.jproteome.1c00097. Epub 2021 Aug 18. J Proteome Res. 2021. PMID: 34406011
-
Quantification of the Mean and Distribution of Hemoglobin Content in Normal Human Blood Using Cell Tracking Velocimetry.Anal Chem. 2020 Jan 21;92(2):1956-1962. doi: 10.1021/acs.analchem.9b04302. Epub 2020 Jan 7. Anal Chem. 2020. PMID: 31874030
-
An Automated Nanowell-Array Workflow for Quantitative Multiplexed Single-Cell Proteomics Sample Preparation at High Sensitivity.Mol Cell Proteomics. 2023 Dec;22(12):100665. doi: 10.1016/j.mcpro.2023.100665. Epub 2023 Oct 14. Mol Cell Proteomics. 2023. PMID: 37839701 Free PMC article.
-
[Detection and characterization of aberrant blood proteins and quantification of glycated hemoglobin by mass spectrometry].Rinsho Byori. 1998 May;46(5):461-8. Rinsho Byori. 1998. PMID: 9627498 Review. Japanese.
-
[Recent progress in capillary electrophoresis-based high-sensitivity proteomics].Se Pu. 2020 Oct 8;38(10):1125-1132. doi: 10.3724/SP.J.1123.2020.03003. Se Pu. 2020. PMID: 34213109 Review. Chinese.
Cited by
-
Pick-up single-cell proteomic analysis for quantifying up to 3000 proteins in a Mammalian cell.Nat Commun. 2024 Feb 10;15(1):1279. doi: 10.1038/s41467-024-45659-4. Nat Commun. 2024. PMID: 38341466 Free PMC article.
-
EquiCP: Targeted Single-Cell Proteomics by Mass Spectrometry with Isobaric Labeled Multiplexing.Methods Mol Biol. 2024;2817:133-143. doi: 10.1007/978-1-0716-3934-4_11. Methods Mol Biol. 2024. PMID: 38907152
-
Trends in Mass Spectrometry-Based Single-Cell Proteomics.Anal Chem. 2025 Mar 25;97(11):5893-5907. doi: 10.1021/acs.analchem.5c00661. Epub 2025 Mar 16. Anal Chem. 2025. PMID: 40091206 Review. No abstract available.
-
A critical evaluation of ultrasensitive single-cell proteomics strategies.Anal Bioanal Chem. 2024 Apr;416(9):2359-2369. doi: 10.1007/s00216-024-05171-6. Epub 2024 Feb 15. Anal Bioanal Chem. 2024. PMID: 38358530 Review.
-
Easy and Accessible Workflow for Label-Free Single-Cell Proteomics.J Am Soc Mass Spectrom. 2023 Oct 4;34(10):2374-2380. doi: 10.1021/jasms.3c00240. Epub 2023 Aug 18. J Am Soc Mass Spectrom. 2023. PMID: 37594399 Free PMC article.
References
-
- Zhu Y.; Clair G.; Chrisler W. B.; Shen Y.; Zhao R.; Shukla A. K.; Moore R. J.; Misra R. S.; Pryhuber G. S.; Smith R. D.; Ansong C.; Kelly R. T. Proteomic Analysis of Single Mammalian Cells Enabled by Microfluidic Nanodroplet Sample Preparation and Ultrasensitive NanoLC-MS. Angew. Chem., Int. Ed. 2018, 57 (38), 12370–12374. 10.1002/anie.201802843. - DOI - PMC - PubMed
-
- Dou M.; Clair G.; Tsai C. F.; Xu K.; Chrisler W. B.; Sontag R. L.; Zhao R.; Moore R. J.; Liu T.; Pasa-Tolic L.; Smith R. D.; Shi T.; Adkins J. N.; Qian W. J.; Kelly R. T.; Ansong C.; Zhu Y. High-Throughput Single Cell Proteomics Enabled by Multiplex Isobaric Labeling in a Nanodroplet Sample Preparation Platform. Anal. Chem. 2019, 91 (20), 13119–13127. 10.1021/acs.analchem.9b03349. - DOI - PMC - PubMed
-
- Couvillion S. P.; Zhu Y.; Nagy G.; Adkins J. N.; Ansong C.; Renslow R. S.; Piehowski P. D.; Ibrahim Y. M.; Kelly R. T.; Metz T. O. New Mass Spectrometry Technologies Contributing towards Comprehensive and High Throughput Omics Analyses of Single Cells. Analyst 2019, 144 (3), 794–807. 10.1039/C8AN01574K. - DOI - PMC - PubMed
Publication types
MeSH terms
Substances
LinkOut - more resources
Full Text Sources
Molecular Biology Databases
