Synergistic effect of serum uric acid and body mass index trajectories during middle to late childhood on elevation of liver enzymes in early adolescence: Findings from the Ewha Birth and Growth Study
- PMID: 37093811
- PMCID: PMC10124883
- DOI: 10.1371/journal.pone.0282830
Synergistic effect of serum uric acid and body mass index trajectories during middle to late childhood on elevation of liver enzymes in early adolescence: Findings from the Ewha Birth and Growth Study
Abstract
Background/objectives: We aimed to determine whether serum uric acid (SUA) and body mass index (BMI) trajectories in childhood have longitudinal association with liver enzymes in adolescence.
Methods: We conducted a study using data from the Ewha Birth and Growth Cohort. Individual trajectories of SUA (n = 203) and BMI (n = 206) from 5, 7, and 9 years were defined by group-based trajectory modeling. Also, liver function enzymes were collected at 11 to 12 year of age (Aspartate Aminotransferase [AST], Alanine transaminase [ALT], and Gamma-glutamyl transferase [γ-GTP]) (n = 206). Using a generalized linear model, the effects of SUA trajectory and BMI trajectory on liver function enzymes were assessed. We also assessed the interaction effect of SUA and BMI trajectories on liver enzymes.
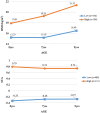
Results: For trajectory patterns, both SUA and BMI were classified into two distinct groups (High or Low). Both trajectory of SUA and BMI in childhood were positively associated with levels of liver enzymes at 11-12 years of age. The results showed that the combined effect of SUA and BMI trajectories on liver enzymes had a higher means in high-risk group (high SUA-high BMI trajectories group) than in low-risk group (low SUA-low BMI trajectories group) for ALT and γ-GTP, respectively. It remained significant association when adjusted for covariates. In addition, the interaction of BMI and SUA trajectories showed a significant synergistic effect.
Conclusion: Elevated childhood SUA and BMI trajectories are associated with increased liver enzymes in beginning of adolescent. This finding suggesting that early interventions in SUA and BMI may need for optimization of liver enzymes as potential marker for development of related disease in later life.
Copyright: © 2023 Lee et al. This is an open access article distributed under the terms of the Creative Commons Attribution License, which permits unrestricted use, distribution, and reproduction in any medium, provided the original author and source are credited.
Conflict of interest statement
The authors have declared that no competing interests exist.
Figures


Similar articles
-
Association between Body Mass Index and Serum Uric Acid: mediation analysis involving liver enzymes indicators.BMC Public Health. 2024 Oct 30;24(1):3007. doi: 10.1186/s12889-024-20457-1. BMC Public Health. 2024. PMID: 39478457 Free PMC article.
-
Uric acid and gamma-glutamyl-transferase in children and adolescents with obesity: Association to anthropometric measures and cardiometabolic risk markers depending on pubertal stage, sex, degree of weight loss and type of patient care: Evaluation of the adiposity patient follow-up registry.Pediatr Obes. 2023 Mar;18(3):e12989. doi: 10.1111/ijpo.12989. Epub 2022 Nov 6. Pediatr Obes. 2023. PMID: 36336465
-
Changing trajectories of serum uric acid and risk of non-alcoholic fatty liver disease: a prospective cohort study.J Transl Med. 2020 Mar 19;18(1):133. doi: 10.1186/s12967-020-02296-x. J Transl Med. 2020. PMID: 32192511 Free PMC article.
-
Assessment of the relationship between serum uric acid levels and liver enzymes activity in Bangladeshi adults.Sci Rep. 2021 Oct 11;11(1):20114. doi: 10.1038/s41598-021-99623-z. Sci Rep. 2021. PMID: 34635716 Free PMC article.
-
Weight trajectories through infancy and childhood and risk of non-alcoholic fatty liver disease in adolescence: the ALSPAC study.J Hepatol. 2014 Sep;61(3):626-32. doi: 10.1016/j.jhep.2014.04.018. Epub 2014 Apr 24. J Hepatol. 2014. PMID: 24768828 Free PMC article.
Cited by
-
Association between Body Mass Index and Serum Uric Acid: mediation analysis involving liver enzymes indicators.BMC Public Health. 2024 Oct 30;24(1):3007. doi: 10.1186/s12889-024-20457-1. BMC Public Health. 2024. PMID: 39478457 Free PMC article.
References
-
- Alberti KG, Eckel RH, Grundy SM, Zimmet PZ, Cleeman JI, Donato KA, et al.. Harmonizing the metabolic syndrome: a joint interim statement of the international diabetes federation task force on epidemiology and prevention; national heart, lung, and blood institute; American heart association; world heart federation; international atherosclerosis society; and international association for the study of obesity. Circulation. 2009;120:1640–1645. doi: 10.1161/CIRCULATIONAHA.109.192644 - DOI - PubMed
-
- Huh JH, Kang DR, Kim JY, Koh KK. Metabolic syndrome fact sheet 2021: executive report. Cardiometab Syndr J. 2021; 1(2):125–134.

