. 2023 Apr 24;18(4):e0284816.
doi: 10.1371/journal.pone.0284816. eCollection 2023.

Characterization of the pattern of expression of Gas1 in the kidney during postnatal development in the rat

Affiliations

Characterization of the pattern of expression of Gas1 in the kidney during postnatal development in the rat

Andrea Cetina-Palma et al. PLoS One. .

Abstract

Growth Arrest-Specific 1 (Gas1) is a pleiotropic protein with different functions, in the adult kidney Gas1 acts as an endogenous inhibitor of cell proliferation but it is also necessary for the maintenance and proliferation of Renal Progenitor Cells (RPC) during early development, thus it fulfills important functions in the adult kidney. However, it is not known whether or not Gas1 is expressed during postnatal development, a critical stage for renal maturation. For this reason, the main objective of this work was to characterize the expression pattern of Gas1 in the different regions of the kidney by immunofluorescence and Western blot analysis during the postnatal development of the rat. We found that Gas1 is present and has a differential expression pattern in the various regions of the nephron during postnatal development. We observed that the highest levels of expression of Gas1 occur in the adult, however, Gas1 is also expressed in RPC and interestingly, the expression of RPC markers such as the Neural cell adhesion molecule (NCAM) and Cluster of differentiation 24 (CD24) were found to have an inverse pattern of expression to Gas1 (decreases as the kidney matures) during postnatal renal maturation, this indicates a role for Gas1 in the regulation of renal cell proliferation at this stage of development.


Conflict of interest statement

The authors have declared that no competing interests exist.

Figures

Fig 1
Fig 1. Physiological parameters of rats during postnatal development and in adulthood.
A) analysis of the relation between urinary creatinine concentration and serum creatinine, finding a significant and progressive increase as the kidney matures. B) proteinuria analysis, we found the highest values in the first postnatal days (PND), decreasing significantly during renal maturation. Values are means ± standard deviation (SD). One-way ANOVA. *p<0.05, **** p<0.0001. A representative experiment is shown (n = 3).
Fig 2
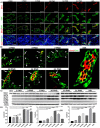
Fig 2. Gas1 is expressed in the glomerulus during postnatal renal development and in adulthood in the rat.
A) Immunofluorescence of the general expression pattern of Gas1 and Nephrin on the different postnatal days (PND) evaluated. Gas1 is expressed in the glomerulus and Bowman’s capsule, and its expression increases as the kidney matures. B) magnification of the boxes in A, Gas1 is expressed intraglomerularly and in Bowman’s capsule (BC) (white arrows). C) Semi-quantitative analysis of Gas1 and Nephrin in the glomerulus, a significant increase in the expression of both proteins is observed during renal maturation (PND 21 and ADL). D and E) analysis of the expression of Gas1 and Dendrin by Western blot in an enriched sample of glomeruli. We used a cerebellum sample (CBM) as a positive control for Gas1 expression. Both bands of Gas1 were considered for the densitometric analysis. Each PND analyzed is expressed as the relative density of a group of 20 (younger ages) and 8 (21 PND and adult) rats normalized with actin as loading control. Gas1 (red), Nephrin (green) and nuclei with DAPI (blue). The white squares represent the magnification of specific areas in the glomerulus. Scale bars = 50 μm. Values are means ± standard deviation (SD). One-way ANOVA. *p<0.05, **** p<0.0001. Immunofluorescence experiments were performed in kidney sections. A representative experiment is shown (n = 3).
Fig 3
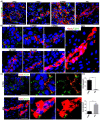
Fig 3. Gas1 and NCAM in the glomerulus and Bowman’s capsule during postnatal renal development and in adulthood of the rat.
A) Immunofluorescence of the general expression pattern of Gas1 and NCAM in the glomerulus during the different postnatal days (PND) evaluated. NCAM is expressed in the glomerulus and Bowman’s capsule (BC) and co-localizes with Gas1. B) magnification of the boxes in A, NCAM is expressed intraglomerularly to PND 1 and colocalized with Gas1 (arrowhead), as the kidney matures, colocalization decreases, but they remain very close to each other in the BC (white arrows). Two types of analysis were made to confirm the colocalization of Gas1 and NCAM to PND 1 (C), the first was qualitative with a Z-stacks of the colocalization zone (D); and the second quantitative, by calculating the Pearson colocalization coefficient (PND 1 r = 0.7681, ADL r = 0.0856, F), that generates a colocalization map (E, the areas where the two proteins colocalize in PND 1 are seen in white) and the calculation of the Manders coefficient (PND 1 M1 = 0.9990 and M2 = 0.9953, ADL M1 = 0.9963 and M2 = 0.9523). G and H) analysis of NCAM expression by Western blot in an enriched sample of glomeruli, we find that the highest expression is in PND 1, 7 and 21, and the lowest expression is in PND 14 and ADL. Each PND analyzed is expressed as the relative density of a group of 20 (younger ages) and 8 (21 PND and adult) rats normalized with actin as loading control. Gas1 (red), NCAM (green), Merge (yellow) and nuclei with DAPI (blue) are shown. The glomerulus is delimited by a white circular line. The white squares represent the magnification of specific areas in the glomerulus. Scale bars = 50 μm. Values are means ± standard deviation (SD). One-way ANOVA. *p<0.05, **** p<0.0001. Immunofluorescence experiments were performed in kidney sections. A representative experiment is shown (n = 3).
Fig 4
Fig 4. Gas1 is expressed in the proximal convoluted tubule in the kidney during postnatal development and in adulthood of the rat.
A) immunofluorescence analysis of the general expression pattern of Gas1 in proximal tubules isolated from the renal cortex at different postnatal ages (PND) studied. We found that Gas1 is expressed cytoplasmically and increases as the kidney matures. B) Claudin protein 2 (Cln2) as a specific marker of the proximal region of the nephron. C) Merge of the Gas1 and Cln2 proteins, it can be observed that Gas1 co-localizes with Cln2 mainly at PNDs 14 and 21. D) bright-field, the classic proximal tubular contoured morphology is observed. In PND 14 and 21 there is more than one proximal tubule. In PND 10 there is a proximal tubule (Cln2+) and another tubule that is not proximal (Cln2-). Gas1 (red) and Cln2 (green) are shown. Scale bars = 50 μm. Immunofluorescence experiments were performed in isolated renal tubules. A representative experiment is shown (n = 3).
Fig 5
Fig 5. Comparison of Gas1 expression and claudin 2 (Cln2) in the proximal convoluted tubule in the newborn and adult rat.
A and B) immunofluorescence of proximal convoluted tubules isolated from the renal cortex of rats from PND 1 and ADL. We found a pattern of increasing expression of Gas1 and Cln2 as the kidney matures. C) bright-field of an isolated proximal tubule attached to its respective glomerulus from PND 1. D) bright-field of an isolated proximal tubule from an adult rat, found to be thicker compared to that of 1 PND. The immunofluorescence methodology used for the tubules and the glomerulus are different, for this reason the signal observed from Gas1 in the glomerulus (A, delimited by a white circular line) does not correspond to the expression described previously (Fig 2), the image is shown as a positive control of the proximal tubule, since anatomically only the proximal tubule is attached to the glomerulus. E) Western blot analysis of Gas1 in an enriched sample of proximal tubules, we used as a negative control the protein (distal nephron protein) aquaporin 2 (AQP2). As a positive control for Gas1 we used a sample of the cerebellum (CBM). We did not find a significant signal from AQP2, confirming that the analyzed samples were mainly from the proximal region. F) densitometric analysis of the Western blot of Gas1 and SGLT1. Each PND analyzed is expressed as the relative density of a group of 20 (younger ages) and 8 (21 PND and adult) rats normalized with α-tubulin as loading control. G) semi-quantitative analysis of Gas1 and Cln2 in the proximal tubule. Gas1 (red) and Cln2 (green) are shown. Scale bars = 50 μm. Values are means ± standard deviation (SD). One-way ANOVA. *p<0.05, **** p<0.0001. Immunofluorescence experiments were performed in isolated renal tubules. A representative experiment is shown (n = 3).
Fig 6
Fig 6. Expression of renal progenitor cell (RPC) markers in the proximal convoluted tubule during postnatal development and in adulthood of the rat.
Immunofluorescence analysis of the general expression pattern of two RPC markers, CD24 (A) and NCAM (F) during postnatal renal maturation. B and G) magnification of the boxes in A and F, respectively, there is a higher expression of RPC markers in the proximal convoluted tubules of newborn rats and they decrease significantly in the adult, this is reflected in their semi-quantitative analysis (C). Small areas are observed where RPCs markers colocalize with DppD (arrowhead). We found a significant increase in the expression of DppD when comparing PND 1 with the adult (D, DppD in green), consistent with the semi-quantitative analysis (E). DppD (red A, B, F, G), CD24 (green, A and B) NCAM (green, F and G), Merge (yellow) and nuclei with DAPI (blue) are shown. The white squares represent the magnification of specific areas in the proximal convoluted tubule. Scale bars = 50 μm. Values are means ± standard deviation (SD). One-way ANOVA. *p<0.05, **** p<0.0001. ns = not significant. Immunofluorescence experiments were performed in kidney sections. A representative experiment is shown (n = 3).
Fig 7
Fig 7. Gas1 expression in the distal nephron during postnatal development and in adulthood of the rat.
A) immunofluorescence analysis of the general expression pattern of Gas1 in the distal nephron on the different postnatal days (PND) studied, we found that Gas1 is expressed in the cell membrane and its expression is homogeneous and constant in the adult distal tubule. B) magnification of the boxes in A, Gas1 is present in some distal tubules (white arrow) but not in others (arrowhead) and the expression of Gas1 is homogeneous and constant only in the adult stage. C) Western blot analysis of Gas1 in an enriched sample of distal tubules. To ensure that the results obtained were specifically from the distal region, we used the DppD protein (typical of the proximal tubules) as a negative control. As a positive control for the Gas1 protein, we used a sample of the cerebellum (CBM). We did not find a significant DppD signal, confirming that the analyzed samples were mainly from the distal region. We found that Gas1, Cln4 and Cln8 are expressed from the first day the rat was born and increase their expression as the kidney matures. D) densitometric analysis of the Western blot of Gas1, Cln4 and Cln8. Each PND analyzed is expressed as the relative density of a group of 20 (younger ages) and 8 (21 PND and adult) rats normalized with actin as loading control. Gas1 (red) and Cln4 (green) and nuclei with DAPI (blue) are shown. The white squares represent the magnification of specific areas in the distal tubule. Scale bars = 50 μm. Values are means ± standard deviation (SD). One-way ANOVA. *p<0.05, **** p<0.0001. ns = not significant. Immunofluorescence experiments were performed in kidney sections. A representative experiment is shown (n = 3).
Fig 8
Fig 8. Expression of renal progenitor cell (RPC) markers in the distal nephron during postnatal development and in adulthood of the rat.
A) immunofluorescence analysis of the general expression pattern of NCAM in the distal tubules, we found that Cln4 (red) and NCAM (green) are expressed from PND 1, that both proteins colocalize and that NCAM is not expressed in all distal tubules during kidney maturation (dotted circles). B) CD24 (green), is expressed from PND 1 and colocalizes with Gas1 (red) in different areas of the distal tubules during postnatal development, and that the expression of CD24 decreases in the adult nephron. C) Comparison of Gas1/CD24 expression in PND 1 and ADL. D) Semi-quantitative analysis of the comparison of Gas1/CD24 expression in PND 1 and ADL. The white squares represent the magnification of specific areas in the distal tubule. Cln4 (red, A), NCAM (green, A), Gas1 (red, B and C), CD24 (green, B and C), Merge (yellow), and nuclei with DAPI (blue) are shown. Scale bars = 25 μm. Values are means ± standard deviation (SD). *p<0.05, **** p<0.0001. Immunofluorescence experiments were performed in kidney sections. A representative experiment is shown (n = 3).

Similar articles

References

    1. Little MH, McMahon AP. Mammalian kidney development: principles, progress, and projections. Cold Spring Harb Perspect Biol. 2012;4(5):a008300. Published 2012 May 1. doi: 10.1101/cshperspect.a008300 - DOI - PMC - PubMed
    1. Stebel M, Vatta P, Ruaro ME, Del Sal G, Parton RG, Schneider C. The growth suppressing gas1 product is a GPI-linked protein. FEBS Lett. 2000;481(2):152–158. doi: 10.1016/s0014-5793(00)02004-4 - DOI - PubMed
    1. Schueler-Furman O, Glick E, Segovia J, Linial M. Is GAS1 a co-receptor for the GDNF family of ligands?. Trends Pharmacol Sci. 2006;27(2):72–77. doi: 10.1016/j.tips.2005.12.004 - DOI - PubMed
    1. Dominguez-Monzon G, Gonzalez-Ramirez R, Segovia J. Molecular Mechanisms of Action of Gas1 and its Possible Therapeutic Applications. Curr Signal Transduct Ther. 2011;6(1), 106–112. doi: 10.2174/157436211794109433 - DOI
    1. Martinelli DC, Fan CM. The role of Gas1 in embryonic development and its implications for human disease. Cell Cycle. 2007;6(21):2650–2655. doi: 10.4161/cc.6.21.4877 - DOI - PubMed

Publication types