. 2023 Jun 1;210(11):1700-1716.
doi: 10.4049/jimmunol.2200874.

Human CCR6+ Th Cells Show Both an Extended Stable Gradient of Th17 Activity and Imprinted Plasticity

Affiliations

Human CCR6+ Th Cells Show Both an Extended Stable Gradient of Th17 Activity and Imprinted Plasticity

Satya P Singh et al. J Immunol. .

Abstract

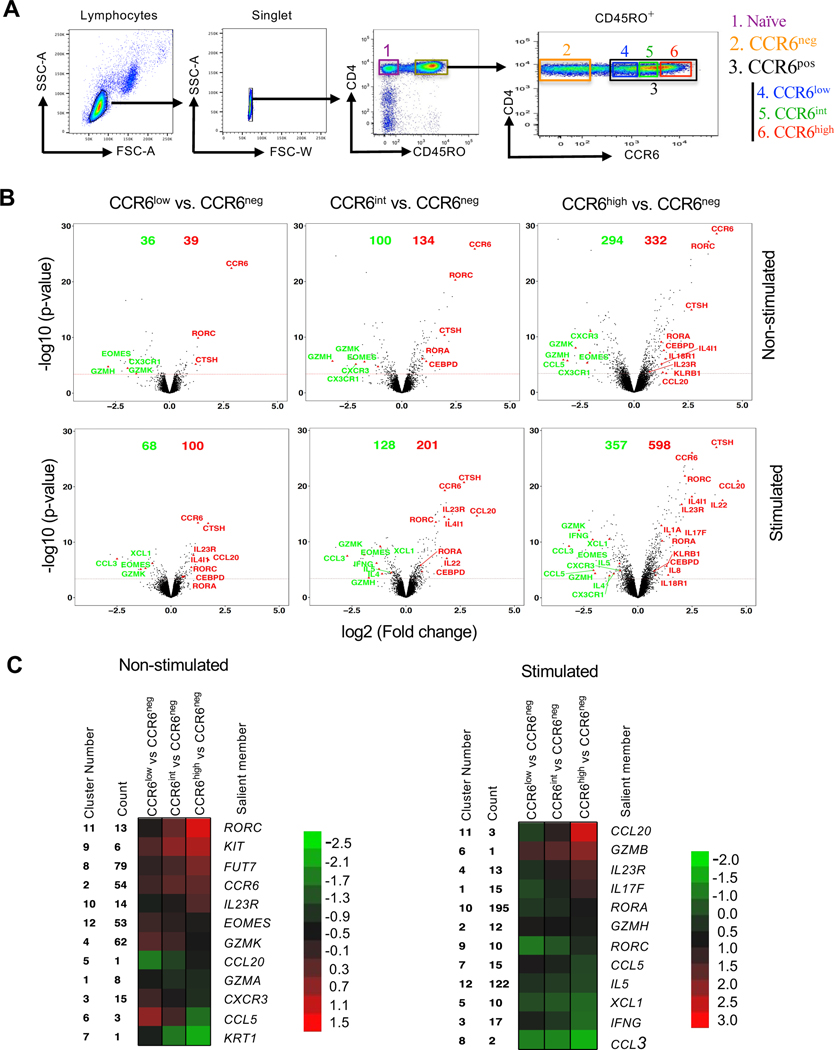
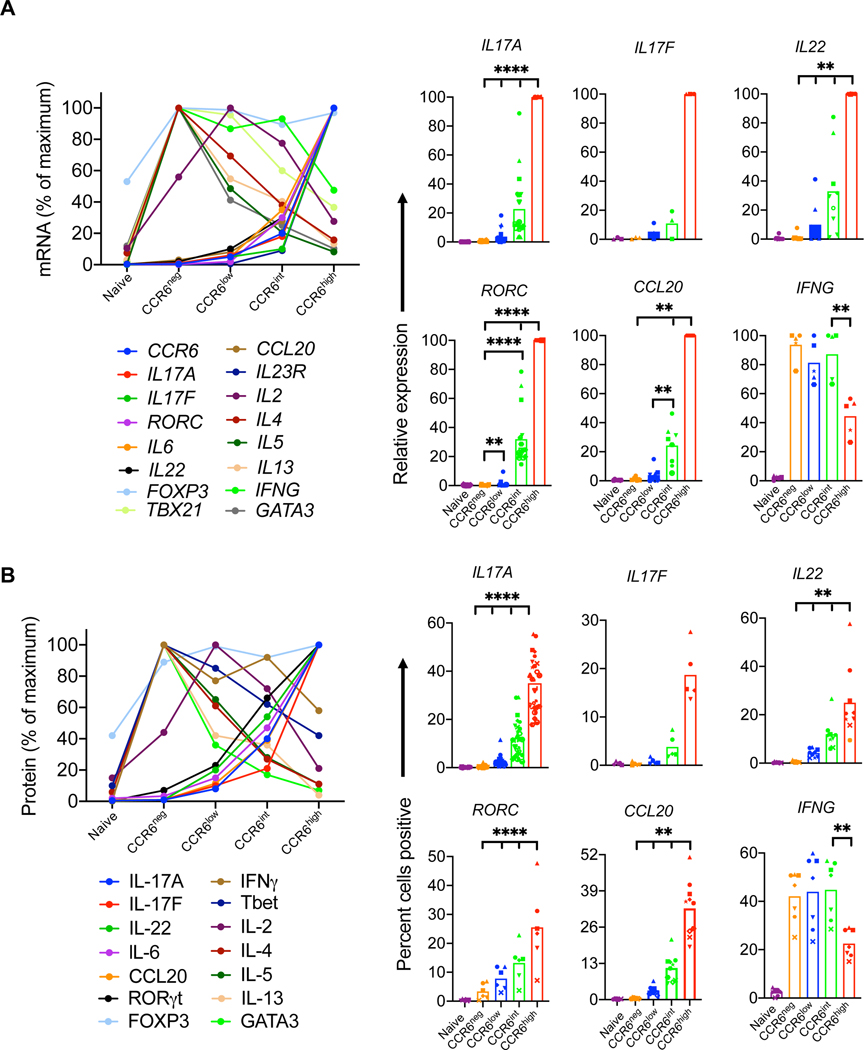
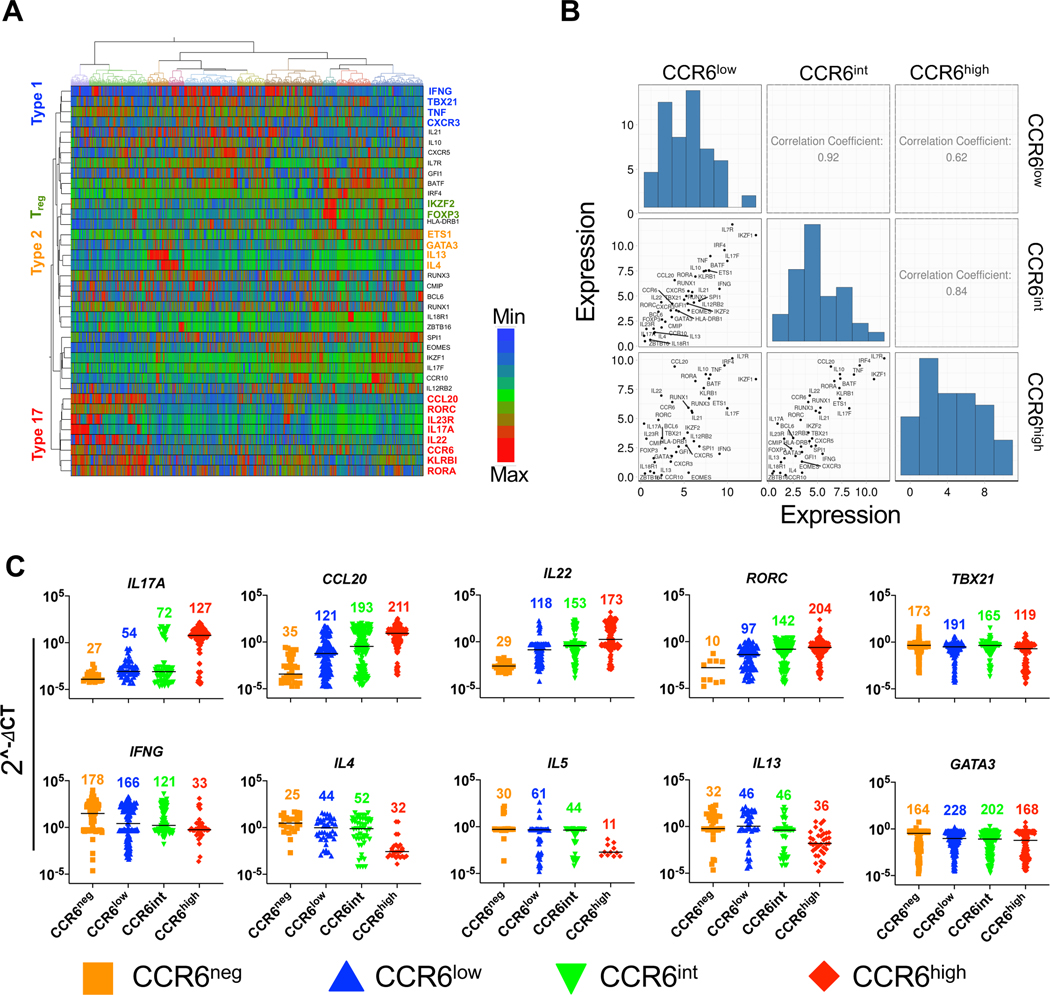
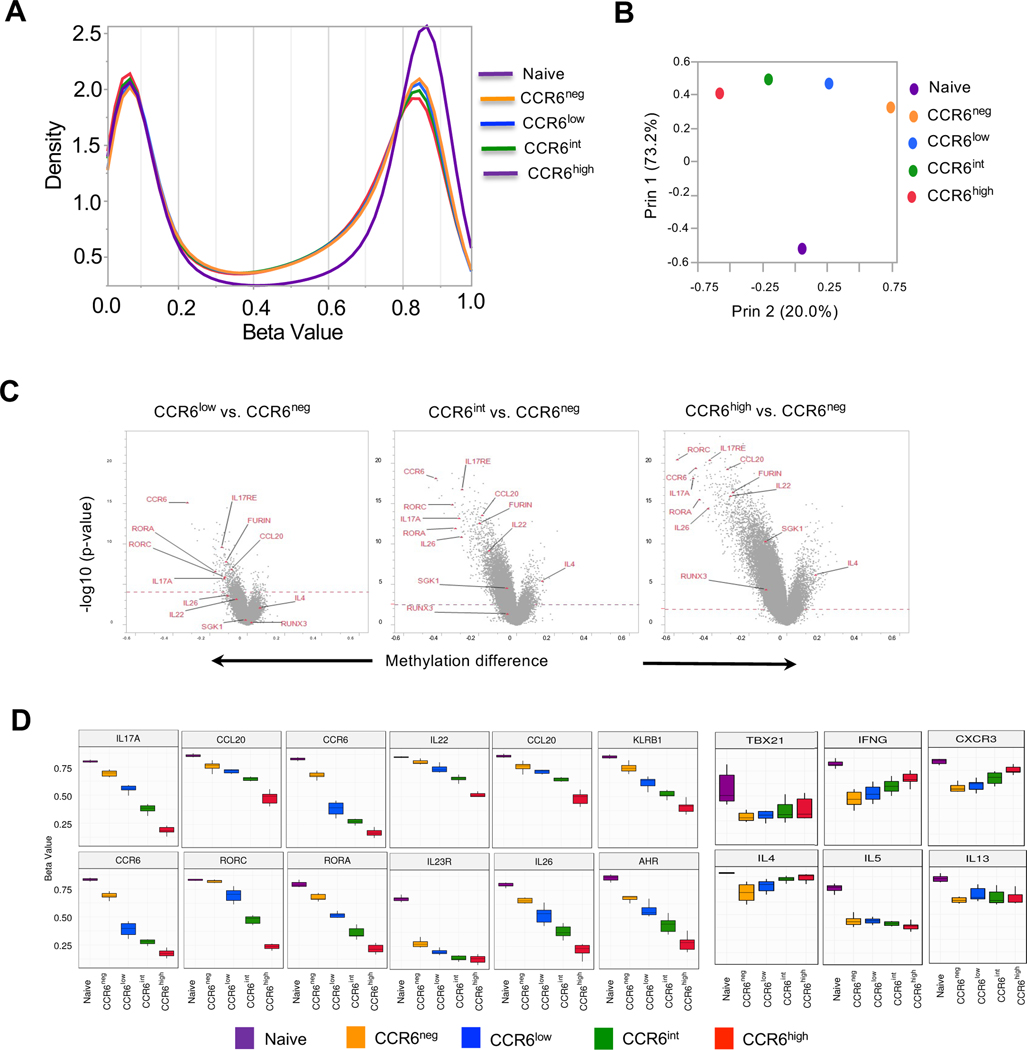
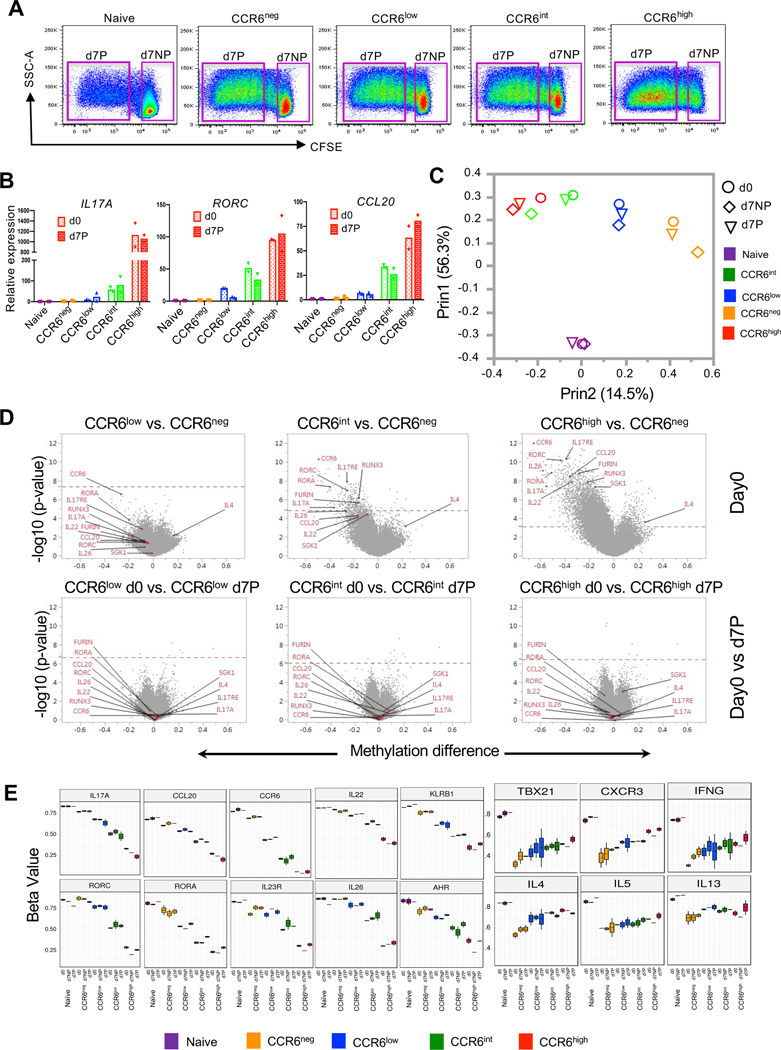
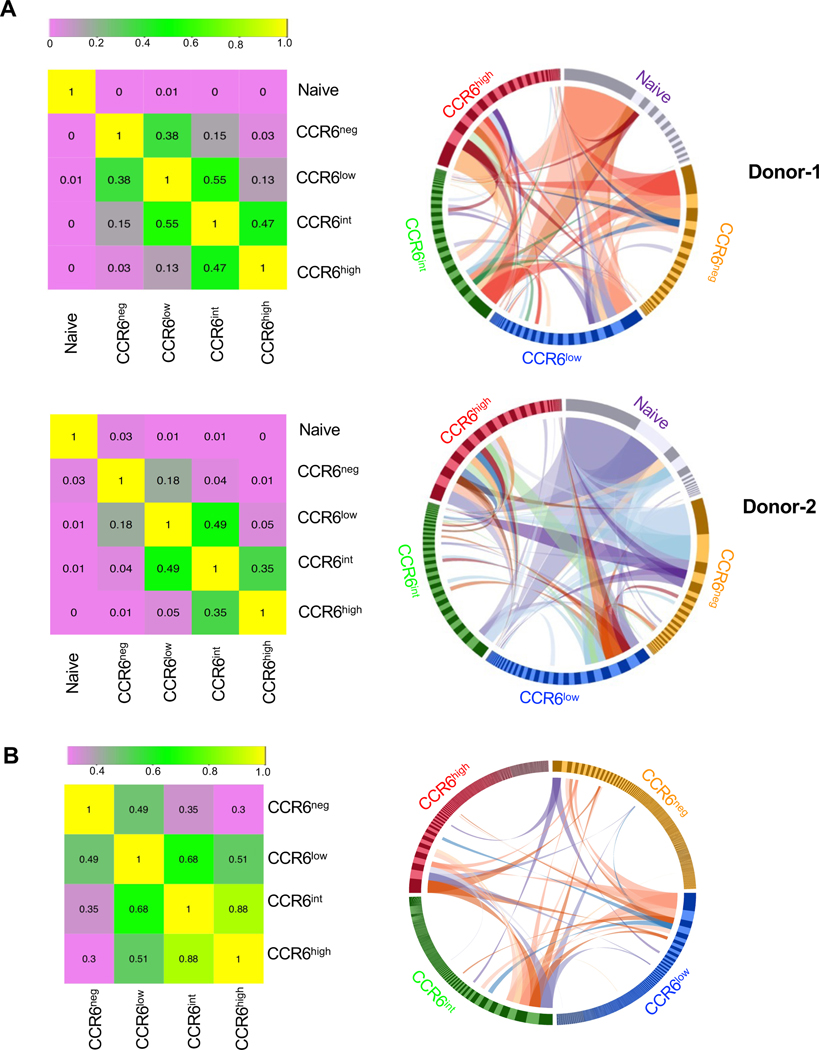
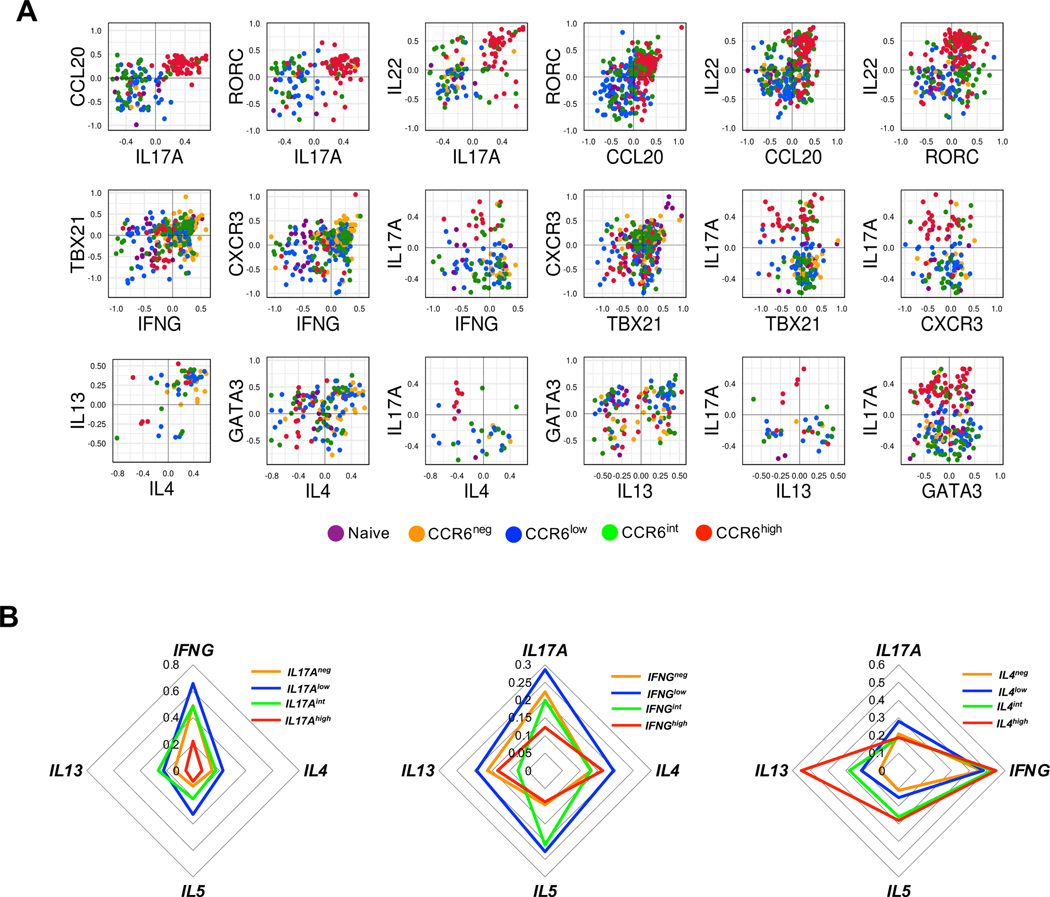
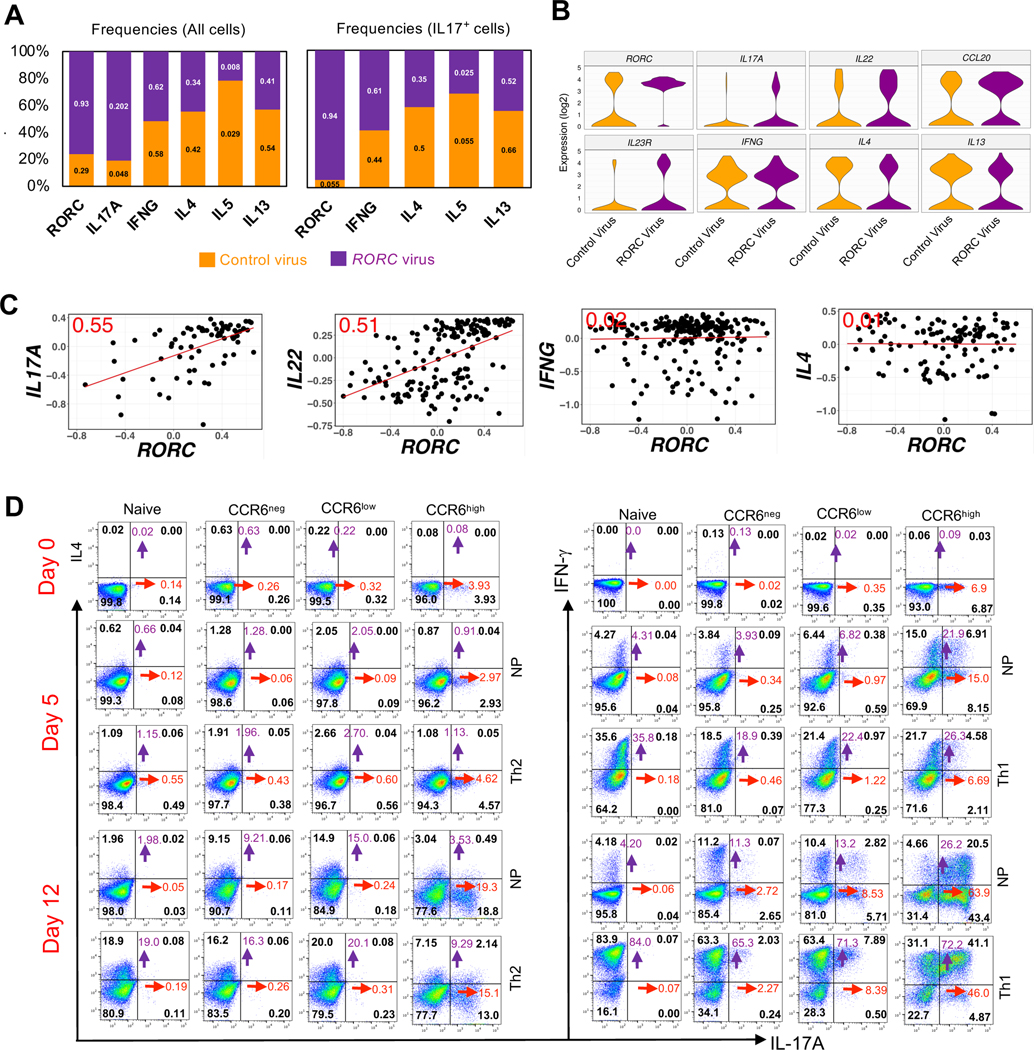
Th17 cells have been investigated in mice primarily for their contributions to autoimmune diseases. However, the pathways of differentiation of Th17 and related Th cells (type 17 cells) and the structure of the type 17 memory population in humans are not well understood; such understanding is critical for manipulating these cells in vivo. By exploiting differences in levels of surface CCR6, we found that human type 17 memory cells, including individual T cell clonotypes, form an elongated continuum of type 17 character along which cells can be driven by increasing RORγt. This continuum includes cells preserved within the memory pool with potentials that reflect the early preferential activation of multiple over single lineages. The phenotypes and epigenomes of CCR6+ cells are stable across cell divisions under noninflammatory conditions. Nonetheless, activation in polarizing and nonpolarizing conditions can yield additional functionalities, revealing, respectively, both environmentally induced and imprinted mechanisms that contribute differentially across the type 17 continuum to yield the unusual plasticity ascribed to type 17 cells.


Conflict of interest statement

Disclosures

The authors have no financial conflict of interest.

Figures

Figure 1.
Figure 1.. Progressive upregulation of type 17 genes and downregulation of type 1 and type 2 genes in CCR6-expressing memory subgroups.
(A) Elutriated lymphocytes from blood that had been enriched for CD4+ T cells were separated based on CD45RO staining into CD45RO (naïve) and CD45RO+ (memory) cells and the CD45RO+ cells were either separated into CCR6neg and CCR6pos subgroups or into CCR6neg, CCR6low, CCR6int and CCR6high subgroups. (B) Volcano plots showing fold changes (log2 ratios) versus significance (-log10 p-values) for genes in non-stimulated (top) or stimulated (bottom) cells for CCR6low, CCR6int and CCR6high subgroups compared with the CCR6neg subgroup. The red dotted line marks the cutoff for significance of differential expression at a false discovery rate ≤0.05. On each volcano plot are indicated the number of genes upregulated (red) or downregulated (green), and some genes of interest are labeled. (C) Heatmaps illustrating the relative patterns of gene expression differences between CCR6low, CCR6int and CCR6high subgroups compared with the CCR6neg subgroup. The standardized differences for the gene-specific probes showing the greatest differences in these comparisons were clustered by K-means (Figure S1 C); the color/value in each small box represents the mean across the genes in the cluster for each contrast. The cluster number, the number of unique gene-specific probes in that cluster and a representative gene in each cluster are shown. Analyses shown are combined from four individual donors for the non-stimulated cells and eight individual donors for stimulated cells, including four common donors.
Figure 2.
Figure 2.. Gradients of expression of lineage-associated genes with increasing CCR6.
(A) Relative mRNA expression was measured using real-time reverse-transcriptase (RT)-PCR. Ct values of all genes were normalized to GAPDH, and relative mRNA expression is shown for means (left panel) or for individual values (right panel) from four or more donors as percentages of the value in the highest expressing subgroup. (B) Protein levels in naïve and CCR6-defined memory subgroups for IL-2, IL-4, IL-5 and IL-13 were measured by ELISA from cell supernatants after 12 h of activation with PMA and ionomycin. For other proteins, cells were stimulated with the leukocyte activation cocktail for 6 h, fixed and permeabilized, stained for indicated genes, and analyzed by flow cytometry for percent of cells staining positive. In the left panel, means are shown of values from three or more donors, calculated as percentages of the value in the highest expressing subgroup. The right panel shows percentages of positive-staining cells from five or more donors. Symbols in the right panels indicate data from individual donors and bars indicate means. p values were determined using the Wilcoxon matched pairs signed rank test. *p < 0.05, **p < 0.01, ****p < 0.001.
Figure 3.
Figure 3.. Single-cell data reveal a continuum of expression levels among lineage-associated genes.
(A) Heat map representation of gene expression profiles using hierarchical clustering showing co-expression of lineage-specific genes in individual cells across naïve cells and CCR6-defined memory subgroups for 282 cells per subgroup. Delta Ct values were calculated using the average of housekeeping genes GAPDH and PGK1, and after excluding genes with low and/or inconsistent expression, a total of 38 non-housekeeping genes were included in the final analysis. Rows are genes and columns are cells. Some clustered, lineage-associated genes are indicated. (B) Correlations among CCR6low, CCR6int and CCR6high memory subgroups based on means of expression of the genes in A. (C) Gene expression values normalized as described in Materials and Methods for BioMark HD data for the 1410 cells from naïve and CCR6-defined memory subgroups. Each point represents a single cell, and each cell is colored based on its subgroup as indicated. The 1410 cells analyzed in A-C were from three donors.
Figure 4.
Figure 4.. Progressive changes in CpG methylation across CCR6-defined subgroups.
(A) Distribution of beta values across 450,000 CpG sites using the Illumina Infinium Methylation Assay with naïve cells and the CCR6-defined memory subgroups. Beta values (ratios) of 0.0 and 1.0 correspond to 0 and 100% methylation, respectively, of the sequences at a given CpG site. Data were combined from six donors. (B) Correlation and principal variance component projections of naïve cells and CCR6-defined memory subgroups-based genome-wide CpG methylation using the Illumina Infinium Methylation Assay. (C) Volcano plots showing differences in methylation beta values at CpG sites in the CCR6low, CCR6int and CCR6high subgroups compared with the CCR6neg subgroup versus significance (-log10 p-values). The red dotted line marks the cutoff for significance of differences between beta values at a false discovery rate ≤ 0.05. Some CpG sites at genes of interest are labelled. (D) For each of the indicated genes, box plots of methylation beta values are displayed for the single CpG site with the greatest variability among the cell subgroups. For A-D, data from six donors were combined for the analysis.
Figure 5.
Figure 5.. Stable epigenomes of CCR6-defined memory subgroups across cell divisions.
(A) After purification by cell sorting, cells were loaded with CFSE, activated with soluble anti-CD3 and cultured in the presence of IL-7 and IL-15 for seven days, after which cells were again FACS-purified into non-proliferated (d7NP) cells and cells that had undergone three or more cell divisions (d7P) according to the gating shown in these density-colored dot plots. Data are from one of the two donors used for these experiments. (B) Relative mRNA expression of IL17A, RORC and CCL20 in cell subgroups in the starting cells at day 0 (d0) and d7P cells. Cells were stimulated with PMA and ionomycin for three hours and mRNAs were measured using RT-PCR. Values for these genes were normalized to values for GAPDH and then to the results for naïve cells, which were set at 1. Bars indicate means. Data are shown for cells from the two donors used for these experiments. (C) Correlation and principal variance component projections based on the CpG methylation data of cell subgroups for d0, d7NP, and d7P cells. (D) Volcano plots showing differences in methylation beta values between CpG sites in the CCR6low, CCR6int and CCR6high subgroups compared with the CCR6neg subgroup at day 0 (top) or for each subgroup between d0 and d7P cells (bottom). The red dotted lines mark the cutoffs for CpG sites with significant differences at a false discovery rate ≤ 0.05. Some CpG sites at genes of interest are labelled. (E) Box plots of methylation beta values for the single CpG site with the greatest variability among the cell subgroups at lineage-associated genes for d0, d7NP and d7P cells. Data for C-E were combined from two donors.
Figure 6.
Figure 6.. TCR sequencing reveals shared clonotypes whose frequencies change across CCR6-defined memory subgroups.
(A) Two million T cells from each subgroup from two donors were used for sequencing TCR β chain cDNAs in bulk at a depth of 6.3–9.3 reads per cell and V(D)J sequences were used for identifying clonotypes. Morisita-Horn Similarity Indexes were calculated for pairwise comparisons to yield values between 0 (lowest similarity) and 1 (left panels). Circos plots display all clonotypes with the twenty highest frequencies in any subgroup (right panels). Bars in the circle have widths that are proportional to clonotype frequencies and are arranged within the cell subgroups clockwise in order of decreasing frequencies. Ribbons show connections between clonotypes among the cell subgroups for clonotypes with frequencies of 0.04 or greater within any cell subgroup. (B) Cells from each CCR6-defined memory T cell subgroup from a CMV-seropositive donor that proliferated in response to CMV antigens were used for single-cell sequencing of TCR α and β chains. Paired productive sequences were obtained from approximately 4000–6000 cells from each subgroup. Morisita-Horn Similarity Indexes were calculated for pairwise comparisons as in A (left panel). A Circos plot was produced using all clonotypes (right panel). Bars in the circle have widths that are proportional to clonotype frequencies and are arranged within the cell subgroups clockwise in order of decreasing frequencies. Ribbons show connections between clonotypes among the cell subgroups for clonotypes with frequencies of 0.03 or greater within any cell subgroup.
Figure 7.
Figure 7.. Co-expression of Th lineage-associated genes in single cells.
(A) Normalized values for expression of the indicated genes from 1410 cells from naïve and CCR6-defined memory subgroups from three donors were pooled and the values from cells co-expressing pairs of genes were plotted for comparison. Each dot corresponds to a single cell and dots are colored based on their subgroups. (B) The normalized gene expression data from 1062 cells from the CCR6neg, CCR6low, CCR6int, and CCR6high memory cells from three donors were pooled and cells were divided into positive and negative for IL17A, IFNG, or IL4, and the positive cells were equally divided into low, intermediate, and high groups based on their expression values for the respective genes. Within each of the four IL17A-, IFNG-, or IL4-defined and color-coded groups of cells, frequencies of cells expressing the other indicated genes are displayed on the concentric diamonds.
Figure 8.
Figure 8.. Position in the type 17 continuum determines sensitivity to master regulators and mechanisms of plasticity.
(A) Numbers on the lower and upper bar segments show frequencies of cells expressing the indicated genes in the CCR6low cells that had been transduced with control or RORC lentiviral vectors, respectively. Each bar is divided according to the relative frequencies of the control- and RORC-transduced cells expressing the indicated genes. Left panel shows data from all transduced cells and right panel shows data only from cells with detectable expression of IL17A. (B) Violin plots with expression distributions for the indicated genes in the CCR6low cells that had been transduced with control or RORC lentiviral vectors. (C) Normalized Ct values are plotted for the CCR6low cells that had been transduced with control or RORC lentiviral vectors and showed co-expression of RORC with IL17A, IL22, IFNG or IL4. Each dot represents a single cell, the red line is the least squares regression line, and the number in red in each plot is the correlation coefficient, r. For A-C, data are pooled from four donors. (D) Dot plots showing intracellular expression on days 0, 5 and 12 after culturing in non-polarizing (NP), Th2 or Th1 conditions of IL-17A vs IL-4 and IL-17A vs IFNγ in naïve cells (CD4+CD45ROCD25CXCR5CCR4CXCR3), and IL-17A vs IL-4 in CCR6neg(CD4+CD45RO+CD25CXCR5CCR4CCR6), CCR6low(CD4+CD45RO+CD25CXCR5CCR4CCR6low), and CCR6high(CD4+CD45RO+CD25CXCR5CCR4CCR6high) subgroups and IL-17A vs IFNγ in CCR6neg(CD4+CD45RO+CD25CXCR5CXCR3CCR6), CCR6low(CD4+CD45RO+CD25CXCR5CXCR3CCR6low), and CCR6high(CD4+CD45RO+CD25CXCR5CXCR3CCR6high) subgroups. Cells were stimulated with the leukocyte activation cocktail for 6 h, fixed and permeabilized and stained for indicated genes. For determining percentages of cells staining positive, quadrants were drawn based on staining with isotype-matched control antibodies. The numbers in black indicate the percentage of cells in each quadrant, whereas purple and red numbers show the sums of percentages of positive cells in the upper two or rightmost two quadrants, respectively. Data are representative of results from three donors.

Update of

Similar articles

Cited by

References

    1. Farber DL, Netea MG, Radbruch A, Rajewsky K, and Zinkernagel RM. 2016. Immunological memory: lessons from the past and a look to the future. Nat Rev Immunol 16: 124–128. - PubMed
    1. Hammarlund E, Lewis MW, Hansen SG, Strelow LI, Nelson JA, Sexton GJ, Hanifin JM, and Slifka MK. 2003. Duration of antiviral immunity after smallpox vaccination. Nat Med 9: 1131–1137. - PubMed
    1. Naniche D, Garenne M, Rae C, Manchester M, Buchta R, Brodine SK, and Oldstone MB. 2004. Decrease in measles virus-specific CD4 T cell memory in vaccinated subjects. J Infect Dis 190: 1387–1395. - PubMed
    1. Khader SA, Bell GK, Pearl JE, Fountain JJ, Rangel-Moreno J, Cilley GE, Shen F, Eaton SM, Gaffen SL, Swain SL, Locksley RM, Haynes L, Randall TD, and Cooper AM. 2007. IL-23 and IL-17 in the establishment of protective pulmonary CD4+ T cell responses after vaccination and during Mycobacterium tuberculosis challenge. Nat Immunol 8: 369–377. - PubMed
    1. Teijaro JR, Verhoeven D, Page CA, Turner D, and Farber DL. 2010. Memory CD4 T cells direct protective responses to influenza virus in the lungs through helper-independent mechanisms. J Virol 84: 9217–9226. - PMC - PubMed

Publication types