. 2023 Apr 24;19(4):e1011339.
doi: 10.1371/journal.ppat.1011339. eCollection 2023 Apr.

Neutralization of zoonotic retroviruses by human antibodies: Genotype-specific epitopes within the receptor-binding domain from simian foamy virus

Affiliations

Neutralization of zoonotic retroviruses by human antibodies: Genotype-specific epitopes within the receptor-binding domain from simian foamy virus

Lasse Toftdal Dynesen et al. PLoS Pathog. .

Abstract

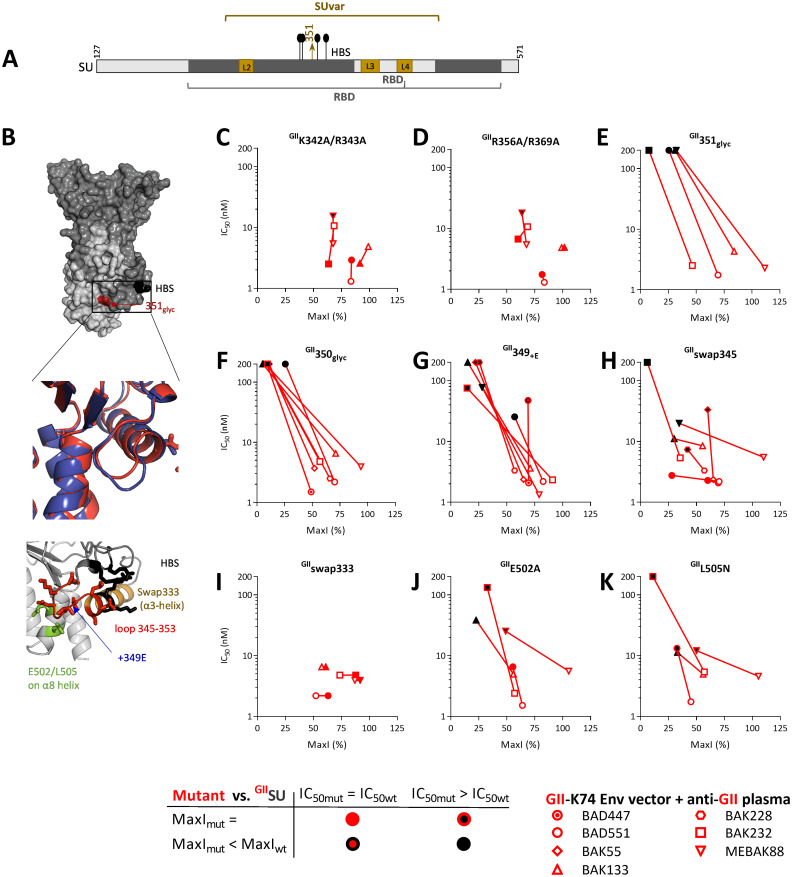
Infection with viruses of animal origin pose a significant threat to human populations. Simian foamy viruses (SFVs) are frequently transmitted to humans, in which they establish a life-long infection, with the persistence of replication-competent virus. However, zoonotic SFVs do not induce severe disease nor are they transmitted between humans. Thus, SFVs represent a model of zoonotic retroviruses that lead to a chronic infection successfully controlled by the human immune system. We previously showed that infected humans develop potent neutralizing antibodies (nAbs). Within the viral envelope (Env), the surface protein (SU) carries a variable region that defines two genotypes, overlaps with the receptor binding domain (RBD), and is the exclusive target of nAbs. However, its antigenic determinants are not understood. Here, we characterized nAbs present in plasma samples from SFV-infected individuals living in Central Africa. Neutralization assays were carried out in the presence of recombinant SU that compete with SU at the surface of viral vector particles. We defined the regions targeted by the nAbs using mutant SU proteins modified at the glycosylation sites, RBD functional subregions, and genotype-specific sequences that present properties of B-cell epitopes. We observed that nAbs target conformational epitopes. We identified three major epitopic regions: the loops at the apex of the RBD, which likely mediate interactions between Env protomers to form Env trimers, a loop located in the vicinity of the heparan binding site, and a region proximal to the highly conserved glycosylation site N8. We provide information on how nAbs specific for each of the two viral genotypes target different epitopes. Two common immune escape mechanisms, sequence variation and glycan shielding, were not observed. We propose a model according to which the neutralization mechanisms rely on the nAbs to block the Env conformational change and/or interfere with binding to susceptible cells. As the SFV RBD is structurally different from known retroviral RBDs, our data provide fundamental knowledge on the structural basis for the inhibition of viruses by nAbs. Trial registration: The study was registered at www.clinicaltrials.gov: https://clinicaltrials.gov/ct2/show/NCT03225794/.


Conflict of interest statement

The authors have declared that no competing interests exist.

Figures

Fig 1
Fig 1. Current knowledge of SFV Env and its RBD.
A. Schematic representation of SFV Env. The precursor Env protein is cleaved by furin-like protease(s) at two sites (vertical bars) to generate LP, SU, and TM. The dark sections highlight the transmembrane regions of LP (H) and TM (MSD), and the fusion peptide (FP). The minimal continuous RBD (aa 225–555, blue background) comprises two regions essential for SU binding to cells, RBD1 (aa 225–396) and RBD2 (aa 484–555) [13]. The intervening region (aa 397–483), named RBDj, can be deleted without abrogating binding to susceptible cells. Genetic studies on SFV strains circulating in Central Africa have identified two genotypes that differ in the sequence encoding the central part of the SU (SUvar, aa 248–488) domain [11, 12]. SUvar partially overlaps with the RBD and is the exclusive target of nAbs [7]. B. The RBD (aa 218–552) structure from a genotype II gorilla SFV strain is shown as a ribbon (PDB code 8AIC), with SUvar in red and SUcon in grey [14]. Side chains of the glycans are shown and were identified on deglycosylated RBD [14]. Structural elements relevant for the present study are indicated. C. Schematic representation of the two RBD subdomains and their location at the top of Env trimers; the drawing highlights the region involved in trimer assembly [14, 15]. D. RBDj is located at the apex of the RBD upper subdomain; RBD1 forms the second part of the upper subdomain, prolonged in the lower subdomain by an arm wrapping around the stem (RBD2), of which the sequence is conserved. Structural features described in [14] are highlighted on the solvent exposed face of the RBD: the loops mediating trimer interaction (loop 1 is on the internal face and thus not depicted), the conserved glycosylation site (N8), and the HBS. E. The SUvar domain forms the upper RBD subdomain and part of the lower subdomain.
Fig 2
Fig 2. The SFV SU block nAbs.
A. Schematic presentation of the neutralization assay using immunoadhesin as competitor. SU immunoadhesins are chimeric proteins composed of SU, the constant fragment of murine IgG2a, and a double Strep-tag. The SU, RBD, and SUvar are highlighted in the drawing. Plasma samples were diluted to achieve a reduction in the number of FVV-transduced cells by 90%. WT SU compete with Env on FVV for binding by nAbs, resulting in a higher number of FVV-transduced cells; mutations in SU that affect binding by nAbs result in inefficient competition and reduced FVV transduction. Representative images of wells with FVV-transduced cells stained by X-gal are shown. B. The BAK132 (anti-GI) and MEBAK88 (anti-GII) plasma samples were incubated with SU and the mix added to FVVs expressing matched Env before titration. The relative proportion of transduced cells is expressed as the percentage of cells transduced by untreated FVVs (no plasma and no protein), is referred to as the relative infectivity, and is presented as a function of protein concentration. The addition of CISU (blue symbols) inhibited the action of nAbs from sample BAK132, as shown by increased CI-PFV Env FVV relative infectivity, whereas GIISU (red symbols) had no effect. Conversely, GIISU inhibited the action of nAbs from sample MEBAK88. MLVSU (grey symbols) had no effect on the plasma antibodies. One representative experiment performed in triplicate is presented as mean and standard error to the mean. C. The infectivity of the CI-PFV and GII-K74 Env vectors was quantified in the presence of CISU, GIISU, and MLVSU; the relative infectivity is presented as a function of protein concentration. One representative experiment performed in triplicate is presented as mean and standard error to the mean. D. Schematic representation of a WT SU titration curve, summarized by two parameters, MaxI and IC50. E and F. Thirteen pairs of plasma samples and genotype-matched SU were tested at least five times for their activity against FFVs. The mean and standard error of the mean of the IC50 (panel E) and MaxI (panel F) are shown for the CI-PFV Env vectors and anti-GI plasma samples (blue symbols) and the GII-K74 Env vectors and anti-GII plasma samples (red symbols). G. To define neutralizing epitopes, we synthesized SU mutants with four types of alterations in SUvar: mutations, deletion, glycan insertion, and swapping of sequences with the second genotype. H. Schematic representation of titration curves corresponding to SU mutants that lose their capacity to block a fraction of nAbs (mut1, green), block all nAbs with reduced affinity (mut2, orange), or block a fraction of nAbs with reduced affinity (mut 3, pink) or those with no blocking activity (mut4, purple). Two parameters were defined using the curves, MaxI and IC50, and were compared to those obtained with WT SU (panels E and F) to detect significant differences in binding (see Materials and methods).
Fig 3
Fig 3. SFV-specific nAbs recognize glycans on SUvar.
A. Schematic representation of N-glycosylation sites on the SU. The N7’ site (position 374, brown symbol) is absent from CI-PFV but present in zoonotic gorilla SFV and several chimpanzee SFVs [11]. The N8 site (position 391, bold stem) is strictly conserved and required for SU expression [23]. The N10 site has a genotype-specific location (N411 in GII strains, red symbol; N422 or 423 in GI/CI strains, blue symbol). The glycosylation sites outside SUvar are shown in grey. B. The RBD is shown as a solvent accessible surface, with SUvar in dark grey and SUcon in light grey. The glycans resolved in the SFV RBD X-ray structure are shown as sticks, colored in orange for those for which a deletion mutant was constructed, in black for the N8 and in grey for that located on SUcon; the N5 glycan was poorly resolved and N286 is colored to indicate the localization of its anchor. C and D. To determine whether SFV-specific nAbs target residue glycosylated epitopes, vectors carrying GII-K74 Env were mixed with four genotype-matched plasma samples previously incubated with untreated, kifunensine treated (C), or kifunensine and endo-H treated (D) GIISU at several concentrations. E. To test whether nAbs target the genotype-specific N10 glycosylation site, the SU in which N10 was removed (GIIΔN10) was incubated with four genotype-matched plasma samples. F. Residues 407–413 were swapped with those from the GI-D468 strain and the resulting GIIswap407 was tested for its ability to block four anti-GII plasma samples. The glycosylation sites located on the SUvar were inactivated one by one (except N8) and tested for their inability to block four GII-specific plasma samples (G to K). GIIΔN7’ was tested against three additional samples to confirm its impact on nAbs (J). For each plasma sample, two parameters were calculated as descibed in material and methods and displayed on the graphs. IC50 is presented as a function of MaxI for untreated and enzyme-treated GIISU (C and D) or GIISU and mutants (E to K). The IC50 and MaxI values for untreated GIISU are presented as open symbols and are from the same experiment in which the mutant SU were tested. For the enzyme-treated and mutant SU, the symbols are colored according to the IC50 and MaxI thresholds that were used to statistically define significant differences from GIISU.
Fig 4
Fig 4. Most plasma samples contain nAbs that recognize the RBDj domain.
A. Schematic representation of the SU, with the RBD, the loops, and the inserted glycosylation sites. B. The RBD is shown as a solvent accessible surface with SUvar in dark grey, SUcon in light grey, the side chain from the N8 glycans in dark grey, L2 in orange, L3 in green, L4 in maroon, HBS in black, and the positions of glycosylation site insertions in dark red. To locate SFV-specific nAb epitopes on the upper RBD subdomain, GIISU and mutants with RBDj deleted (GIIΔRBDj, panel C), deleted loops (GIIΔL2, GIIΔL3, and GIIΔL4 in panels D-F), and glycans inserted in putative epitopes (at positions 426, 450, 459, 485, and 263 in panels G to K) were tested against at least four plasma samples. Those for which the capacity to block nAbs was the most altered were then tested on additional samples. For each plasma sample, two parameters were calculated as descibed in material and methods and displayed on the graphs. IC50 is presented as a function of MaxI for GIISU and the mutant SU. The IC50 and MaxI values for GIISU are presented as open symbols and are from the same experiment in which the mutant SU were tested. Symbols are colored according to the IC50 and MaxI thresholds used to define statistically significant differences from GIISU.
Fig 5
Fig 5. Epitope disruption by glycan insertion reveals an epitope site on the lower RBD subdomain.
A. Schematic representation of the SU, with the RBD, loops, HBS, and site of glycan insertion at position 351 on SU. B. The RBD is shown as a solvent accessible surface with SUvar in dark grey, SUcon in light grey, HBS in black, and the glycan insertion site in dark red. In the top insert, the 345–353 loop and adjacent helix are presented as ribbons and side chains for GII-K74 (red) and CI-PFV (blue, AlphaFold2-predicted structure). In the bottom insert, the 345–353 loop (red) and adjacent helix are presented as ribbons and side chains for GII-K74, with colored residues indicating the HBS (black), swap333 construct (light brown), insertion site at position 349 (blue), and two residues on the adjacent helix (green). To locate SFV-specific nAb epitopes on SU functional domains, vectors carrying GII-K74 Env were treated with GII-specific plasma samples previously incubated with the Env ectodomain carrying WT or mutated HBS (GIIK342A/R343A in panel C and GIIK356A/R369A in panel D). E. A candidate genotype-specific sequence (S1 Table) was disrupted by inserting glycan in the SU at position 351 and tested for its capacity to block nAbs. F to K. Five mutant SU were tested to characterize the epitopic region in the 345–353 loop. All mutants were tested against at least four plasma samples. Those for which the capacity to block nAbs was the most altered were then tested on additional samples. For each plasma sample, two parameters were calculated as descibed in material and methods and displayed on the graphs. IC50 is presented as a function of MaxI for GIISU and the mutant SUs. The IC50 and MaxI values of GIISU are presented as open symbols and are those from the same experiment in which the mutants were tested. Symbols are colored according to the IC50 and MaxI thresholds used to statistically define significant differences from GIISU. We applied the same threshold values for the analyses of the Env ectodomain, which had the same inhibitory activity as GIISU (S2 Fig). GIIswap333 was tested twice at three concentrations and showed similar blocking capacity as GIISU; the IC50 values were arbitrarily set to the same level as those of GIISU (see Materials and methods).
Fig 6
Fig 6. The 345–353 loop is targeted by nAbs at the surface of viral vector particles.
A. Three batches of FVVs carrying Env with GIISU or GIISUswap345 were produced. The concentration of vector particles was quantified by RT-qPCR amplification of the bgal transgene. B. FVV infectious titers were quantified on BHK-21 cells. C. FVVs carrying WT and mutated Env were incubated with HT1080 cells at 10 or 100 particles/cells on ice for 1 h before washing and quantification of bgal mRNA incorporation in the vector particles and the gapdh gene of susceptible cells. The levels of bgal and cellular gapdh mRNA were quantified by RT-qPCR; the ΔΔCt method was used to calculate the relative number of FVV particles bound to cells. The dotted lines in panels A to C represent the quantification threshold and the black lines the mean values from the three FVV batches. The infectious titers, particle concentration, and levels of bound particles from FVVs carrying mutant or WT SU were compared using the paired t test and all p values were > 0.05. D to J. Neutralization assays were carried out by transducing BHK-21 cells with SFV vectors carrying WT (plain symbols) or swap345 (open symbols) GII Env. Vectors were previously incubated with 10 serial dilutions of human plasma samples; the lowest dilution ranged between 1:20 or 1:160 according to the donors’ neutralization titers [7]. Assays were performed twice in triplicate and the results from one experiment are shown. Cells were transduced with untreated FFV to provide the reference value. Relative infectivity was calculated for wells treated with plasma samples and is expressed as the percentage of the reference value. Relative infectivity (mean, SEM) is presented as a function of the plasma dilution. Arrows indicate neutralization titers against vectors carrying WT (plain line) and swap345 (broken line) GII Env. Plasma samples are the same as those presented in Figs 3–5: D, BAD447; E, BAD551; F, BAK55; G, BAK133; H, BAK228; I, BAK232; and J, MEBAK88.
Fig 7
Fig 7. GI and GII-specific nAbs target different epitopes.
CI SU with mutations matching the most informative GII SU mutations were tested for their capacity to block nAbs from GI-specific plasma samples. A, Kifunensin-treated CISU; B, Kifunensin and endoH-treated CISU; C, CIΔN10; D, CI350glyc; E, CIΔRBDj; F, CIΔL2; G, CIΔL3; H, CIΔL4; I, CI463glyc; J, GIIswapRBDj; K, GIISU; L, CIswapL3. All mutants were tested against four plasma samples. Those for which the capacity to block nAbs was the most altered were then tested on additional samples. For each plasma sample, two parameters were calculated as descibed in material and methods and displayed on the graphs. IC50 is presented as a function of MaxI for the CISU and mutant SU. The IC50 and MaxI values of CISU are presented as open symbols and are those from the same experiment in which the mutant SU were tested. For mutant SU, the symbols are colored according to the IC50 and MaxI thresholds used to statistically define significant differences from CISU. The red lines correspond to data obtained with GII-specific plasma samples against equivalent constructs (Panels 3C, 3D, 3E, 5F, 4C, 4D, 4E, 4F, and 4I match panels 7A to 7H, respectively).
Fig 8
Fig 8. Plasma antibodies do not bind to peptides covering the loops from the upper RBD subdomain.
Twelve plasma samples from African hunters (S4 Table) were tested for binding to peptides overlapping loops located in the upper subdomain of the RBD (S5 Table). Plasma samples from four uninfected (grey symbols), four GI-infected (blue symbols), and four GII-infected (red symbols) individuals were tested in triplicate. The CMV and SFV Env6 peptides were used as positive controls and the SFV Env5 peptide as a negative control [24]. The peptide diluent was used as the negative control and antibody binding to peptides is expressed as the difference in OD (ΔOD = ODtest−ODcontrol). The responses are presented as ΔOD (y-axis) for each peptide (x-axis).
Fig 9
Fig 9. nAbs target epitopic regions involved in SU binding to susceptible cells or required for viral infectivity.
A. HT1080 cells were incubated with the panel of tested immunadhesins (Figs 3–7). Cell-bound SU were detected by staining with a fluorescently labeled antibody targeting the murine IgG Fc fragment. Stained cells were analyzed on a flow cell cytometer. S8 Fig presents the gating strategy and normalization of the results to the levels of bound WT SU (GIISU and CISU). Data from two independent experiments are presented with the line corresponding to the median value. Binding levels of GII mutants are presented by (red symbols). CI mutants (blue symbols) are presented side-by-side with the corresponding and related GII mutants, with a colored background. Mutated HBS shows reduced binding to susceptible cells, as shown in [14].
Fig 10
Fig 10. Human plasma samples contain nAbs targeting a variable number of epitopic regions.
A. In the present study, we identified three epitopic sites on SUvar: the RBD apex, the N8 region, and the 345–353 loop. The schematic summary highlights L2, L3, and L4, the conserved N8 and adjacent N7’ glycosylation site, and the 345–353 loop (lines ending with a dot). Glycans inserted in predicted epitopes revealed additional antigenic sites (lines ending with a triangle). B and C. The results from competition experiments are summarized for each plasma sample and for the mutant SU from the most highly targeted regions (apex, N8 region, and the 345–353 loop). Four outcomes are presented: same recognition as WT SU (green), recognition with reduced affinity (i.e., increased IC50, orange vertical shading), blocking a smaller fraction of nAbs than WT SU (i.e., reduced MaxI, orange horizontal shading), or having both effects (orange). Mutants corresponding to the major epitopic regions of the GII- and GI-specific samples are presented in panels B and C, respectively. Within each epitopic region defined by several mutant SU, nAb specificity varied between individuals.

Similar articles

Cited by

References

    1. Rethwilm A, Bodem J. Evolution of foamy viruses: the most ancient of all retroviruses. Viruses. 2013;5:2349–74. doi: 10.3390/v5102349 - DOI - PMC - PubMed
    1. Pinto-Santini DM, Stenbak CR, Linial ML. Foamy virus zoonotic infections. Retrovirology. 2017;14:55. doi: 10.1186/s12977-017-0379-9 - DOI - PMC - PubMed
    1. Betsem E, Rua R, Tortevoye P, Froment A, Gessain A. Frequent and recent human acquisition of simian foamy viruses through apes’ bites in Central Africa. PLoS Pathog. 2011;7:e1002306. doi: 10.1371/journal.ppat.1002306 - DOI - PMC - PubMed
    1. Filippone C, Betsem E, Tortevoye P, Cassar O, Bassot S, Froment A, et al.. A severe bite from a nonhuman primate is a major risk factor for HTLV-1 infection in hunters from Central Africa. Clin Infect Dis. 2015;60:1667–76. doi: 10.1093/cid/civ145 - DOI - PubMed
    1. Buseyne F, Betsem E, Montange T, Njouom R, Bilounga Ndongo C, Hermine O, et al.. Clinical signs and blood test results among humans infected with zoonotic simian foamy virus: a case-control study. J Infect Dis. 2018;218:144–51. doi: 10.1093/infdis/jiy181 - DOI - PubMed

Publication types

Associated data