. 2023 May 2;120(18):e2301754120.
doi: 10.1073/pnas.2301754120. Epub 2023 Apr 24.

Climate change, tree demography, and thermophilization in western US forests

Affiliations

Climate change, tree demography, and thermophilization in western US forests

Kyle C Rosenblad et al. Proc Natl Acad Sci U S A. .

Abstract

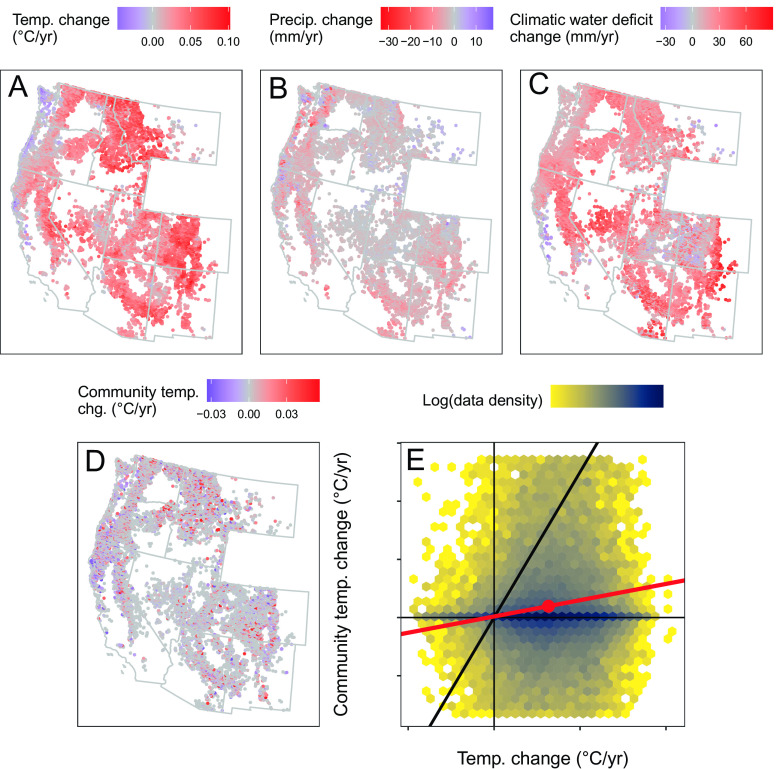
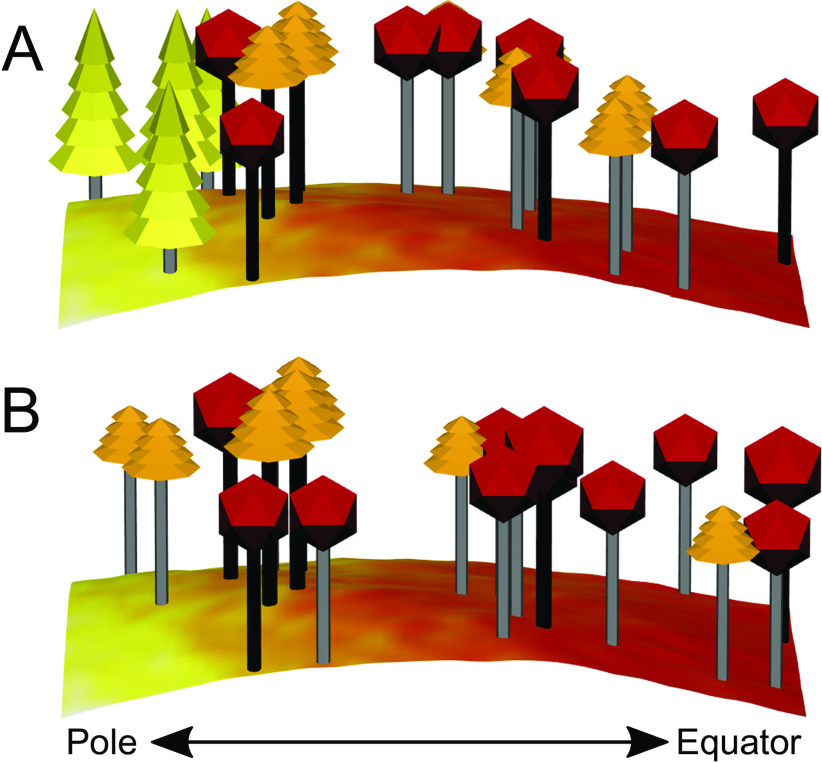
Climate change is driving widespread changes in ecological communities. Warming temperatures often shift community composition toward more heat-tolerant taxa. The factors influencing the rate of this "thermophilization" process remain unclear. Using 10-y census data from an extensive forest plot network, we show that mature tree communities of the western United States have undergone thermophilization. The mean magnitude of climate warming over the 10-y study interval was 0.32 °C, whereas the mean magnitude of thermophilization was 0.039 °C. Differential tree mortality was the strongest demographic driver of thermophilization, rather than growth or recruitment. Thermophilization rates are associated with recent changes in temperature and hydrologic variables, as well as topography and disturbance, with insect damage showing the strongest standardized effect on thermophilization rates. On average, thermophilization occurred more rapidly on cool, north-facing hillslopes. Our results demonstrate that warming temperatures are outpacing the composition of western US forest tree communities, and that climate change may erode biodiversity patterns structured by topographic variation.

Keywords: climate change; demography; forests; thermophilization; tree mortality.


Conflict of interest statement

The authors declare no competing interest.

Figures

Fig. 1.
Fig. 1.
(A) Baseline mean annual temperature at 30-arcsecond (roughly 1 km) spatial resolution. (B) Baseline mean annual precipitation at 30-arcsecond resolution. (C) Baseline climatic water deficit at 1/24-degree (roughly 4 km) spatial resolution. (D) Tree community temperature index. In AD, the 4 subplot-scale values for each plot are summarized by a single mean value per plot. (E) Tree community temperature index vs. baseline mean annual temperature, with hexagons colored by data density. The red trendline, added for illustrative purposes, is generated by simple linear regression (slope = 0.843). The black “one-to-one” line has slope 1 and y-intercept 0.
Fig. 2.
Fig. 2.
Violin plot of 95% credible intervals for standardized effects of fixed predictors on baseline community temperature index in western US tree communities. Results come from hierarchical Bayesian regression models of tree community temperature index over time. Violins can be interpreted as smoothed, horizontally symmetrical histograms, with the vertical axis representing parameter values and the horizontal axis representing probability density. The total area of each violin is set to be equal, so shorter and wider violins correspond to model parameters for which the posterior probability density is more concentrated around the mean.
Fig. 3.
Fig. 3.
(A) Recent 15-y changes in mean annual temperature from gridMET data at 1/24 arcsecond (roughly 4 km) spatial resolution. (B) Recent 15-y changes in mean annual precipitation from gridMET. (C) Recent 15-y changes in CWD from TerraClimate data at 1/24-degree (roughly 4 km) spatial resolution. (D) Recent 10-y changes in tree community temperature index. In AD, the 4 subplot-scale values for each plot are summarized by a single mean value per plot. (E) Change in tree community temperature index vs. change in mean annual temperature. Each point represents one subplot. The red trendline, added for illustrative purposes, is generated by simple linear regression. The red point represents the mean of the x and y variables. The black “one-to-one” line has slope 1 and y-intercept 0. In AE, points below the fifth percentile or above the 95th percentile of change in community temperature index are omitted to improve pattern visibility and color scale perceptibility.
Fig. 4.
Fig. 4.
Violin plots of 95% credible intervals for standardized effects of fixed predictors on the magnitude of thermophilization in western US tree communities. Results come from hierarchical Bayesian regression models of tree community temperature index over time. Violins can be interpreted as smoothed, horizontally symmetrical histograms, with the vertical axis representing parameter values and the horizontal axis representing probability density. The total area of each violin is set to be equal, so shorter and wider violins correspond to model parameters for which the posterior probability density is more concentrated around the mean. The interval for mean thermophilization represents the effect size for a binary “T1 vs. T2” predictor that distinguishes between repeat tree censuses. The interval shown for each other predictor represents the effect size for the interaction between the named predictor and the “T1 vs. T2” predictor.
Fig. 5.
Fig. 5.
Before (A) and after (B) views of a topographically heterogeneous landscape occupied by a hypothetical tree community that exemplifies key trends in our data. Effect sizes are magnified for illustrative purposes. Three tree species are shown with three different temperature indices: a low temperature-associated species (five long crown layers shown in yellow, styled after Abies), a medium temperature-associated species (four short crown layers shown in orange, styled after Pinus), and a high temperature-associated species (an icosahedral crown shown in red, styled after deciduous trees). Trees with black trunks were present at both time points. Trees with gray trunks were only observed in one time point, due either to mortality (present in panel A only) or recruitment (present in panel B only). Topographic heat load ranges from low (yellow) on the pole-facing hillslope (Left) to high (red) on the equator-facing hillslope (Right).
Fig. 6.
Fig. 6.
Schematic of our approach to isolating each demographic process’s contribution to changes in tree community temperature index. Circles represent trees of two species (red and blue) as considered by each of the four analytical methods, which are represented by the four columns. The T1 community is considered the same way in all columns, whereas the T2 community differs. Trees marked with “F” are considered to have remained at fixed size between censuses. In the “All” column, all demographic processes (mortality, growth, and recruitment) are considered. In this example, one individual dies, three grow, and one recruits into the community. In the “Mortality” column, the effects of growth and recruitment are excluded, such that any trees present at both time points are held at constant size, and any trees that recruited are ignored. In the “Growth” column, the effects of mortality and recruitment are excluded, such that all trees that died are considered to have survived (but not grown) and all trees that recruited are ignored. In the “Recruitment” column, the effects of mortality and growth are excluded, such that all trees present at the first time point are considered to have remained present at constant size.

References

    1. Parmesan C., Yohe G., A globally coherent fingerprint of climate change impacts across natural systems. Nature 421, 37–42 (2003). - PubMed
    1. Scheffers B. R., et al. , The broad footprint of climate change from genes to biomes to people. Science 354, aaf7671 (2016). - PubMed
    1. Trugman A. T., Anderegg L. D. L., Anderegg W. R. L., Das A. J., Stephenson N. L., Why is tree drought mortality so hard to predict? Trends Ecol. Evol. 36, 1–13 (2021). - PubMed
    1. Harrison S., Spasojevic M. J., Li D., Climate and plant community diversity in space and time. Proc. Natl Acad. Sci. U.S.A. 117, 4464–4470 (2020), 10.1073/pnas.1921724117. - DOI - PMC - PubMed
    1. De Frenne P., et al. , Microclimate moderates plant responses to macroclimate warming. Proc. Natl Acad. Sci. U.S.A. 110, 18561–18565 (2013). - PMC - PubMed

Publication types