

Targeting SWI/SNF ATPases in H3.3K27M diffuse intrinsic pontine gliomas
- PMID: 37094128
- PMCID: PMC10161095
- DOI: 10.1073/pnas.2221175120
Targeting SWI/SNF ATPases in H3.3K27M diffuse intrinsic pontine gliomas
Abstract
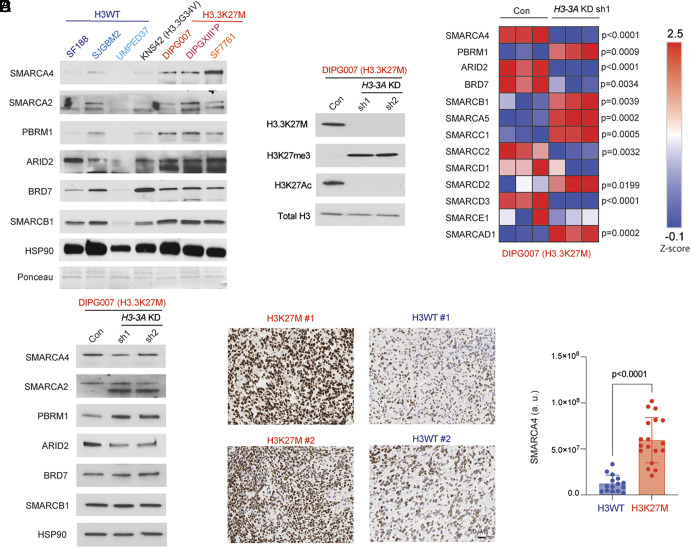
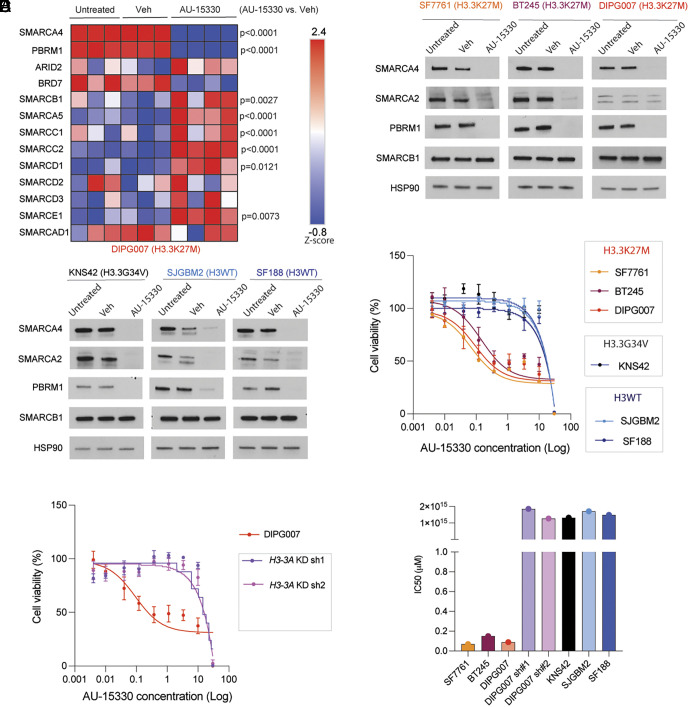
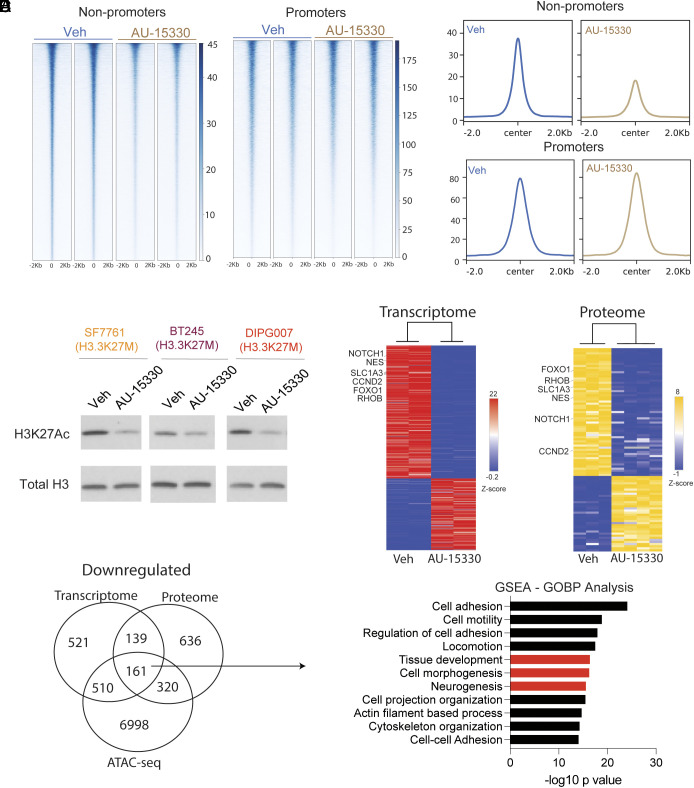
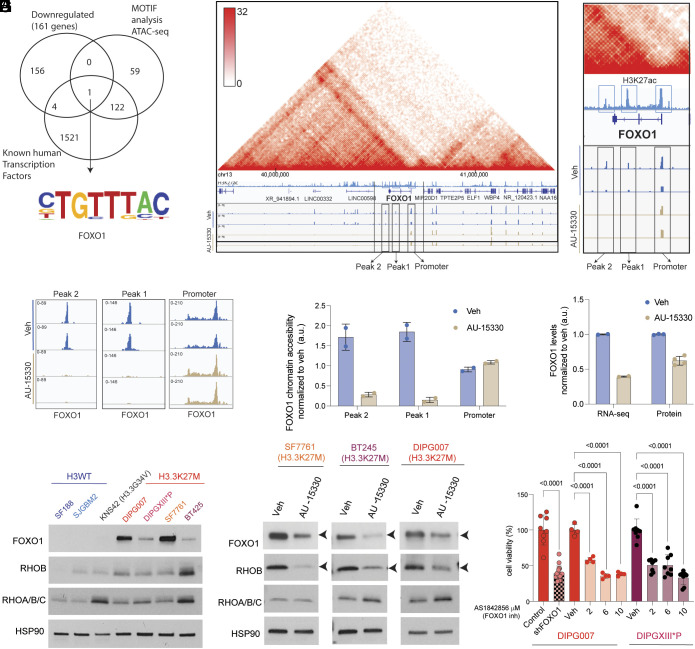
Diffuse midline gliomas (DMGs) including diffuse intrinsic pontine gliomas (DIPGs) bearing lysine-to-methionine mutations in histone H3 at lysine 27 (H3K27M) are lethal childhood brain cancers. These tumors harbor a global reduction in the transcriptional repressive mark H3K27me3 accompanied by an increase in the transcriptional activation mark H3K27ac. We postulated that H3K27M mutations, in addition to altering H3K27 modifications, reprogram the master chromatin remodeling switch/sucrose nonfermentable (SWI/SNF) complex. The SWI/SNF complex can exist in two main forms termed BAF and PBAF that play central roles in neurodevelopment and cancer. Moreover, BAF antagonizes PRC2, the main enzyme catalyzing H3K27me3. We demonstrate that H3K27M gliomas show increased protein levels of the SWI/SNF complex ATPase subunits SMARCA4 and SMARCA2, and the PBAF component PBRM1. Additionally, knockdown of mutant H3K27M lowered SMARCA4 protein levels. The proteolysis targeting chimera (PROTAC) AU-15330 that simultaneously targets SMARCA4, SMARCA2, and PBRM1 for degradation exhibits cytotoxicity in H3.3K27M but not H3 wild-type cells. AU-15330 lowered chromatin accessibility measured by ATAC-Seq at nonpromoter regions and reduced global H3K27ac levels. Integrated analysis of gene expression, proteomics, and chromatin accessibility in AU-15330-treated cells demonstrated reduction in the levels of FOXO1, a key member of the forkhead family of transcription factors. Moreover, genetic or pharmacologic targeting of FOXO1 resulted in cell death in H3K27M cells. Overall, our results suggest that H3K27M up-regulates SMARCA4 levels and combined targeting of SWI/SNF ATPases in H3.3K27M can serve as a potent therapeutic strategy for these deadly childhood brain tumors.
Keywords: H3K27M mutation; SWI/SNF complex; pediatric brain cancer.
Conflict of interest statement
S.S. is an employee of Aurigene Discovery Technologies.
Figures
Similar articles
-
An oncohistone-driven H3.3K27M/CREB5/ID1 axis maintains the stemness and malignancy of diffuse intrinsic pontine glioma.Nat Commun. 2025 Apr 17;16(1):3675. doi: 10.1038/s41467-025-58795-2. Nat Commun. 2025. PMID: 40246858 Free PMC article.
-
Epigenome Programming by H3.3K27M Mutation Creates a Dependence of Pediatric Glioma on SMARCA4.Cancer Discov. 2022 Dec 2;12(12):2906-2929. doi: 10.1158/2159-8290.CD-21-1492. Cancer Discov. 2022. PMID: 36305747 Free PMC article.
-
Common molecular features of H3K27M DMGs and PFA ependymomas map to hindbrain developmental pathways.Acta Neuropathol Commun. 2023 Feb 9;11(1):25. doi: 10.1186/s40478-023-01514-z. Acta Neuropathol Commun. 2023. PMID: 36759899 Free PMC article.
-
Histone H3K27M Mutation in Brain Tumors.Adv Exp Med Biol. 2021;1283:43-52. doi: 10.1007/978-981-15-8104-5_3. Adv Exp Med Biol. 2021. PMID: 33155136 Review.
-
Synthetic lethality: targeting SMARCA2 ATPase in SMARCA4-deficient tumors - a review of patent literature from 2019-30 June 2023.Expert Opin Ther Pat. 2024 Mar;34(3):159-169. doi: 10.1080/13543776.2024.2338111. Epub 2024 Apr 5. Expert Opin Ther Pat. 2024. PMID: 38578210 Review.
Cited by
-
Emerging roles of cancer-associated histone mutations in genomic instabilities.Front Cell Dev Biol. 2024 Oct 8;12:1455572. doi: 10.3389/fcell.2024.1455572. eCollection 2024. Front Cell Dev Biol. 2024. PMID: 39439908 Free PMC article. Review.
-
Global identification of SWI/SNF targets reveals compensation by EP400.Cell. 2023 Nov 22;186(24):5290-5307.e26. doi: 10.1016/j.cell.2023.10.006. Epub 2023 Nov 2. Cell. 2023. PMID: 37922899 Free PMC article.
-
A scoping review of diffuse hemispheric glioma, H3 G34-mutant: Epigenetic and molecular profiles, clinicopathology, and treatment avenues.Neurooncol Adv. 2024 Dec 7;6(1):vdae208. doi: 10.1093/noajnl/vdae208. eCollection 2024 Jan-Dec. Neurooncol Adv. 2024. PMID: 39759262 Free PMC article.
-
Forkhead box transcription factors (FOXOs and FOXM1) in glioma: from molecular mechanisms to therapeutics.Cancer Cell Int. 2023 Oct 11;23(1):238. doi: 10.1186/s12935-023-03090-7. Cancer Cell Int. 2023. PMID: 37821870 Free PMC article. Review.
-
Tight junction proteins in glial tumors development and progression.Front Cell Neurosci. 2025 Feb 3;19:1541885. doi: 10.3389/fncel.2025.1541885. eCollection 2025. Front Cell Neurosci. 2025. PMID: 39963115 Free PMC article. Review.
References
-
- Schroeder K. M., Hoeman C. M., Becher O. J., Children are not just little adults: Recent advances in understanding of diffuse intrinsic pontine glioma biology. Pediatr. Res. 75, 205–209 (2014). - PubMed
-
- Schwartzentruber J., et al. , Driver mutations in histone H3.3 and chromatin remodelling genes in paediatric glioblastoma. Nature 482, 226–231 (2012). - PubMed
-
- Sturm D., et al. , Hotspot Mutations in H3F3A and IDH1 Define Distinct Epigenetic and Biological Subgroups of Glioblastoma. Cancer Cell 22, 425–437 (2012). - PubMed
Publication types
MeSH terms
Substances
Grants and funding
LinkOut - more resources
Full Text Sources
Medical
Molecular Biology Databases
Research Materials
Miscellaneous
