. 2023 May 2;120(18):e2216668120.
doi: 10.1073/pnas.2216668120. Epub 2023 Apr 24.

Chemical factors induce aggregative multicellularity in a close unicellular relative of animals

Affiliations

Chemical factors induce aggregative multicellularity in a close unicellular relative of animals

Núria Ros-Rocher et al. Proc Natl Acad Sci U S A. .

Abstract

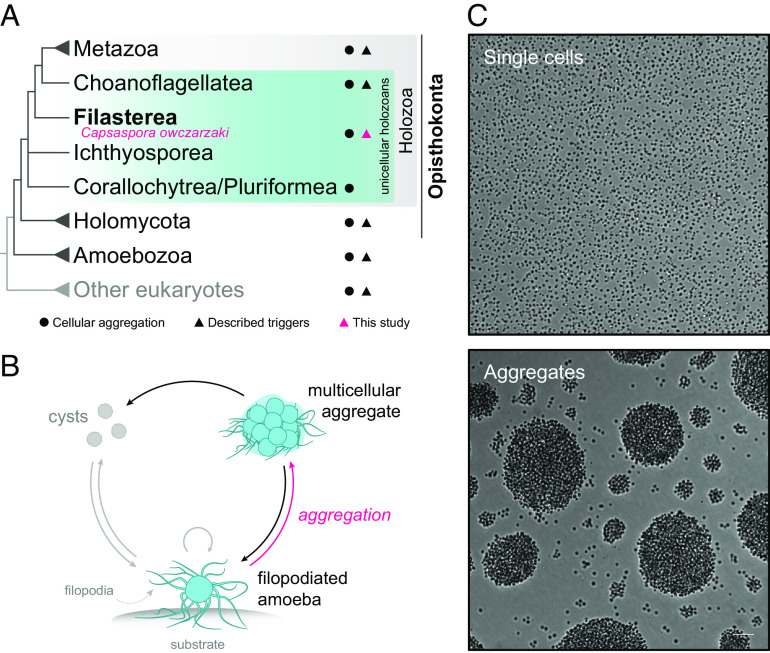
Regulated cellular aggregation is an essential process for development and healing in many animal tissues. In some animals and a few distantly related unicellular species, cellular aggregation is regulated by diffusible chemical cues. However, it is unclear whether regulated cellular aggregation was part of the life cycles of the first multicellular animals and/or their unicellular ancestors. To fill this gap, we investigated the triggers of cellular aggregation in one of animals' closest unicellular living relatives-the filasterean Capsaspora owczarzaki. We discovered that Capsaspora aggregation is induced by chemical cues, as observed in some of the earliest branching animals and other unicellular species. Specifically, we found that calcium ions and lipids present in lipoproteins function together to induce aggregation of viable Capsaspora cells. We also found that this multicellular stage is reversible as depletion of the cues triggers disaggregation, which can be overcome upon reinduction. Our finding demonstrates that chemically regulated aggregation is important across diverse members of the holozoan clade. Therefore, this phenotype was plausibly integral to the life cycles of the unicellular ancestors of animals.

Keywords: Capsaspora; aggregation; chemical signaling; lipoproteins; multicellularity.


Conflict of interest statement

The authors declare no competing interest.

Figures

Fig. 1.
Fig. 1.
Capsaspora transitions from a unicellular to a multicellular life stage. (A) Animals (Metazoa) and their closest unicellular relatives, including Capsaspora (Filasterea), form the Holozoa clade within the Opisthokonta supergroup. The phylogenetic relationships of selected taxa are based on several recent phylogenomic studies (–20). Uncertain positions are represented with polytomies. (B) Life stages of Capsaspora under culture conditions. The trophic proliferative cells are filopodiated amoebae adhered to the substrate (adherent stage). These amoebae can detach from the substrate and form multicellular aggregates (aggregative stage). In response to crowding or stress, cells from both the adherent and the aggregative stages can encyst by retracting the filopodia (cystic stage). Arrows indicate directionality of each transition, with an emphasis on aggregation (pink arrow) and disaggregation (black arrows). Loop arrow indicates cell division in adherent cells (21, 22). (C) Capsaspora single cells at the adherent stage (Top) transition to multicellular aggregates (Bottom). (Scale bar, 100 µm.)
Fig. 2.
Fig. 2.
Chemical cues from FBS are necessary to induce aggregation in Capsaspora. (A) Microscopy images of Capsaspora aggregates induced under agitation conditions in growth medium and medium lacking some of its major components. Aggregates failed to form in FBS-free media and in 1× phosphate buffered saline (PBS) (negative control) (SI Appendix, Fig. S1A assay). (Scale bar, 100 µm.) (B) Data from each test condition in A are represented as boxplots, showing the median aggregate area (thick black bar) and interquartile ranges from three independent biological replicates. Figure related to SI Appendix, Fig. S2. (C) FBS is sufficient to induce aggregation in the absence of physical agitation. Aggregation dynamics over time induced by 10% and 30% (v/v) FBS in the absence of physical agitation using tissue culture–treated (TC-treated) 12-well plates (SI Appendix, Fig. S1C assay). A 10% (v/v) and 30% (v/v) of 1× PBS were used as negative controls. Data are represented as the average aggregate area (thick line) ± SEM (shadow) from three biological replicates. Quantification plot related to Movies S1 and S2. (D) Aggregation of Capsaspora cells induced by dose responses of FBS in agitation (SI Appendix, Fig. S1B assay) and in the absence of agitation conditions (SI Appendix, Fig. S1D assay). Data are represented as the average aggregate area ± SEM from three independent biological replicates. (E) Aggregation dynamics over time induced by serial dilutions of FBS (v/v) in the absence of agitation conditions in ultralow attachment 96-well plates (SI Appendix, Fig. S1D assay). A 10% (v/v) of 1× PBS was used as a negative control. Data are represented as the average aggregate area (thick line) ± SEM (shadow) from three independent biological replicates in no agitation conditions. Quantification plot related to Movies S3 and S4. (F) Aggregate formation induced by 10% (v/v) of FBS (time 0) in ultralow attachment plates related to Movie S3 (SI Appendix, Fig. S1D assay and SI Appendix, Fig. S3). White arrowheads track early aggregate formation and aggregate fusion events (agglomeration). Time represents hh:mm. (Scale bar, 100 µm.) (G) Aggregation and reaggregation dynamics over time in the absence of physical agitation using 12-well plates (SI Appendix, Fig. S1C assay). Aggregates were induced with a 10% (v/v) of FBS (time 0) and monitored until disaggregation into single cells. After ~19 h, either a 30% (v/v) of FBS was added to induce reaggregation (yellow curve), or a 30% (v/v) of 1× PBS was added as a negative control (blue curve). Data are represented as the average aggregate area (thick line) ± SEM (shadow) from three biological replicates. Quantification plot related to Movie S5. A similar result was observed for reaggregation induced with 10% (v/v) of FBS (SI Appendix, Fig. S4). (H) The combination of <30-kDa and >30-kDa FBS fractions induce aggregation of Capsaspora cells. Cells were induced with 10% (v/v) of whole FBS, 10% (v/v) of <30-kDa FBS fraction, 10% (v/v) of >30-kDa FBS fraction, or a combination of both fractions (5% (v/v) each) in agitation conditions (SI Appendix, Fig. S1B assay). A 10% (v/v) of 1× PBS was used as a negative control. Data are represented as boxplots, showing the median aggregate area (thick black bar) and interquartile ranges from three independent biological replicates. (I) The >30-kDa FBS fraction is sufficient to induce reaggregation of Capsaspora cells. Aggregation was induced with 10% (v/v) of FBS and monitored until disaggregation (~72 h). At this point, disaggregated cells were reinduced with either 10% (v/v) of FBS, 10% (v/v) of <30-kDa FBS fraction, 10% (v/v) of >30-kDa FBS fraction, or a combination of both fractions (5% (v/v) each) in agitation conditions (SI Appendix, Fig. S1B assay). A 10% (v/v) of 1× PBS was used as a negative control. Data are represented as boxplots, showing the median aggregate area (thick black bar) and interquartile ranges from three independent biological replicates.
Fig. 3.
Fig. 3.
The small (<30-kDa) serum active component is calcium ions. (A) Calcium ions in combination with 5% (v/v) >30-kDa FBS fraction induce aggregation in Capsaspora. (B) Treatment with calcium-chelating agent ethylene glycol-bis(β-aminoethyl ether)-N,N,N′,N′-tetraacetic acid (EGTA) impairs aggregation of Capsaspora cells induced with 5% (v/v) FBS. (C) Capsaspora cells induced with 5% (v/v) >30-kDa FBS fraction and chloride salts of various divalent cations aggregate only in the presence of calcium chloride at physiological concentration ranges. Manganese chloride induces weaker aggregation in the presence of 5% (v/v) >30-kDa FBS fraction at high concentrations (0.3 mM). Results in AC are shown as the average aggregate area of three independent experiments ± SEM. All experiments are performed following SI Appendix, Fig. S1D assay. Figure related to SI Appendix, Fig. S5.
Fig. 4.
Fig. 4.
The combination of LDLs and calcium ions induces aggregation in Capsaspora. (A) 5% (v/v) of proteinase-treated >30-kDa FBS fraction shows reduced aggregation activity compared to 5% (v/v) of untreated >30-kDa fraction in combination with 0.2 mM CaCl2. A 10% (v/v) treatment of 1× PBS was used as a negative control. Data are represented as boxplots, showing the median aggregate area (thick black bar) and interquartile ranges from three independent biological replicates. Figure related to SI Appendix, Figs. S6–S8. (B) ApoB100 in combination with 0.3 mM CaCl2 does not fully recapitulate the aggregation activity of 10% (v/v) FBS. Data are represented as boxplots, showing the median aggregate area (thick black bar) and interquartile ranges from two independent biological replicates in agitation conditions (SI Appendix, Fig. S1B assay). A 10% (v/v) of FBS was used as a positive control, and a 10% (v/v) of 1× PBS was used as a negative control. Figure related to SI Appendix, Fig. S9 and Dataset S1. (C) Dose response of whole LDLs (plus 0.2 mM CaCl2) in the absence of agitation conditions (SI Appendix, Fig. S1D assay). Data are represented as the average aggregate area ± SEM from three independent biological replicates. (D) Dose responses of whole FBS and LDL-deficient FBS (both in the presence of 0.2 mM CaCl2) in the absence of agitation (SI Appendix, Fig. S1D assay). LDL-deficient FBS has reduced activity, inducing weak aggregation at 30% (v/v) concentrations, whereas whole FBS induces aggregation at ~1% (v/v). Data are represented as the average aggregate area ± SEM from three independent biological replicates. Figure related to SI Appendix, Fig. S10. (E) Dose response of pfLDLs (plus 0.2 mM CaCl2) in the absence of agitation conditions (SI Appendix, Fig. S1D assay). Data are represented as the average aggregate area ± SEM from three independent biological replicates.
Fig. 5.
Fig. 5.
Dynamic lipoprotein concentration regulates an aggregation response in viable Capsaspora cells. (A) LDLs are depleted over time during the aggregation–disaggregation process. Quantification of LDL content of media supernatants collected from cells induced with 10% (v/v) FBS (0 h) by western blot show progressive disappearance of LDLs in the time leading up to disaggregation (72 to 80 h). Data are represented as the mean density areas relative to 0 h time point ± SD from two independent biological replicates. Figure related to SI Appendix, Figs. S4 A and B and S12. (B) LDLs are localized in intracellular small foci and in patches along filopodia in a Capsaspora aggregate induced with 10% (v/v) of FBS. Shown is a maximum z projection of an aggregate (Upper) stained with phalloidin (magenta) to mark filamentous actin (cell body and filopodia), an anti-LDL antibody to mark LDLs (green), and DRAQ5 to mark nuclei (blue). A merge of phalloidin and anti-LDL staining shows that LDLs localize in the interior of cells and filopodia (white arrows). A representative bright-field (BF) stack image is shown. Lower panels represent two zoom-in maximum z-projection images (white squares) of the aggregate stained as before. (Scale bar in the Upper panel represents 25 µm and 10 µm in all magnified Lower panels.) Figure related to SI Appendix, Fig. S13. (C) Capsaspora cells fixed with increasing concentrations of formaldehyde do not aggregate upon induction with 10% (v/v) of FBS. Data are represented as the average aggregate area ± SEM from three independent biological replicates (SI Appendix, Fig. S1B assay). A 10% (v/v) of 1× PBS was used as a negative control. (D) Capsaspora cells aggregate in the presence of calcium ions and lipoproteins, which trigger an active aggregation response. During the course of aggregation, smaller aggregates fuse together into larger aggregates (agglomeration) while consuming lipoproteins. Depletion of lipoproteins leads aggregates to disassemble into single cells again (disaggregation). Readdition of lipoproteins induces reaggregation of Capsaspora cells.

Similar articles

Cited by

References

    1. Grosberg R. K., Strathmann R. R., The evolution of multicellularity: A minor major transition? Annu. Rev. Ecol. Evol. Syst. 38, 621–654 (2007).
    1. Adl S. M., et al. , Revisions to the classification, nomenclature, and diversity of eukaryotes. J. Eukaryotic Microbiol. 66, 4–119 (2019). - PMC - PubMed
    1. Brown M., Silberman J., “The non-dictyostelid sorocarpic amoebae” in Dictyostelids: Evolution Genomics Cell Biology, M. Romeralo, S. Baldauf, R. Escalante, Eds. (Springer, 2013), pp. 219–242.
    1. Burki F., Roger A. J., Brown M. W., Simpson A. G. B., The new tree of eukaryotes. Trends Ecol. Evol. 35, 43–55 (2020). - PubMed
    1. Sebé-Pedrós A., Degnan B. M., Ruiz-Trillo I., The origin of metazoa: A unicellular perspective. Nat. Rev. Genet 18, 498–512 (2017). - PubMed

Publication types

LinkOut - more resources