

Changes in Visual Long-Term Potentiation Show Preserved Cyclicity in Human Females Taking Combined Oral Contraceptives
- PMID: 37094560
- PMCID: PMC10389802
- DOI: 10.1159/000530805
Changes in Visual Long-Term Potentiation Show Preserved Cyclicity in Human Females Taking Combined Oral Contraceptives
Abstract
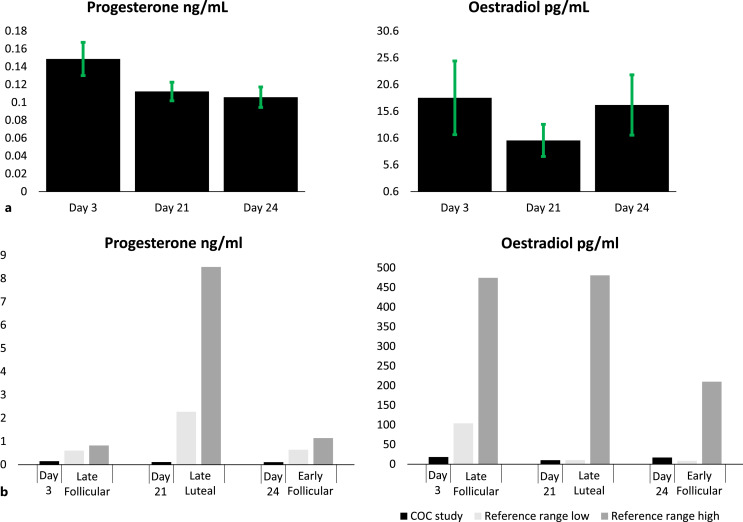
Introduction: The combined oral contraceptive (COC) pill is often employed to address physical and neurological symptoms in menstrual cycle-related disorders by suppressing shifts in endogenous gonadal hormone fluctuations. Symptom persistence, especially in the lead up to the hormone-free interval (HFI), suggests an underlying neurobiological mechanism of preserved cycling. Our study utilised a non-invasive method of visually inducing long-term potentiation (LTP) to index changes in neural plasticity in the absence of hormonal fluctuations.
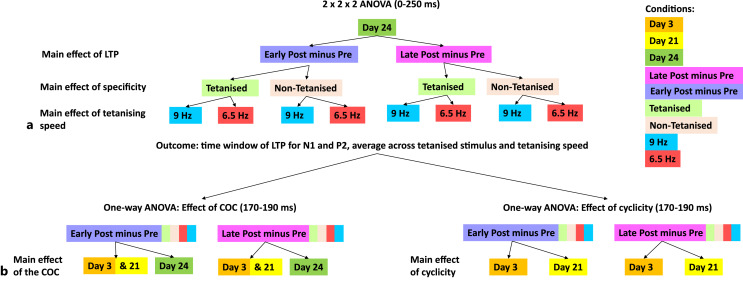
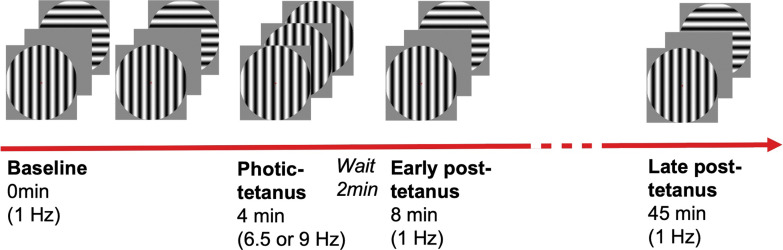
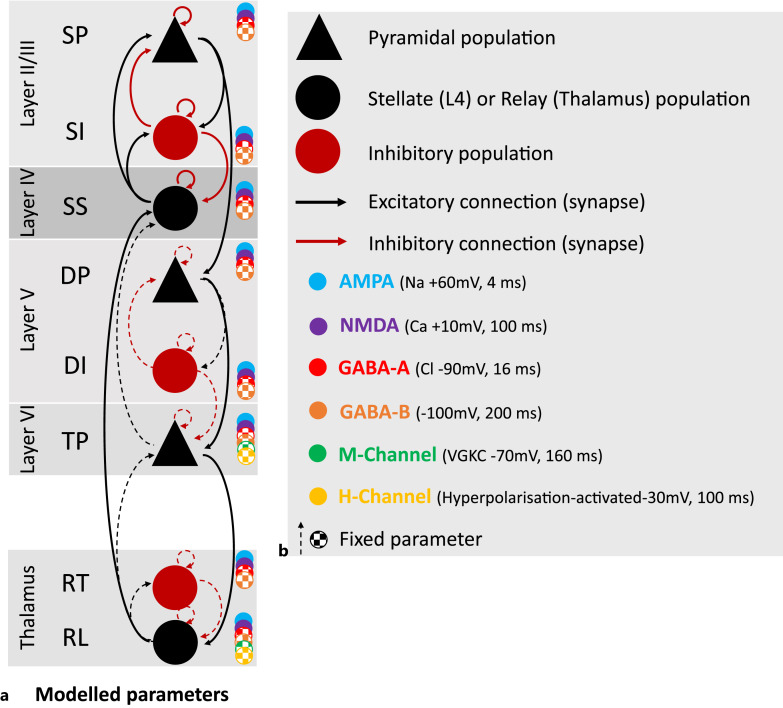
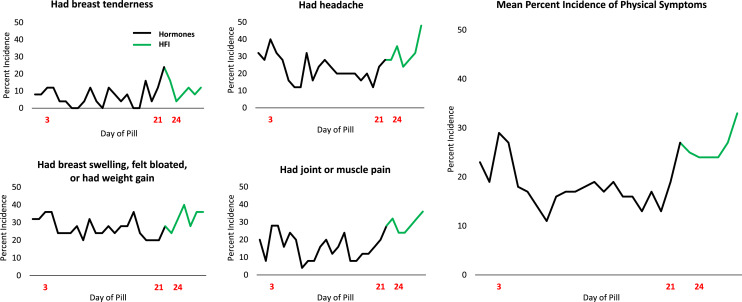
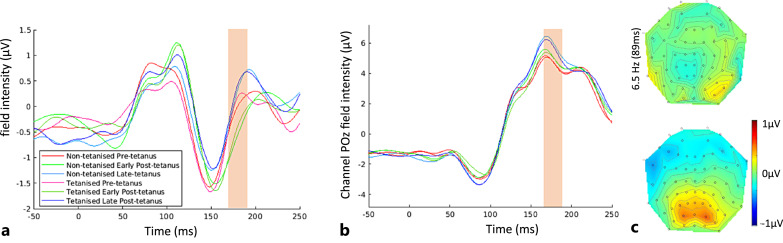
Methods: Visually induced LTP was recorded using electroencephalography in 24 healthy female COC users across three sessions: days 3 and 21 during active hormone pills, and day 24 during the HFI. The Daily Record of the Severity of Problems (DRSP) questionnaire tracked premenstrual symptoms. Dynamic causal modelling (DCM) was used to elucidate the neural connectivity and receptor activity changes associated with LTP across different days of COC.
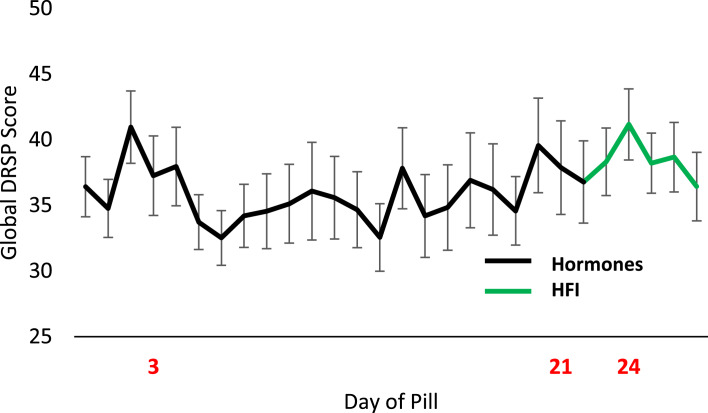
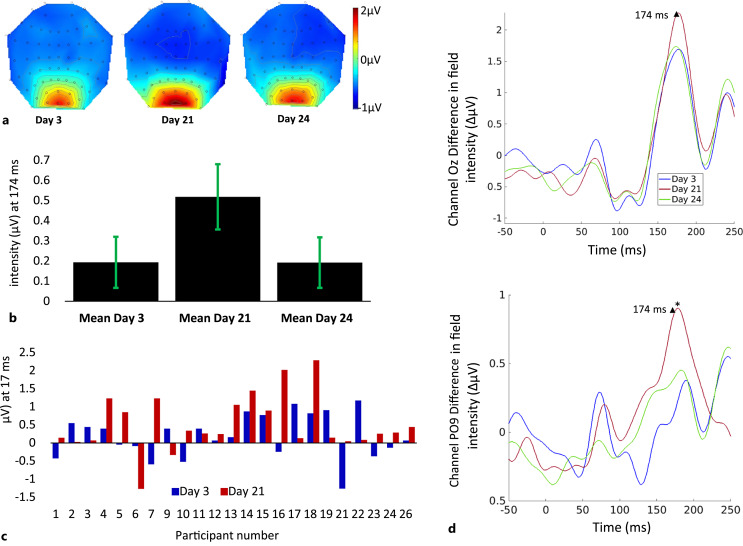
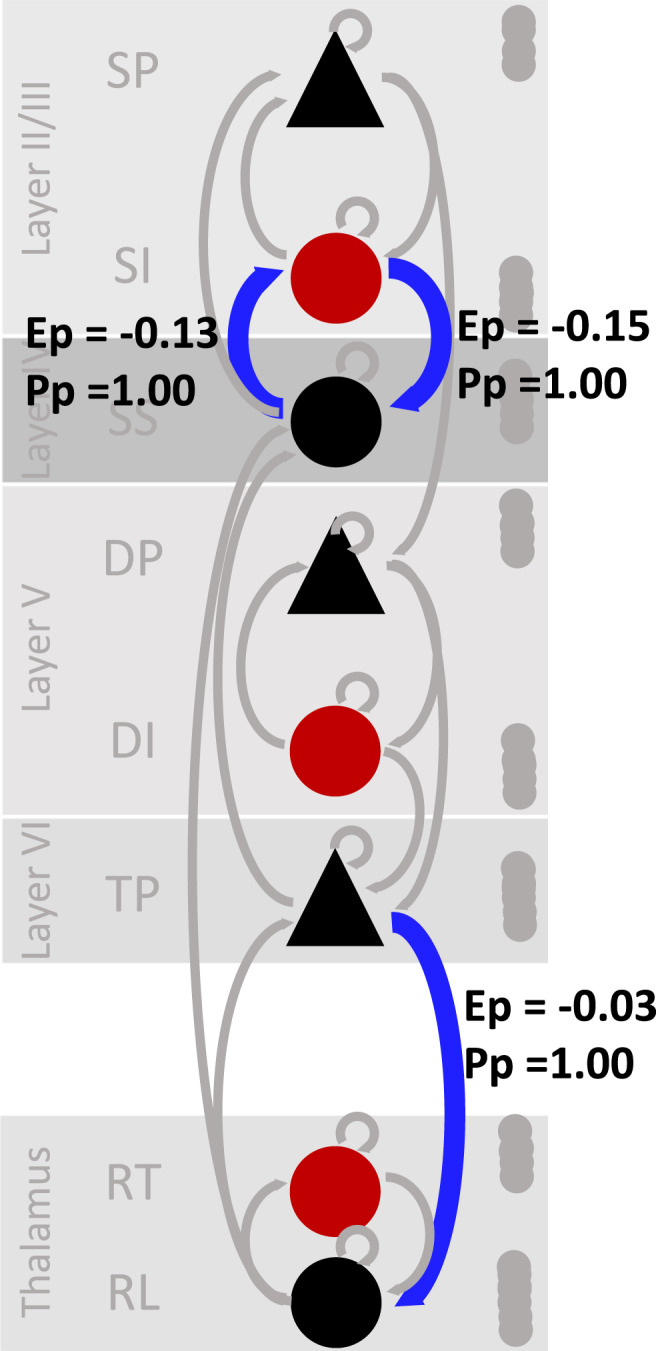
Results: Visually induced LTP was greater on day 21 than day 3 (p = 0.011) and was localised to the P2 visually evoked potential. There was no effect of the HFI (day 24) on LTP. DCM of differences between days 3 and 21 showed changes to inhibitory interneuronal gating of LTP in cortical layer VI. The DRSP only showed a significant increase in symptoms in the HFI, meaning the LTP result appeared more sensitive to cyclicity.
Conclusions: This study provides objective evidence of preserved cyclicity in COC users through enhanced LTP on day 21 compared to day 3 of a 28-day COC regimen, indicating that relatively higher excitation in the brain despite peripheral gonadal suppression may underlie and exacerbate menstrual cycle-related disorders.
Keywords: Combined oral contraceptive pill; Dynamic causal modelling; Electroencephalography; Gonadal hormones; Long-term potentiation.
© 2023 The Author(s). Published by S. Karger AG, Basel.
Conflict of interest statement
The authors have no conflicts of interest to declare.
Figures
Similar articles
-
Neural plasticity is modified over the human menstrual cycle: Combined insight from sensory evoked potential LTP and repetition suppression.Neurobiol Learn Mem. 2018 Nov;155:422-434. doi: 10.1016/j.nlm.2018.08.016. Epub 2018 Aug 30. Neurobiol Learn Mem. 2018. PMID: 30172951
-
The role of Hebbian learning in human perception: a methodological and theoretical review of the human Visual Long-Term Potentiation paradigm.Neurosci Biobehav Rev. 2020 Aug;115:220-237. doi: 10.1016/j.neubiorev.2020.03.013. Epub 2020 Jun 18. Neurosci Biobehav Rev. 2020. PMID: 32562886 Review.
-
Ketamine Enhances Visual Sensory Evoked Potential Long-term Potentiation in Patients With Major Depressive Disorder.Biol Psychiatry Cogn Neurosci Neuroimaging. 2020 Jan;5(1):45-55. doi: 10.1016/j.bpsc.2019.07.002. Epub 2019 Jul 23. Biol Psychiatry Cogn Neurosci Neuroimaging. 2020. PMID: 31495712 Clinical Trial.
-
Ovulatory effects of three oral contraceptive regimens: a randomized, open-label, descriptive trial.Contraception. 2015 Jun;91(6):495-502. doi: 10.1016/j.contraception.2015.03.001. Epub 2015 Mar 6. Contraception. 2015. PMID: 25746294 Clinical Trial.
-
A primer on the hormone-free interval for combined oral contraceptives.Curr Med Res Opin. 2015;31(10):1941-8. doi: 10.1185/03007995.2015.1082989. Curr Med Res Opin. 2015. PMID: 26390802 Review.
Cited by
-
Modulation of long-term potentiation following microdoses of LSD captured by thalamo-cortical modelling in a randomised, controlled trial.BMC Neurosci. 2024 Feb 5;25(1):7. doi: 10.1186/s12868-024-00844-5. BMC Neurosci. 2024. PMID: 38317077 Free PMC article. Clinical Trial.
