. 2023 May 8;10(5):ENEURO.0488-22.2023.
doi: 10.1523/ENEURO.0488-22.2023. Print 2023 May.

Correlated Somatosensory Input in Parvalbumin/Pyramidal Cells in Mouse Motor Cortex

Affiliations

Correlated Somatosensory Input in Parvalbumin/Pyramidal Cells in Mouse Motor Cortex

Roman U Goz et al. eNeuro. .

Abstract

In mammalian cortex, feedforward excitatory connections recruit feedforward inhibition. This is often carried by parvalbumin (PV+) interneurons, which may densely connect to local pyramidal (Pyr) neurons. Whether this inhibition affects all local excitatory cells indiscriminately or is targeted to specific subnetworks is unknown. Here, we test how feedforward inhibition is recruited by using two-channel circuit mapping to excite cortical and thalamic inputs to PV+ interneurons and Pyr neurons to mouse primary vibrissal motor cortex (M1). Single Pyr and PV+ neurons receive input from both cortex and thalamus. Connected pairs of PV+ interneurons and excitatory Pyr neurons receive correlated cortical and thalamic inputs. While PV+ interneurons are more likely to form local connections to Pyr neurons, Pyr neurons are much more likely to form reciprocal connections with PV+ interneurons that inhibit them. This suggests that Pyr and PV ensembles may be organized based on their local and long-range connections, an organization that supports the idea of local subnetworks for signal transduction and processing. Excitatory inputs to M1 can thus target inhibitory networks in a specific pattern which permits recruitment of feedforward inhibition to specific subnetworks within the cortical column.

Keywords: circuit mapping; long-range projections; motor cortex; optogenetic; parvalbumin interneurons; subnetworks.


Conflict of interest statement

The authors declare no competing financial interests.

Figures

Figure 1.
Figure 1.
Long-range thalamic and cortical projections in mouse brain slices. A, Targeted regions (left panel). Illustration of the slice preparation (right panel). Vibrissal M1 (vM1) receiving long-range projection inputs from vS1 (green lines, ReaChR-mcitrine expressing), and from posterior thalamus (red lines, ChR2-mcherry expressing). Paired whole-cell patch-clamp recording targeted to a pyramidal excitatory neuron (Pyr, empty triangular shaped) and parvalbumin positive inhibitory interneuron (PV+, oval shaped, red) receiving inputs from vS1 (stimulated with orange LED, 590 nm), and from posterior thalamus (stimulated with blue LED, 470 nm). B, Illustration of stimulation paradigm in brain slices. ReaChR expressing axons (vS1, green) were stimulated first with 590 nm, orange LED (50–500 ms) immediately followed by stimulation of ChR2 containing axons (PO) with 470-nm blue LED 50 ms with equal light intensity (∼2 mW/mm2). Example traces are shown in J–K containing axons (PO) with 470-nm blue LED 50 ms with equal light intensity (∼2 mW/mm2). Example traces are shown in J–K. C, Illustration of the scientific inquiry question and color coding. D, Example reconstruction of a recorded biocytin filled PV+ cell. Scale bar above. E, Example current-clamp traces showing responses of a PV+ inhibitory fast-spiking cell recorded in those experiments with current steps in between and the scale bar to the right. For electrophysiological properties, please see Extended Data Figure 1-1. Extended Data Table 1-1. F, Example traces of a connectivity test between a PV+ cell in current-clamp mode with 3 nA 0.5-ms current step to elicit single AP and the voltage-clamp IPSC response of the Pyr cell held at 0 mV. G, Example reconstructed biocytin filled Pyr cell. Scale bar above. H, Example current-clamp recording of Pyr cell with current steps as labeled. Scale bar to the right. I, Example of connectivity test, with the same protocol as in E, Pyr in current-clamp, EPSC in PV+ cell held at −70 mV. J, K, Examples of two connected PV+ and Pyr cells in voltage-clamp showing responses to LED stimulation. First column 590-nm and 470-nm LED stimulation (colored bars indicate time of LED on/off). Middle traces are 500-ms 590-nm alone. Third column is a subtraction of middle traces from the first column to reveal 470-nm response.
Figure 2.
Figure 2.
2CRACM EPSCs kinetics. A, Example response traces of PV+ (red) and Pyr (black) to 590 nm (vS1, orange) LED stimulation, following by 470 nm (PO, blue) LED stimulation. Description of kinetics that were measured and compared, as indicated by arrows in the panel. Onset was measured from start of the stimulation to 10% of the EPSC peak, the rise time was measured from 10% to 90% of the EPSC peak; and the decay time was measured from 90% to 50% of the EPSC peak. Peaks are shown by pink arrowheads. Because vS1 responses onset before PO responses, onset and rise kinetics are averaged across all delay protocols. For the uniformity purposes only, 100-ms and 250-ms delay protocols kinetics are shown to constrain to the data analyzed and presented in other figures. B, vS1 EPSC onset averaged across all delay protocols (5–500 ms; PV+ n = 123–125; Pyr n = 114–115). C, PO EPSC onset (PV+ n = 84–108; Pyr n = 85–109). D, vS1 EPSC averaged rise time (PV+ n = 123–125; Pyr n = 114–115). E, PO EPSC rise time (PV+ n = 84–108; Pyr n = 85–109). F, vS1 EPSC normalized to its own peak at 250-ms delay protocol response (PV+ n = 123–125; Pyr n = 114–115). G, PO EPSC normalized to its own peak at 250-ms delay protocol response (PV+ n = 89–110; Pyr n = 118). H, vS1 EPSC decay time (PV+ n = 59–110; Pyr n = 47–102). I, PO EPSC decay time (PV+ n = 76–98; Pyr n = 81–100). Means are shown with 95% confidence intervals.
Figure 3.
Figure 3.
vS1 input is larger than PO input to vM1 layer 2/3 PV+ interneurons. A, Illustration of the vM1 slice preparation receiving long-range projections inputs from vS1 (green lines, ReaChR-mcitrine) and from PO (red lines, ChR2-mcherry) during paired recording. B, Example voltage-clamp traces in cells held at −70 mV from a pair of PV+ inhibitory interneuron and Pyr excitatory neuron showing responses to 590-nm LED stimulation of vS1 axons in vM1 immediately followed by 470-nm LED stimulation of PO axons. Middle panel is the response to 590-nm LED stimulation alone and the last panel is a subtraction of the middle traces from the first traces to isolate 470 nm-induced EPSCs. C, Example of an off-coronal 300-μm brain slice of vM1 with two cells in patch-clamp. Left panel shows the location of the cells relative to pia and white matter. Approximate layer boundaries indicated. Middle panel shows vS1 axonal fluorescence in green (arrowhead). Right panel is a confocal image showing PO axonal fluorescence in red (arrowheads) in L1 and the lower L2/3 and L5A together with PV+ interneurons. A biocytin filled example pair (green) of cells is shown. Scale bars are 500 μm. D, Cumulative distribution of EPSC amplitudes comparing vS1 and PO inputs to PV+ (left) and Pyr (right) neurons in layers 2/3 (top) and 5A (bottom). EPSCs in L2/3 PV+ neurons were significantly larger from vS1 than PO (Wilcoxon signed-rank test = 2131, p = 5E-6, effect size η2 = Z2/(n−1), η2 = 0.296). Differences between vS1 and PO EPSCs in L2/3 Pyr neurons were significant (Wilcoxon signed-rank test = 620, p = 1.63E-4, effect size, η2 = 0.203; however, the effect size Hedges’ g and confidence interval show no statistical significance, Extended Data Table 1-2; Hedges’ g = 0.367, p = 0.1 [95.0%CI −0.0344, 0.728]). PV+ and Pyr EPSCs amplitudes in L5A between VS1 and PO were significantly different (PV+: Wilcoxon signed-rank test = 1, p = 1E-6, η2 = 0.78, however the effect size Hedges’ g and confidence interval show no statistical significance, Extended Data Table 1-2; Hedges’ g = 0.177, p = 0.59, [95.0%CI −0.482, 0.888]; Pyr: Wilcoxon signed-rank test = 28, p = 1.8E-4, η2 = 0.56, Hedges’ g = 0.389, p = 0.228, [95.0%CI −0.149, 0.823]). E, Cumulative distribution of EPSC amplitudes comparing input to Pyr and PV+ neurons from PO (left) and vS1 (right) to neurons in layers 2/3 [top, Mann–Whitney (M–W) U = 4242 and 3087 (PO), p = 3E-6, η2 = 0.143 and 3.2E-2 (PO), η2 = 0.032] and 5A (bottom, M–W U = 663 and 589 (PO), p = 8.17E-3, η2 = 0.115, and 2.88E-3 (PO), η2 = 0.159; however, the effect size for vS1 L5A, Hedges’ g and confidence interval, show no statistical significance, Extended Data Table 1-2; Hedges’ g = 0.31, p = 0.22, [95.0%CI −0.338, 0.767]). F, Cumulative distribution of EPSC amplitudes comparing L2/3 and L5A inputs to PV+ (top) and Pyr (bottom) from PO (left) and vS1 (right) was not significantly (ns) different (PO L2/3 to L5A PV+: M–W U = 863, p = 6.9E-2, η2 = 0.032; L2/3 to L5A Pyr: M–W U = 949, p = 8.3E-1, η2 = 0.0005; VS1 L2/3 to L5A PV+: M–W U = 1531, p = 4.1E-1, η2 = 0.006; L2/3 to L5A Pyr: M–W U = 1329, p = 1.1E-1, η2 = 0.024). G, Ratio of vS1 and PO EPSCs amplitudes in PV+ interneurons divided by the EPSCs amplitudes in Pyr neurons (from D–F) shows that vS1 preferentially targets PV+ neurons compared with PO confirming the results of previous study with subcellular CRACM (Okoro et al., 2022). Only pairs with both inputs included. L2/3 vS1 and PO pairs, n = 30; L5A, n = 12. Wilcoxon signed-rank test (L2/3 ratio of VS1 vs PO Wilcoxon signed-rank test = 112, p = 1.3E-2, η2 = 0.212, L5A ratio of VS1 vs PO Wilcoxon signed-rank test = 22, p = 1.82E-1, η2 = 0.162) was used since the synaptic responses are not normally distributed Kolmogorov–Smirnov and Shapiro–Wilk tests for normality [L2/3 PO inputs (PV+/Pyr) K-S(12) = 0.312, p = 2.02E-3, S-W(12) = 0.7, p = 8.35E-4; L5A vS1 inputs (PV+/Pyr), K-S(12) = 0.34, p = 4.15E-4, S-W(12) = 0.718, p = 1.26E-3]. Means are shown by circles and the medians by squares. Whiskers represent 95% confidence intervals.
Figure 4.
Figure 4.
Characterization of connectivity between PV+ and Pyr neurons. A, Example of biocytin filled 3 cells (green) and current-clamp traces show characteristic PV+ (red) and Pyr neurons subthreshold responses and suprathreshold AP firing in response to depolarizing current steps (PV+ red, Pyr gray) with ChR2 positive axons (cyan). One PV+ filled with biocytin is shown in yellow, because of overlap of tdtomato labeling. B, Example of connection test traces for reciprocally connected (top), connected in one-way from PV+ to Pyr (second row), connected in one-way from Pyr to PV+ (3rd row), and nonconnected (fourth row). C, Percentage of connected pairs (Fisher’s exact test 20.81, p = 1.6E-5; Extended Data Table 4-1). D, Normalized distance to pia, the distance from pia to white matter is 100%, means (circles) and medians (squares) are to the left with whiskers showing ±95% confidence intervals. Because of nonhomogenous variance, Levene’s test p < 0.001, Welch test used for comparison of the means did not show any significant difference, F(2,104.52) = 1.05, p = 0.36 with Games–Howell post hoc ns., between the reciprocally connected pairs (pink), unidirectionally connected pairs (powder blue) and nonconnected pairs (infant blue). E, Euclidian distance between all the cell pairs were recorded within 120 μm of each other and show no difference, although the tendency of connected pairs having a smaller Euclidian intersomatic distance is showing (average Euclidian distance between reciprocally connected pairs = 23.65 μm, median = 21.29 μm, n = 18; between unidirectionally connected pairs avg = 26.96 μm, median = 24.22 μm, n = 58; between nonconnected pairs avg = 31.11 μm, median = 27.6 μm, n = 119, one-way ANOVA F = 2.52, p = 0.08 ns.; Extended Data Table 4-1). Scale bar for A is 50 μm.
Figure 5.
Figure 5.
Normalized vS1 and PO inputs to connected and not pairs of PV+ and Pyr neurons show different trends. All inputs are from the 100-ms delay protocol normalized to the maximum slice peak at 250-ms delay protocol. A, C, E, vS1 (orange) inputs for connected PV+ (red) and Pyr (black) pairs. A, Original figure. C is A bubble plotted to PO (blue) inputs to PV+ neurons in the same pairs. E is A bubble plotted to PO inputs to Pyr in the same pairs. B, D, F, vS1 inputs for nonconnected PV+ (magenta) and Pyr (gray) pairs. B, Original figure. D is B bubble plotted to PO inputs to PV+ neurons in the same pairs. F is B bubble plotted to PO inputs to Pyr in the same pairs. G, I, K, PO inputs for connected PV+ and Pyr pairs. G, Original figure. I is G bubble plotted to vS1 inputs to PV+ neurons in the same pairs. K is G bubble plotted to vS1 inputs to Pyr neurons in the same pairs. H, J, L, PO inputs for nonconnected PV+ and Pyr pairs. H, Original figure. J is H bubble plotted to vS1 inputs to PV+ neurons in the same pairs. L is H bubble plotted to vS1 inputs to Pyr neurons in the same pairs. Bubble plots scale is from 0.1 to 1.6 with Δ of 0.5. M, Schematics of scientific inquiry question, methods to study it, bubble plots color coding and size for vS1 inputs. N, Schematics of scientific inquiry question, methods to study it, bubble plots color coding and size for PO inputs. O is A and B shown as a box plots. P is G and H shown as a box plots. Means are shown by circles, medians by squares and whiskers represent 95% confidence intervals.
Figure 6.
Figure 6.
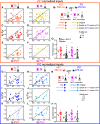
Increased correlation of the long-range inputs to connected pairs. A, Example of voltage-clamp traces from PV+ (red) and Pyr pair with 590-nm stimulation of vS1 axons and 470-nm stimulation of PO (blue) axons middle traces are 590-nm stimulation alone and the right traces show the result of subtraction of middle traces from the first traces. Connected pairs are B–E. B, Scatter plot of vS1 in connected pairs showing a higher correlation compared with nonconnected pairs in F, also see Extended Data Figures 6-2 and 6-3 for layer-specific information. The data in B and F were resampled using 1000 samples bootstrap and produced Spearman’s ρ correlation coefficients, which were squared and compared with nonparametric independent samples Mann–Whitney test, U = 208,790.0, p < 1E-10 (Extended Data Fig. 6-1). The estimation of confidence interval for the Spearman’s ρ correlation coefficient was also done with 10,000 Bootstrap resampling, [95.0%CI 0.324, 0.760; Ho et al. (2019)]. C, Scatter plot of PO EPSCs in connected pairs showing a higher correlation compared with nonconnected pairs in G. The data in C and G were resampled using 1000 samples bootstrap and produced Spearman’s ρ correlation coefficients, which were squared and compared with nonparametric independent samples Mann–Whitney test, U = 279,207.0, p < 1E-10 (Extended Data Fig. 6-1). The estimation of confidence interval for the Spearman’s ρ correlation coefficient was also done with 10,000 bootstrap resampling, [95.0%CI 0.163, 0.759]. D, Scatter plot of PO and vS1 EPSCs in the PV+ interneurons from the connected pairs. E, Scatter plot of PO and vS1 EPSCs in the Pyr neurons from connected pairs. Nonconnected pairs are F–I. F, Scatter plot of vS1 EPSCs from nonconnected pairs (yellow), 10,000 bootstrap resampling, [95.0%CI 0.097, 0.623]. G, Scatter plot of PO (teal) EPSCs in nonconnected pairs, 10,000 bootstrap resampling, [95.0%CI 0.165, 0.658]. H, Scatter plot of PO and vS1 EPSCs in the PV+ (magenta) interneurons from the nonconnected pairs. I, Scatter plot of PO and vS1 EPSCs in the Pyr neurons from the nonconnected pairs. Correlations are estimated by the Spearman’s ρ correlation coefficient.
Figure 7.
Figure 7.
Long-range inputs excite more PV+ interneurons eliciting stronger feedforward inhibition in layer-specific manner. A, Example traces showing a pair of PV+ and Pyr neurons recorded at −70 mV and at 0 mV (teal) holding potential. B, Scatter plot of EPSCs and IPSCs for vS1 inputs (left panel), and PO (right panel) for PV+ (upper panel) and Pyr (lower panel). Cortical layers 2/3 data for PV+ (red, 10,000 bootstrap confidence interval for Spearman’s ρ for VS1 inputs [95.0%CI −0.143, 0.770]; for PO inputs [95.0%CI 0.155, 0.824]) and L5A (pink, for VS1 inputs [95.0%CI 0.176, 0.918]; for PO inputs [95.0%CI −0.134, 0.839]) for Pyr the L2/3 data are in black (for VS1 inputs [95.0%CI 0.359, 0.913]; for PO inputs [95.0%CI 0.109, 0.847]) and L5A is in green (for VS1 inputs [95.0%CI 0.556, 1]; for PO inputs [95.0%CI 0.166, 0.832]). C, vS1 and PO EPSCs (e’s) at −70 mV holding potential multiplied by −1 for the convenience of presentation, and IPSCs (I’s) at 0 mV holding potential; EPSCs in L2/3 PV+ neurons were significantly larger from vS1 than PO (Wilcoxon signed-rank test = 2131, p = 5E-6, effect size η2 = Z2/(n−1), η2 = 0.296; Fig. 3D). vS1 Is were significantly larger in L2/3 than L5A Pyr [independent samples Mann–Whitney (M–W) U = 39, p = 3.08E-2, η2 = 0.180]. D, Averaged layer-specific excitation-to-inhibition ratio where the amplitude of EPSCs at −70 mV is divided by the amplitude of IPSCs at 0 mV for each cell. E/I ratio for vS1 inputs was significantly larger in PV+ than in Pyr in L2/3 but not for PO inputs [M–W U = 52 and 186.5 (PO), p = 2.2E-5 and 9.37E-2 (PO), η2 = 0.409 and η2 = 0.062 (PO)]; vS1 inputs E/I ratio was significantly larger in L5A than L2/3 Pyr (M–W U = 182, p = 4.89E-3, η2 = 0.254); vS1 and PO inputs E/I ratio was significantly larger in L5A PV+ than Pyr [M–W U = 49 and 41.5 (PO), p = 1.83E-2 and 4.0E-4 (PO), η2 = 0.197 and η2 = 0.344 (PO)]. Correlation is estimated by the Spearman’s ρ correlation coefficient.
Figure 8.
Figure 8.
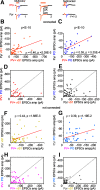
Correlation of long-range excitatory and feedforward inhibitory inputs is weaker in nonconnected Pyr cells. A, Scatter plots of vS1 (orange), and (B) PO (blue) inputs EPSCs (x-axis) and IPSCs (y-axis) for connected (left panels) PV+ (red) and Pyr (black) and nonconnected (right panels, magenta for PV+ and gray for Pyr). The estimation of confidence interval for the Spearman’s ρ correlation coefficient was also done with 10,000 bootstrap resampling, for VS1 inputs to PV+ connected (A, upper left), [95.0%CI 0.033, 0.888]; for VS1 inputs to PV+ not connected (A, upper right), [95.0%CI 0.090, 0.962]; for VS1 inputs to Pyr connected (A, lower left), [95.0%CI 0.394, 0.978]; for VS1 inputs to Pyr not connected (A, lower right), [95.0%CI −0.377, 0.942]; for PO inputs to PV+ connected (B, upper left), [95.0%CI −0.062, 0.904]; for PO inputs to PV+ not connected (B, upper right), [95.0%CI 0.465, 0.917]; for PO inputs to Pyr connected (B, lower left), [95.0%CI 0.093, 0.947]; for PO inputs to Pyr not connected (B, lower right), [95.0%CI −0.405, 0.640].

Similar articles

Cited by

References

    1. Ali AB, Bannister AP, Thomson AM (1999) IPSPs elicited in CA1 pyramidal cells by putative basket cells in slices of adult rat hippocampus. Eur J Neurosci 11:1741–1753. 10.1046/j.1460-9568.1999.00592.x - DOI - PubMed
    1. Alonso JM, Martinez LM (1998) Functional connectivity between simple cells and complex cells in cat striate cortex. Nat Neurosci 1:395–403. 10.1038/1609 - DOI - PubMed
    1. Alonso JM, Usrey WM, Reid RC (2001) Rules of connectivity between geniculate cells and simple cells in cat primary visual cortex. J Neurosci 21:4002–4015. 10.1523/JNEUROSCI.21-11-04002.2001 - DOI - PMC - PubMed
    1. Aruljothi K, Marrero K, Zhang Z, Zareian B, Zagha E (2020) Functional localization of an attenuating filter within cortex for a selective detection task in mice. J Neurosci 40:5443–5454. 10.1523/JNEUROSCI.2993-19.2020 - DOI - PMC - PubMed
    1. Audette NJ, Urban-Ciecko J, Matsushita M, Barth AL (2018) POm thalamocortical input drives layer-specific microcircuits in somatosensory cortex. Cereb Cortex 28:1312–1328. 10.1093/cercor/bhx044 - DOI - PMC - PubMed

Publication types

LinkOut - more resources