. 2023 Apr 24;14(1):2339.
doi: 10.1038/s41467-023-37875-1.

Metabolomic differentiation of benign vs malignant pulmonary nodules with high specificity via high-resolution mass spectrometry analysis of patient sera

Affiliations

Metabolomic differentiation of benign vs malignant pulmonary nodules with high specificity via high-resolution mass spectrometry analysis of patient sera

Yao Yao et al. Nat Commun. .

Abstract

Differential diagnosis of pulmonary nodules detected by computed tomography (CT) remains a challenge in clinical practice. Here, we characterize the global metabolomes of 480 serum samples including healthy controls, benign pulmonary nodules, and stage I lung adenocarcinoma. The adenocarcinoma demonstrates a distinct metabolomic signature, whereas benign nodules and healthy controls share major similarities in metabolomic profiles. A panel of 27 metabolites is identified in the discovery cohort (n = 306) to distinguish between benign and malignant nodules. The discriminant model achieves an AUC of 0.915 and 0.945 in the internal validation (n = 104) and external validation cohort (n = 111), respectively. Pathway analysis reveals elevation in glycolytic metabolites associated with decreased tryptophan in serum of lung adenocarcinoma vs benign nodules and healthy controls, and demonstrates that uptake of tryptophan promotes glycolysis in lung cancer cells. Our study highlights the value of the serum metabolite biomarkers in risk assessment of pulmonary nodules detected by CT screening.


Conflict of interest statement

The authors declare no competing interests.

Figures

Fig. 1
Fig. 1. Significant perturbation in the serum metabolome of lung adenocarcinoma compared with healthy controls and benign nodules.
a The study population of serum global metabolomic analysis by ultra-performance liquid chromatography-high resolution mass spectrometry (UPLC-HRMS) in the discovery cohort. b The partial least squares discrimination analysis (PLS-DA) of the global metabolomes of 480 serum samples in the discovery cohort including heathy controls (HC, n = 174), benign nodules (BN, n = 170), and stage I lung adenocarcinoma (LA, n = 136). +ESI, positive electrospray ionization mode; −ESI, negative electrospray ionization mode. c–e Significant differentially abundant metabolites between two given groups (Two-sided Wilcoxon rank tests with the p value adjusted by false discovery rate, FDR < 0.05) are shown in red (fold change > 1.2) and blue (fold change < 0.83) in the volcano plot. f A hierarchical clustering heat map showing significantly differential abundance of annotated metabolites between LA and BN. Source data are provided as a Source Data file.
Fig. 2
Fig. 2. Construction and validation of the serum metabolic classifier for discriminating between benign and malignant pulmonary nodules.
a The establishment workflow of the pulmonary nodule classifier, including selection of an optimal serum metabolite panel in the discover set by tenfold cross validation using binary logistic regression model, and evaluation of the prediction performance in the internal and external validation sets. b Cross-validation statistics of LASSO-regression model for selection of metabolic biomarkers. Numbers above indicate the average number of selected biomarkers under a given λ. The red dotted line indicates the mean values of AUC under the corresponding λ. The gray error band indicates the minimum and maximum values of AUC. The dashed line points to the optimal model with 27 selected biomarkers. AUC, area under the receiver operating characteristic (ROC) curve. c Fold change of 27 selected metabolites in LA group compared with BN group in the discovery set. Red columns, upregulated. Blue columns, downregulated. d–f The receiver operating characteristic (ROC) curves showing the efficacy of the discriminant model based on the combination of 27 metabolites in the discovery, internal and external validation sets. Source data are provided as a Source Data file.
Fig. 3
Fig. 3. Prediction efficacy of the serum metabolic classifier for nodules in the same size range.
a–d Comparison of PCA profiles between indicated groups based on the metabolic classifier of 27 metabolites. a HC vs BN < 6 mm. b BN < 6 mm vs BN 6–20 mm. c LA 6–20 mm vs LA 20–30 mm. d BN 6–20 mm vs LA 6–20 mm. HC, n = 174; BN < 6 mm, n = 153; BN 6–20 mm, n = 91; LA 6–20 mm, n = 89; LA 20–30 mm, n = 77. e The receiver operating characteristic (ROC) curve showing the efficacy of the discriminant model for nodules 6–20 mm. f The probability value calculated from logistic regression model for nodules 6–20 mm. The gray dashed line represents the optimal cut-off value (0.455). Numbers above indicating percentage of cases predicted as LA. Two-sided Student’s t test was used. PCA, Principal component analysis. AUC area under the curve. Source data are provided as a Source Data file.
Fig. 4
Fig. 4. Clinical evaluation of four representative samples diagnosed by the serum metabolic classifier.
a CT images on axial lung window views of two cases from benign nodules. Case 1 showing a 7 mm stable solid nodule with calcification in the right lower lobe of follow-up CT over 4 years. Case 2 showing a 7 mm stable part-solid nodule in the right upper lobe of follow-up CT over 5 years. b CT images on axial lung window views before lung resection surgery and the matched pathological examination of two cases of stage I adenocarcinoma. Case 3 showing an 8 mm nodule with pleural retraction int the right upper lobe. Case 4 showing a 9 mm part-solid ground glass nodule in the left upper lobe. Haematoxyline and Eosin (H&E) staining of lung tissue from resection surgery (scale bar = 50 μm) showing acinar growth pattern of lung adenocarcinoma. Arrows indicate nodules detected on CT images. The H&E images are representative views of multiple (>3) microscopic fields examined by the pathologist.
Fig. 5
Fig. 5. Correlation between tryptophan metabolism and glycolytic activity in lung adenocarcinoma.
a KEGG pathway enrichment analysis of significantly differential metabolites in LA group compared with BN and HC. Two-sided Globaltest was used and p values was adjusted by Holm-Bonferroni method (adj. p ≤ 0.001 and impact > 0.01). b–d The violin plots showing levels of hypoxanthine, xanthine, lactate, pyruvate, and tryptophan in the serum of HC, BN, and LA determined by LC-MS/MS (n = 70 in each group). The white and black dashed lines indicate the medians and quartiles, respectively. e The violin plots showing normalized Log2TPM (transcript per million) mRNA expression of SLC7A5 and QPRT in lung adenocarcinoma (n = 513) vs normal lung tissues (n = 59) in the LUAD-TCGA dataset. The white box represents the interquartile range, the horizontal black line in the center indicates the median and the vertical black line extended from the box indicates 95% confidence intervals (CI). f The Pearson’s correlation plot of SLC7A5 with GAPDH expression in lung adenocarcinoma (n = 513) and normal lung tissues (n = 59) from TCGA dataset. The gray area represents 95% CI. r, Pearson’s correlation coefficient. g Normalized cellular levels of tryptophan in A549 cells transfected with shRNA-nonspecific control (NC) and shSLC7A5 (Sh1, Sh2) were determined by LC-MS/MS. Statistical analysis is shown with five biologically independent samples in each group. h Cellular levels of NADt (NAD total including NAD+ and NADH) in A549 cells (NC) and A549 cells with knockdown of SLC7A5 (Sh1, Sh2). Statistical analysis is shown with three biologically independent samples in each group. i Glycolytic activity of A549 cells before and after knockdown of SLC7A5 was measured by the extracellular acidification rate (ECAR) (n = 4 biologically independent samples in each group). 2-DG, 2-deoxy-D-glucose. Two-sided Student’s t test was used in (bh). In (gi), error bars represent means ± S.D and each experiment was performed three times independently with similar results. Source data are provided as a Source Data file.
Fig. 6
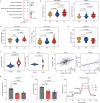
Fig. 6. Proposed strategy of pulmonary nodule classification combined with CT screening.
Pulmonary nodules are evaluated by low-dose computed tomography (LDCT) with imaging features suggestive of benign or malignant causes. The outcome of indeterminate nodules may lead to frequent follow-ups, unnecessary interventions and overtreatment. Incorporating a serum metabolic classifier with diagnostic value potentially enhances the risk assessment and improves the subsequent management of pulmonary nodules. PET positron emission tomography.

References

    1. National Lung Screening Trial Research Team, et al. Reduced lung-cancer mortality with low-dose computed tomographic screening. N. Engl. J. Med.365, 395–409 (2011). - PMC - PubMed
    1. Kramer BS, Berg CD, Aberle DR, Prorok PC. Lung cancer screening with low-dose helical CT: results from the National Lung Screening Trial (NLST) J. Med. Screen. 2011;18:109–111. doi: 10.1258/jms.2011.011055. - DOI - PMC - PubMed
    1. de Koning HJ, et al. Reduced Lung-Cancer Mortality with Volume CT Screening in a Randomized Trial. N. Engl. J. Med. 2020;382:503–513. doi: 10.1056/NEJMoa1911793. - DOI - PubMed
    1. Loverdos K, Fotiadis A, Kontogianni C, Iliopoulou M, Gaga M. Lung nodules: A comprehensive review on current approach and management. Ann. Thorac. Med. 2019;14:226–238. doi: 10.4103/atm.ATM_110_19. - DOI - PMC - PubMed
    1. Hansell DM, et al. Fleischner Society: glossary of terms for thoracic imaging. Radiology. 2008;246:697–722. doi: 10.1148/radiol.2462070712. - DOI - PubMed

Publication types