. 2023 Apr 24;14(1):2353.
doi: 10.1038/s41467-023-38064-w.

HAPLN1 potentiates peritoneal metastasis in pancreatic cancer

Affiliations

HAPLN1 potentiates peritoneal metastasis in pancreatic cancer

Lena Wiedmann et al. Nat Commun. .

Abstract

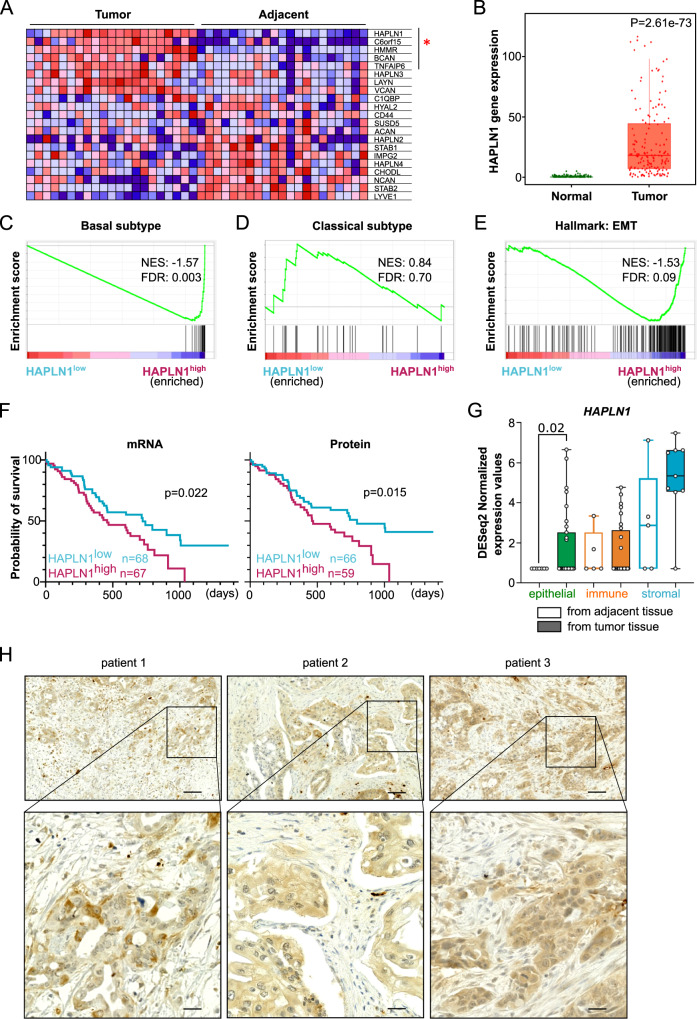
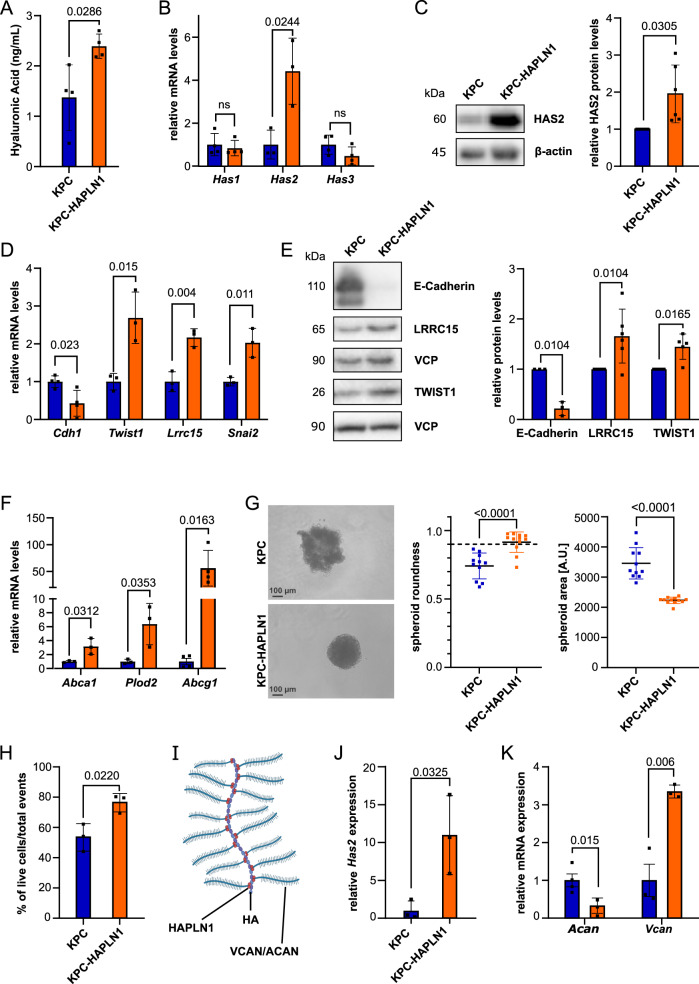
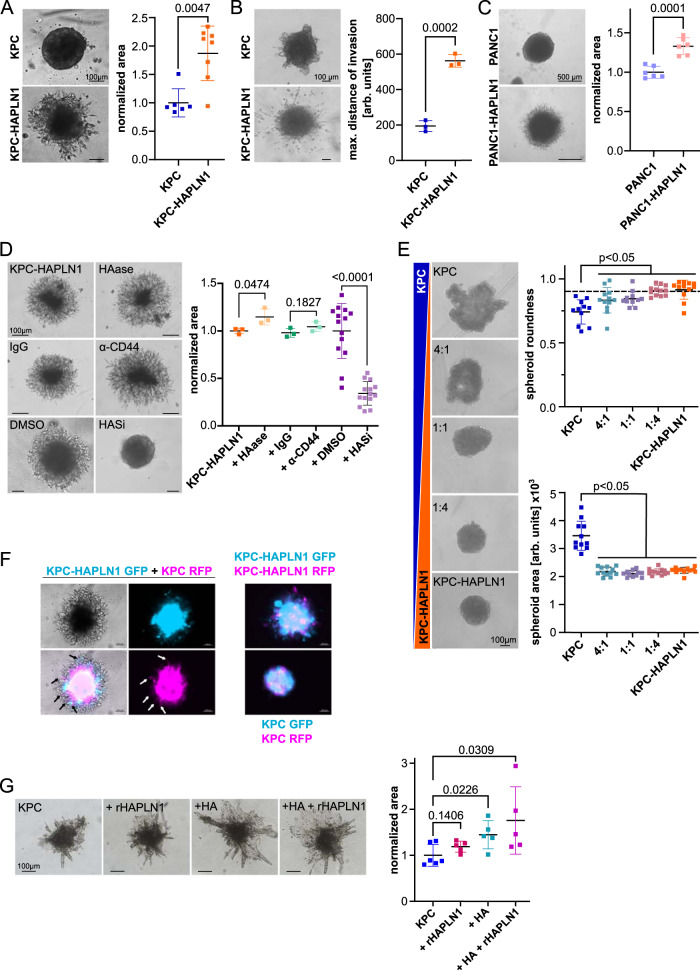
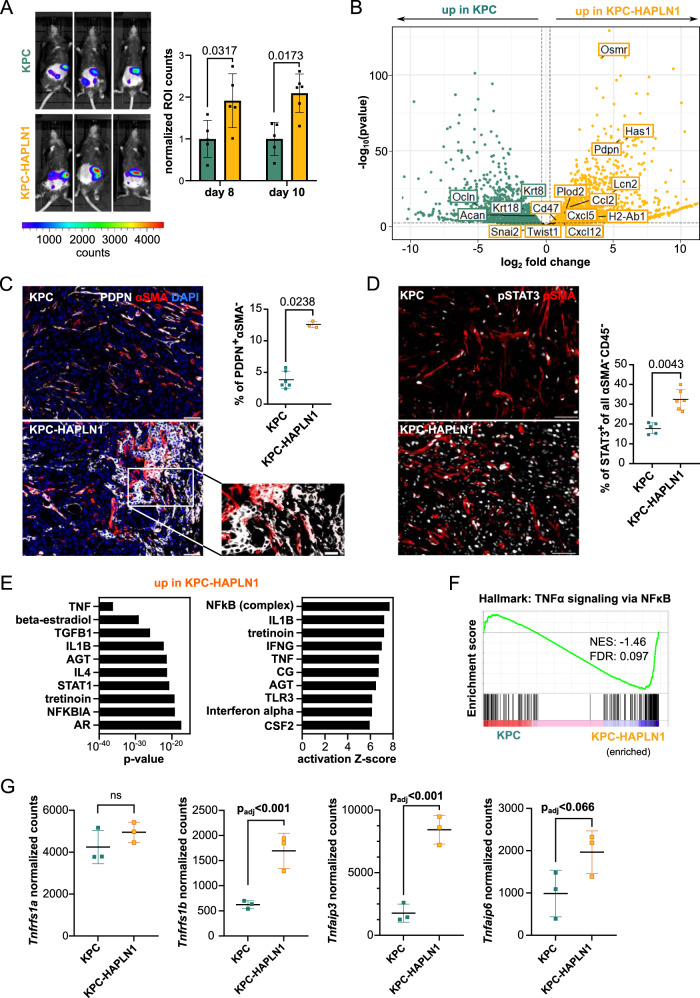
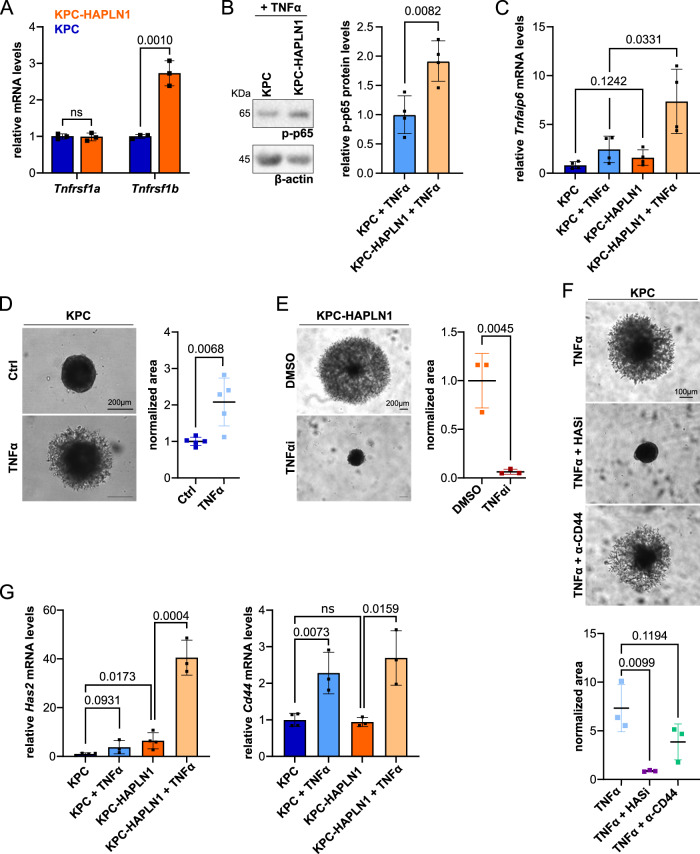
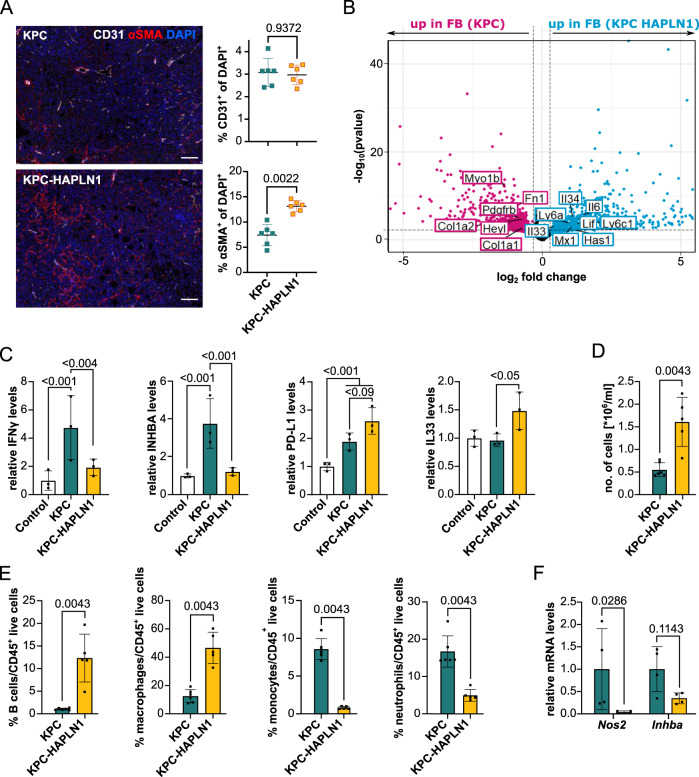
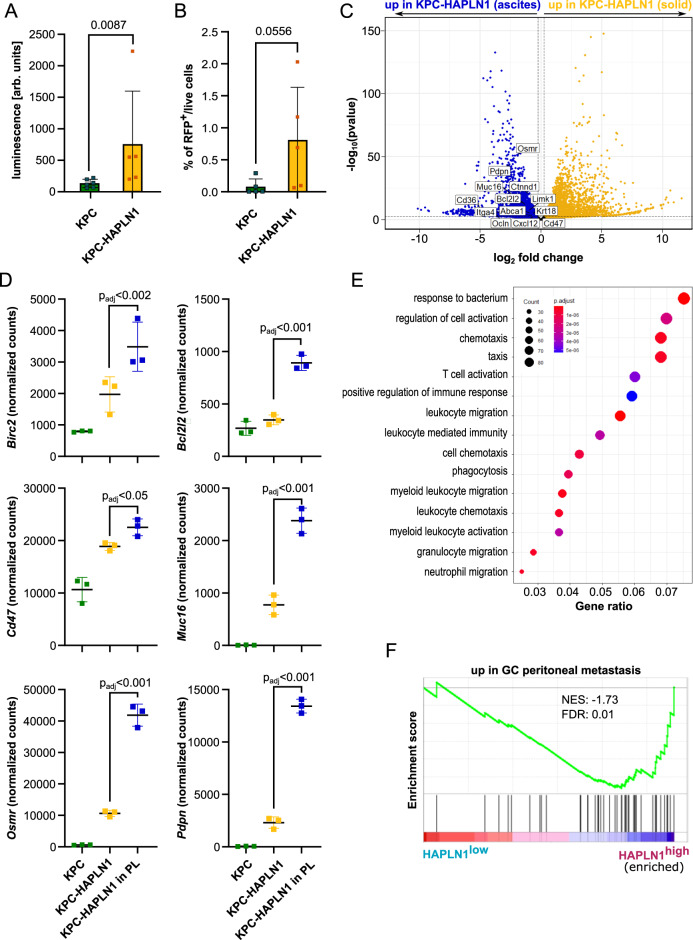
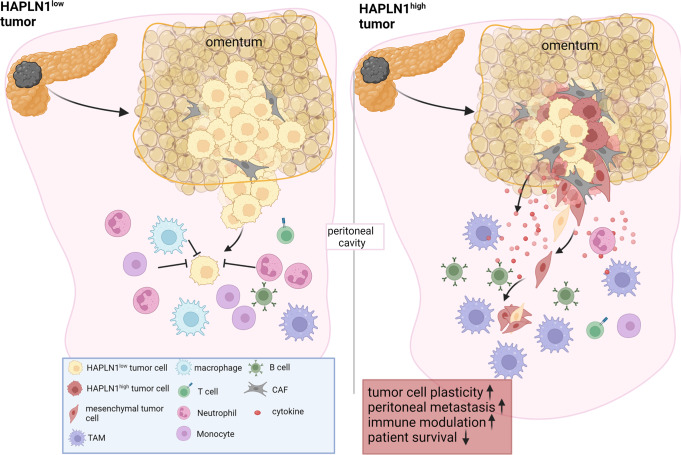
Pancreatic ductal adenocarcinoma (PDAC) frequently metastasizes into the peritoneum, which contributes to poor prognosis. Metastatic spreading is promoted by cancer cell plasticity, yet its regulation by the microenvironment is incompletely understood. Here, we show that the presence of hyaluronan and proteoglycan link protein-1 (HAPLN1) in the extracellular matrix enhances tumor cell plasticity and PDAC metastasis. Bioinformatic analysis showed that HAPLN1 expression is enriched in the basal PDAC subtype and associated with worse overall patient survival. In a mouse model for peritoneal carcinomatosis, HAPLN1-induced immunomodulation favors a more permissive microenvironment, which accelerates the peritoneal spread of tumor cells. Mechanistically, HAPLN1, via upregulation of tumor necrosis factor receptor 2 (TNFR2), promotes TNF-mediated upregulation of Hyaluronan (HA) production, facilitating EMT, stemness, invasion and immunomodulation. Extracellular HAPLN1 modifies cancer cells and fibroblasts, rendering them more immunomodulatory. As such, we identify HAPLN1 as a prognostic marker and as a driver for peritoneal metastasis in PDAC.


Conflict of interest statement

The authors declare no competing interests.

Figures

Fig. 1
Fig. 1. HAPLN1 is upregulated in PDAC tissue and associated with worse disease outcome.
A GSEA of data set published in Cao et al. (matched tumor and adjacent tissue samples. n = 21) on “Gene ontology for Hyaluronic Acid binding”. Leading edge genes significantly deregulated are marked with red star. B HAPLN1 expression levels in normal adjacent or PDAC tumor tissue according to TNMplot, (Normal: Min = 0, Q1 = 0, Med = 0, Q3 = 0, Max = 5, Upper Whisker = 0, n = 252; Tumor: Min = 0, Q1 = 7, Med = 19, Q3 = 57, Max = 1960, Upper Whisker = 129, n = 177). Unpaired non-parametric Mann–Whitney two-tailed U test was applied. CE GSEA on data set of Cao et al. (2021). Before analysis PDAC patients were divided in HAPLN1 high/low according to mean HAPLN1 expression. Gene sets of “Basal subtype” (C), “Classical subtype” (D) or “Hallmark of Epithelial-to-Mesenchymal transition” (E). n = 140. F Overall survival (OS) of PDAC patients stratified in two cohorts according to their mean HAPLN1 mRNA (n = 135) or protein expression levels (n = 125). For OS log-rank (Mantel–Cox) test was applied. G Human PDAC and adjacent tissue samples were sorted for epithelial/tumoral cells (EpCAM+ CD45), immune cells (EpCAM CD45+) and stromal cells (EpCAM CD45). HAPLN1 expression in cell types isolated from tumor by RNAseq; expression normalized to control tissue. Epithelial: Normal, Min = 0,7140, Q1 = 0,7140, Med = 0,7140, Q3 = 0,7140, Max = 0,7140, Upper Whisker = 0, n = 7; Tumor, Min = 0,7140, Q1 = 0,7140, Med = 0,7140, Q3 = 2,520, Max = 6,651, Upper Whisker = 1,746, n = 31. Immune: Normal, Min = 0,7140, Q1 = 0,7140, Med = 0,7140, Q3 = 2,511, Max = 3,343, Upper Whisker = 1,147, n = 5, Tumor, Min = 0,7140, Q1 = 0,7140, Med = 0,7140, Q3 = 2,623, Max = 4,765, Upper Whisker = 1,363, n = 26; Stromal: Normal, Min = 0,7140, Q1 = 0,7140, Med = 2,868, Q3 = 5,211, Max = 7,117, Upper Whisker = 2,622 n = 5; Tumor, Min = 0,7140, Q1 = 4,567, Med = 5,332, Q3 = 6,618, Max = 7,474, Upper Whisker = 2,001, n = 9. Dots represent biological replicates. Unpaired non-parametric Mann–Whitney two-tailed U test was applied. H HAPLN1 protein staining in human PDAC patient samples (n = 20) show staining in areas with tumoral cells. Three examples shown. Scale bar: 100 µm, zoom 25 µm.
Fig. 2
Fig. 2. HAPLN1 induces EMT and ECM remodeling in vitro.
A ELISA-like assay for Hyaluronan (HA) in the serum-free supernatant of KPC and KPC-HAPLN1 cells. n = 4. B qRT-PCR analysis of HA-synthase (Has) expression levels. HAS1 & HAS3, n = 3: HAS2, n = 4. C HAS2 protein levels evaluated by Western blot. Left panel: representative image, right panel: quantification by normalization to house keeper β-actin. n = 6. D mRNA expression of epithelial and mesenchymal markers comparing KPC and KPC-HAPLN1 cells. Cdh1, n = 4; rest, n = 3. E Western blot analysis of epithelial and mesenchymal markers on protein lysates. Left panel: representative image, right panel: quantification by normalization to house keeper VCP. E-Cadherin, n = 3; rest, n = 6. F mRNA expression of stemness markers by qRT-PCR. Abcg1, n = 4; rest, n = 3. G Cells seeded in ultra-low attachment plates. Pictures taken after 48 h. Quantification of area as measure for proper spheroid formation. Scale bar: 100 µm. KPC, n = 11; KPC-HAPLN1, n = 12. H Flow cytometric analysis of DAPI events using spheroids formed for 48 h. n = 3. I Schematic overview of HAPLN1 function as crosslinker of HA and proteoglycans aggrecan (ACAN) or versican (VCAN). J, K Gene expression analysis of Has2, n = 3 (J) and HAPLN1-associated proteoglycans (K) in spheroids. Vcan, n = 3; Acan, n = 4. Plots are shown as mean ± SD. Data points represent independent biological replicates. For panels A, B, D, FJ unpaired two-tailed T test was applied, for panels C, E paired two-tailed T test.
Fig. 3
Fig. 3. HAPLN1 fuels invasion and acts in a paracrine manner.
A Invasion of KPC or KPC-HAPLN1 cells 48 h after embedding of the spheroids into Matrigel. The occupied area of spheroids embedded into Matrigel is quantified as a readout of invasion (KPC: n = 6, KPC-HAPLN1: n = 8) and representative images are shown. Scale bar: 100 µm. B Invasion of KPC and KPC-HAPLN1 cells into collagen matrix. Distance of the three most invaded cells to spheroid was measured and averaged per sample. n = 3. Scale bar: 100 µm. C Invasion of PANC1 and PANC1-HAPLN1 cells into Matrigel 48 h after embedding. n = 6. Scale bar: 500 µm. D KPC-HAPLN1 cells embedded into Matrigel. Pictures taken 48 h after stimulation and embedding. Treatment with hyaluronidase (HAase, 200 mg/ml, n = 3), IgG control antibody (1 µg/ml, n = 3), anti-CD44 blocking antibody (1 µg/ml, n = 3), or the HAS inhibitor 4-methylumbelliferrone (HASi, 500 µM) or DMSO (n = 14). Scale bar: 100 µm. E KPC and KPC-HAPLN1 cells were mixed at different ratios. Images are representative of each condition. Scale bar: 100 µm. Spheroid roundness and area are quantified by Fiji software. KPC and 1:1, n = 11; rest, n = 12. F KPC and KPC-HAPLN1 cells were labeled with GFP or RFP via lentiviral vectors. Invasion was assessed after 48 h. Representative images of 3 independent experiments. Scale bar: 100 µm. G Invasion of KPC cells into collagen matrix 96 h after embedding and treating with exogenous HA (10 µg/ml) and/or rHAPLN1 (80 ng/ml). KPC, n = 6; rest, n = 5. Scale bar: 100 µm. Graphs represent mean ± SD. Each data point represents a biological replicate. Unpaired two-tailed T test was used for analysis.
Fig. 4
Fig. 4. HAPLN1 induces a highly plastic tumor cell state in vivo.
A In vivo luminescence was measured at day 8 and 10 after tumor cell injection and normalized to the control. Three representative images per group are shown. KPC n = 5; KPC-HAPLN1 n = 6. B Volcano plot obtained from RNA sequencing on tumor cells that were isolated from KPC or KPC-HAPLN1 solid tumors. Each dot represents one gene, with green dots upregulated in KPC and yellow dots upregulated in KPC-HAPLN1 cells. Some genes of interest were labeled. n = 3. C Podoplanin (PDPN)/αSMA staining on tumors. Representative images and quantification of PDPN+ αSMA cells are shown. Scale bar: 50 µm, zoom: 20 µm. KPC n = 6; KPC-HAPLN1 n = 3. D pSTAT3/αSMA staining on tumors. Representative images and quantification of STAT3+ tumor cells are shown. KPC n = 5; KPC-HAPLN1 n = 6. E Top 10 upstream regulators assessed by ingenuity pathway analysis (IPA) of sorted tumor cells from mouse tumors sorted by p value or activation Z score. F GSEA of “HALLMARK: TNFα signaling via NFκB” on sorted tumor cells. G Normalized read counts of TNFα-related genes in sorted tumor cells from mouse tumors. n = 3. Graphs represent mean ± SD. Data points indicate independent biological replicates. For panels A, C, D non-parametric two-tailed Mann–Whitney U test was used. For panel B, the package DESeq2 in R studio was used. In this package, the Wald test is used for hypothesis testing when comparing two groups. Correction was performed by multiple testing using the Benjamini–Hochberg (BH) method.
Fig. 5
Fig. 5. Increased TNF signaling induces tumor cell plasticity.
A KPC (blue) and KPC-HAPLN1 (orange) cells were cultured and TNFα receptors expression analyzed by qPCR. n = 3. B Western blot analysis of phosphorylated p65 (p-p65) after 15 min of 50 ng/ml TNFα stimulation as readout for increased NFκB signaling. β-actin was used as loading control. n = 4. C Analysis of TNF-induced gene expression in vitro. Stimulation with 50 ng/ml recombinant TNFα for 6 h in starvation. n = 4. D Invasion assay into Matrigel of KPC cells stimulated with 50 ng/ml TNFα. Invasion was measured as relative occupied area 48 h after embedding. n = 5. Scale bar: 200 µm. E Invasion assay of KPC-HAPLN1 cells into Matrigel using an TNFα antagonist (10 µg/ml). n = 3. F Invasion assay of KPC cells into Matrigel after addition of 50 ng/ml TNFα, 500 µM 4-methylumbelliferrone (HASi) or anti-CD44 blocking antibody. Pictures taken 48 h after embedding and stimulation. n = 3. Scale bar: 100 µm. G Relative mRNA levels of Has2 and Cd44 after 6 h of 50 ng/ml TNFα stimulation. KPC n = 4; rest n = 3. Graphs represent mean ± SD. Data points indicate independent biological replicates. Unpaired two-tailed T test was used for statistical analysis.
Fig. 6
Fig. 6. HAPLN1 modifies the immune microenvironment.
A CD31/αSMA immunofluorescence staining on tumors. Representative images and quantification of CD31+ cells and αSMA+ cells are shown. Scale bar: 50 µm. n = 6. B RNA sequencing of PDPN+ isolated cancer-associated fibroblasts from KPC or KPC-HAPLN1 tumors. Pink dots mark genes significantly up in CAFs from KPC, blue dots genes significantly up in CAFs from KPC-HAPLN1 tumors. Some genes of interest are labeled. n = 3. C Serum of healthy, or KPC/KPC-HAPLN1-injected mice at day 11 of tumor growth was analyzed using the scioCD protein array. Relative protein levels displayed. n = 3. D Number of cells per milliliter in the peritoneal lavage of mice after 11 days of tumor growth. KPC n = 6; KPC-HAPLN1 n = 5. E Immune cell populations in the peritoneal lavage assessed by flow cytometry. KPC n = 6; KPC-HAPLN1 n = 5. F Macrophages were isolated from the peritoneum by cell sorting. qRT-PCR analysis of inflammatory marker genes. n = 4. Graphs represent mean ± SD. Data points indicate independent biological replicates. Non-parametric two-tailed Mann–Whitney U test was used.
Fig. 7
Fig. 7. HAPLN1 facilitates peritoneal colonization by tumor cells.
A Ex vivo luminescence measurement on peritoneal lavage of KPC and KPC-HAPLN1 mice 11 days after tumor injection. KPC n = 6; KPC-HAPLN1 n = 5. B RFP+ tumor cells detected by flow cytometry in the peritoneal lavage of mice at day 11. n = 5. C RNA sequencing results comparing KPC-HAPLN1 cells from solid tumor or in suspension in peritoneal lavage. Blue dots mark genes upregulated in cells in suspension, yellow dots genes upregulated in cells in tumor mass. Some genes of interest are highlighted. n = 3. D Selected genes displayed using normalized read counts. n = 3. E Gene Ontology of ‘Biological Process’ on genes upregulated in KPC-HAPLN1 cells which detached into the peritoneal cavity. F GSEA on the PDAC patient data set of Cao et al. (2021), divided in high or low HAPLN1 expression by the mean HAPLN1 expression. A gene set for genes upregulated in gastric cancer (GC) peritoneal metastasis was used. n = 140. Graphs represent mean ± SD. Data points indicate independent biological replicates. Non-parametric two-tailed Mann–Whitney U test was used for panel A and B. For panels CE, the package DESeq2 in R studio was used. In this package, the Wald test is used for hypothesis testing when comparing two groups. Correction was performed by multiple testing using the Benjamini–Hochberg (BH) method.
Fig. 8
Fig. 8. HAPLN1 drives peritoneal carcinomatosis by inducing cell plasticity.
We propose that in HAPLN1 low conditions tumor cells are less equipped to survive in the peritoneal cavity due to a decreased migratory capacity and a tumoricidal environment. When HAPLN1 expression increases, cells become more plastic, increasing invasiveness and preconditioning the peritoneal cavity for an increased tolerance of invading tumor cells.

References

    1. Bengtsson A, Andersson R, Ansari D. The actual 5-year survivors of pancreatic ductal adenocarcinoma based on real-world data. Sci. Rep. 2020;10:164251. doi: 10.1038/s41598-020-73525-y. - DOI - PMC - PubMed
    1. Thomassen I, et al. prognosis, and possible treatment strategies of peritoneal carcinomatosis of pancreatic origin: a population-based study. Pancreas. 2013;42:72–75. doi: 10.1097/MPA.0b013e31825abf8c. - DOI - PubMed
    1. Avula LR, Hagerty B, Alewine C. Molecular mediators of peritoneal metastasis in pancreatic cancer. Cancer Metastasis Rev. 2020;39:1223–1243. doi: 10.1007/s10555-020-09924-4. - DOI - PMC - PubMed
    1. Hanahan D. Hallmarks of cancer: new dimensions. Cancer Discov. 2022;12:31–46. doi: 10.1158/2159-8290.CD-21-1059. - DOI - PubMed
    1. Shibue T, Weinberg RA. EMT, CSCs, and drug resistance: the mechanistic link and clinical implications. Nat. Rev. Clin. Oncol. 2017;14:611–629. doi: 10.1038/nrclinonc.2017.44. - DOI - PMC - PubMed

Publication types

Substances