. 2023 Apr 24;14(1):2346.
doi: 10.1038/s41467-023-37797-y.

Parasubthalamic calretinin neurons modulate wakefulness associated with exploration in male mice

Affiliations

Parasubthalamic calretinin neurons modulate wakefulness associated with exploration in male mice

Han Guo et al. Nat Commun. .

Abstract

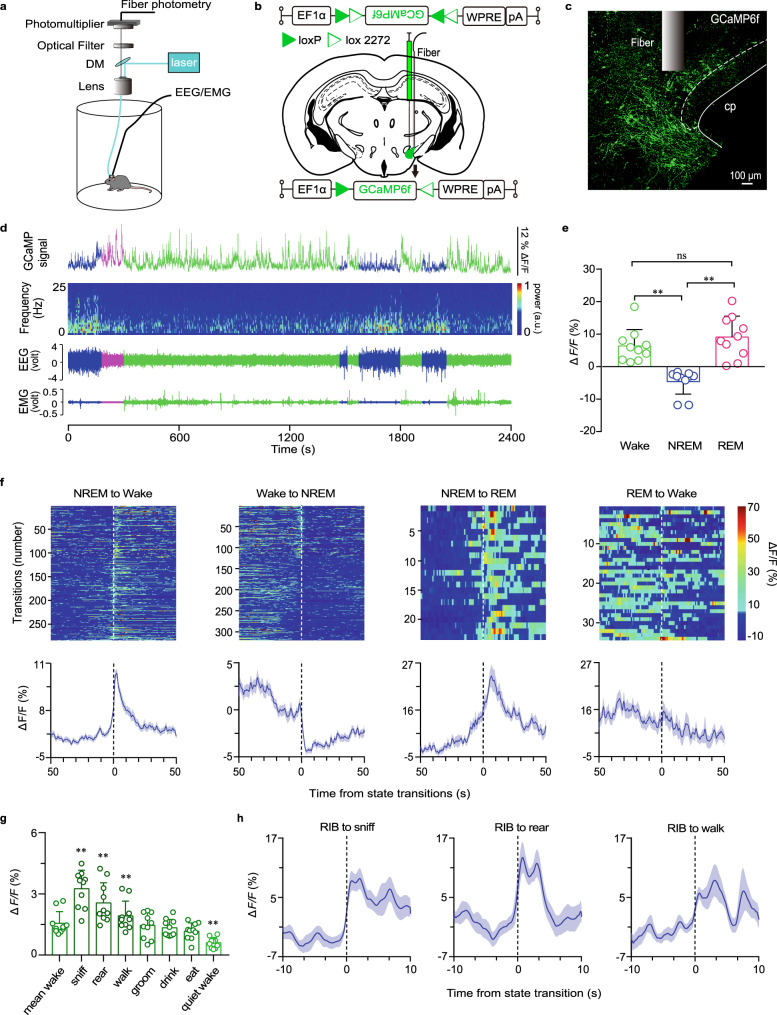
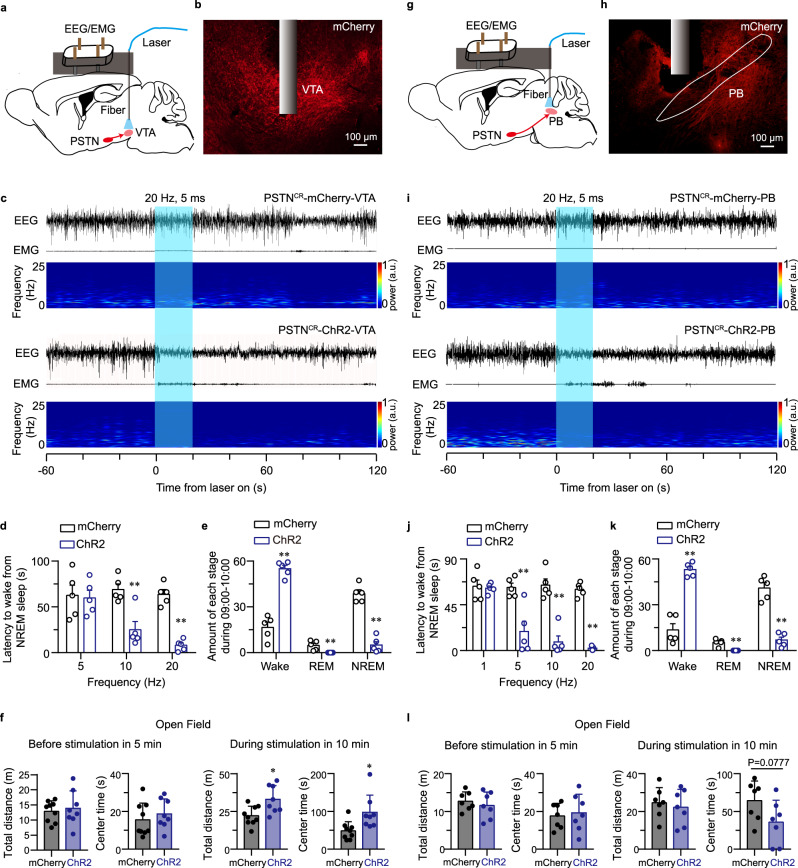
The parasubthalamic nucleus (PSTN) is considered to be involved in motivation, feeding and hunting, all of which are highly depending on wakefulness. However, the roles and underlying neural circuits of the PSTN in wakefulness remain unclear. Neurons expressing calretinin (CR) account for the majority of PSTN neurons. In this study in male mice, fiber photometry recordings showed that the activity of PSTNCR neurons increased at the transitions from non-rapid eye movement (non-REM, NREM) sleep to either wakefulness or REM sleep, as well as exploratory behavior. Chemogenetic and optogenetic experiments demonstrated that PSTNCR neurons were necessary for initiating and/or maintaining arousal associated with exploration. Photoactivation of projections of PSTNCR neurons revealed that they regulated exploration-related wakefulness by innervating the ventral tegmental area. Collectively, our findings indicate that PSTNCR circuitry is essential for the induction and maintenance of the awake state associated with exploration.


Conflict of interest statement

The authors declare no competing interests.

Figures

Fig. 1
Fig. 1. Population activity of PSTN CR neurons across sleep-wake states and sniffing, rearing, and walking behaviors.
a Schematic of the in vivo recording configuration. b Diagram of unilateral viral infection area of AAV-EF1α-DIO-GCaMP6f. c The position of the tip of the fiber optic in the PSTN. Scale bar: 100 μm. d Representative fluorescence traces, EEG/EMG traces across spontaneous sleep-wake states. e Mean ± S.E.M. fluorescence during wake, NREM sleep, and REM sleep (n = 5, two sessions per mouse; one-way ANOVA, F2,18 = 16.34, P = 1.5 × 10−4 P(wake-NREM) = 7.597 × 10−3, (wake-REM) = 0.5851, (REM-NREM) = 3.37 × 10−4. ΔF/F, change in fluorescence from the median of the entire time series. f Fluorescence signal transformation aligned to sleep-wakefulness state transitions. Upper panel, individual transitions with color-coded fluorescence intensity (NREM to wake, n = 283; wake to NREM, n = 319; NREM to REM, n = 23; REM to wake, n = 34). Lower panel, mean (blue trace) ± S.E.M. (gray shading) showing the average calcium transients from all the transitions. g Fluorescence (mean ± S.E.M.) during the behavior of mean wake, sniff, rear, walk, groom, drink, eat and quiet wake (n = 5 mice, two sessions per mouse; one-way ANOVA, F7,63 = 18.9, P = 2.95 × 10−7 P = 1.13 × 10−3(mean wake-sniff), 3.15 × 10−3(mean wake-rear), 0.0228(mean wake-walk), 6.70 × 10−3(mean wake-quiet wake)). h Mean (blue trace) ± S.E.M. (gray shading) showing the average calcium transients from relatively inactive behaviors (RIB) to sniff, rear, or walk state (transition to sniff, n = 15; transition to rear, n = 13; transition to walk, n = 10). *P < 0.05, **P < 0.01.
Fig. 2
Fig. 2. Chemogenetic activation of PSTN CR neurons increased wakefulness and exploratory behaviors.
a Diagram of the bilateral viral infection area of AAV-hSyn-DIO-hM3Dq-mCherry in the PSTN. b Representative photomicrographs of the PSTN depicting mCherry (red), c-Fos (green), and merge (yellow) images of PSTN-mCherry and PSTN-hM3Dq mice after administration of CNO. PSTN: parasubthalamic nucleus, cp: cerebral peduncle. Scale bar: 50 µm. c Representative voltage traces recorded from an mCherry-expressing neuron and an hM3Dq-expressing neuron during the application of CNO, which produced depolarization and firing in a patched hM3Dq-expressing neuron. d Examples of relative EEG power, EEG/EMG traces, and hypnograms over 6 h following CNO injection of PSTN-mCherry or PSTN-hM3Dq mice at 09:00. e Time course changes in wakefulness, NREM sleep, and REM sleep after administration of CNO to PSTN-mCherry or PSTN-hM3Dq mice (mCherry mice: n = 6, hM3Dq mice: n = 8; Two-way ANOVA, Wake: F1,12 = 76.13, P = 1.53 × 10−6; NREM: F1,12 = 78.02, P = 1.34 × 10−6; REM: F1,12 = 8.66, P = 0.0123). f Total time spent in each stage for 4 h after CNO injection of PSTN-mCherry or PSTN-hM3Dq mice. (mCherry mice: n = 6, hM3Dq mice: n = 8; unpaired two-sided t-test, Wake: t12 = 17.76, P = 5.548 × 10−10; NREM: t12 = 16.69, P = 1.142 × 10−9 REM: t12 = 14.8, P = 4.542 × 10−9). g EEG power density of wakefulness, NREM sleep, and REM sleep during the 4 h after CNO injection of PSTN-mCherry or PSTN-hM3Dq mice (mCherry mice: n = 6, hM3Dq mice: n = 8; Two-way ANOVA; not statistically significant). h Quantification of the behaviors observed in mice in the 1 h following CNO or saline injection at 21:00 (n = 8, paired two-sided t-test; sniff: t7 = 3.041, P = 0.0188; rear: t7 = 2.448, P = 0.0443). Bars represent the mean percentage of awaken time (±SEM) that mice spent conducting each behavior. i, j Chemogenetic activation of PSTN CR neurons increased the locomotion and center time in the open-field test (n = 8, unpaired two-sided t-test; total distance: t7 = 4.806, P = 0.0003; center time: t7 = 2.502, P = 0.0254) (i) and the number of entries in the white box (mCherry groups and hM3Dq+vehicle: n = 7, hM3Dq+CNO: n = 8; unpaired two-sided t-test, t13 = 3.604, P = 0.0032) (j). Data represent mean ± SEM, *P < 0.05, **P < 0.01.
Fig. 3
Fig. 3. Optogenetic activation of PSTN CR neurons induces a rapid transition from NREM sleep to wakefulness and increases exploratory behaviors.
a Schematic of the in vivo optical stimulation. b Representative photomicrographs of the PSTN depicting mCherry expression from a CR-Cre mouse microinjected with Cre-dependent AAV vectors containing ChR2. Scale bar: 1 mm. c Brief light pulses of light (5 ms, 1–100 Hz) evoked action potentials with 100% frequency fidelity in the 1, 5, 10, 20, and 30 Hz in CR neurons (n = 5 biologically independent cells). An example spike evoked by light pulses (20 Hz) was showed in the upside. d Representative EEG/EMG traces and the corresponding heatmap of EEG power spectra illustrating behavioral responses to optogenetic activation in mCherry and ChR2 mice during the 3-min recording. Blue columns indicate the photostimulation period (20 s). e Illustration showing the 40 NREM or REM sleep-to-wake transitions induced by photostimulation (20 Hz, 5 ms) in mCherry or ChR2 mice. Quantification was based on an average of 8 stimulations per mouse. f Latencies of transitions from NREM sleep to wakefulness after photostimulation at different frequencies (mCherry: n = 5, ChR2: n = 6, unpaired two-sided t-test, 1 Hz: t9 = 0.2204, P = 0.8305; 5 Hz: t9 = 5.594, P = 3.37 × 10−4; 10 Hz: t9 = 5.583, P = 3.42 × 10−4; 20 Hz: t9 = 7.83, P = 2.63 × 10−5; 30 Hz: t9 = 6.938, P = 6.77 × 10−5). g Time course of wakefulness during the semi-chronic optogenetic experiment (20 Hz/5 ms, 30 s on/30 s off). The column indicates the photostimulation period (1 h) of mCherry and ChR2 groups (mCherry: n = 5, ChR2: n = 6, Two-way repeated-measures ANOVA; F1,9 = 14.31, P = 4.33 × 10−3). h Total amounts of each stage in mCherry and ChR2 groups (mCherry: n = 5, ChR2: n = 6, unpaired two-sided t-test; Wake: t9 = 4.25, P = 2.142 × 10−3; REM: t9 = 3.819, P = 3.664 × 10−3; NREM: t9 = 3.862, P = 3.835 × 10−3). i There was no significant difference between the mCherry group and the ChR2 group in the locomotion and center time in the OF test before light on (left panel). The locomotion and center time were significantly increased in the ChR2 group compared to the mCherry group after light on (right panel, mCherry: n = 9, ChR2: n = 8; unpaired two-sided t-test; Total distance: t15 = 3.238, P = 0.0055; Center time: t15 = 2.147, P = 0.0486). Data represent mean ± SEM, *P < 0.05, **P < 0.01.
Fig. 4
Fig. 4. Optogenetic activation of the PSTNCR-VTA pathway induces a rapid transition from NREM sleep to wakefulness and increases exploratory behaviors.
a, g Schematic of the optical stimulation in the VTA (a) and PB (g). b, h Representative photomicrographs of the VTA (b) and PB (h) depicting ChR2-mCherry-positive terminals (red) from the PSTN. Scale bar: 1 mm. c, i Representative EEG/EMG traces and corresponding heatmap of EEG power spectra illustrating the behavioral responses to optogenetic activation in PSTNCR-mCherry (up)/ChR2 (down)-VTA (c) and PSTNCR-mCherry (up)/ChR2 (down)-PB (i) mice during the 3 min recording. Blue columns indicate the photostimulation period (20 s). d, j Latencies of the transitions from NREM sleep to wakefulness after photostimulation of the VTA projections (n = 5, 5 Hz: t8 = 0.1909, P = 0.8533;10 Hz: t8 = 4.09, P = 0.0035; 20 Hz: t8 = 9.585, P = 1.16 × 10−5) (d) and PB projections (n = 5, 1 Hz: t8 = 0.2864, P = 0.7818; 5 Hz: t8 = 3.965, P = 4.15 × 10−3; 10 Hz: t8 = 6.534, P = 1.81 × 10−4; 20 Hz: t8 = 19.01, P = 6.08 × 10−8) (j) from the PSTN at different frequencies. e, k Total amounts of each stage in mCherry and ChR2 group after photostimulation of the PSTN-VTA (n = 5, Wake: t8 = 9.366, P = 1.38×10⁻⁵; REM: t8 = 3.496, P = 0.0081; NREM: t8 = 9.893, P = 9.2 × 10−6) (e) and PSTN-PB (n = 5, Wake: t8 = 8.748, P = 2.28 × 10;−5 REM: t8 = 5.23, P = 7.93 × 10−4; NREM: t8 = 8.716, P = 2.34 × 10−5) (k) circuits. f There was no significant difference between the mCherry group and the ChR2 group in the locomotion and center time in the OF test (left) before light on. The locomotion and center time are significantly increased in the ChR2 group during 10 min after photostimulation of the VTA (5 ms blue light pulses at 20 Hz for 30 s, every 1 min for 10 min) (mCherry group: n = 9, ChR2 group: n = 8; Total distance: t15 = 2.888, P = 0.0113; Center time: t15 = 2.791, P = 0.0137). l There was no significant difference between the mCherry group and the ChR2 group in the locomotion and center time in the OF test (left) before and after photostimulation of the PB, the photostimulation conditions are the same as (f) (mCherry or ChR2 group: n = 7, Total distance: t12 = 0.4907, P = 0.6325; Center time: t12 = 1.929, P = 0.0777). Unpaired two-sided t-test was used for statistical analysis (df, jl). Data represent mean ± SEM, *P < 0.05, **P < 0.01.
Fig. 5
Fig. 5. Chemogenetic inhibition of PSTN CR neurons decreases wakefulness and exploratory behaviors.
a Diagram of bilateral viral infection area of AAV-hSyn-DIO-hM4Di-mCherry in the PSTN. b Representative photomicrographs of the PSTN depicting mCherry (red), c-Fos (green), and merge (yellow) images of PSTN-mCherry and PSTN-hM4Di mice after administration of CNO. CNO decreases c-Fos expression in hM4Di-expressing neurons in the PSTN. Scale bar: 50 µm. c Representative voltage traces recorded from an mCherry-expressing neuron and an hM4Di-expressing neuron during the application of CNO, which reduced the firing rate in a patched hM4Di-expressing neuron. d Examples of relative EEG power, EEG/EMG traces, and hypnograms over 4 h following CNO injection of PSTN-mCherry or PSTN-hM4Di mice at 21:00. e Time course changes in wakefulness, NREM sleep, and REM sleep after administration of CNO to PSTN-mCherry or PSTN-hM4Di mice (mCherry group: n = 5, hM4Di group: n = 7; Two-way ANOVA; Wake: F1,10 = 11.73, P = 0.0065; NREM: F1,10 = 12.53, P = 0.0054; REM: F1,10 = 2.22, P = 0.1671). f Total time spent in each stage for 2 h after CNO injection of PSTN-mCherry or PSTN-hM4Di mice (mCherry group: n = 5, hM4Di group: n = 7; unpaired two-sided t-test; Wake: t10 = 3.835, P = 0.0033; NREM: t10 = 3.821, P = 0.0034; REM: t10 = 1.326, P = 0.2142). g EEG power density of wakefulness and NREM sleep during the 2 h after CNO injection of PSTN-mCherry or PSTN-hM4Di mice (n = 7, Two-way ANOVA; not statistically significant). h Quantification of behaviors observed in mice during 1 h following 9 pm CNO injection or saline injection (n = 7, paired two-sided t-test; sniff: t6 = 3.077, P = 0.02176; rear: t6 = 2.853, P = 0.02906; walk: t6 = 3.37, P = 0.01504; groom: t6 = 2.335, P = 0.05824; drink: t6 = 1.419, P = 0.2056; eat: t6 = 0.08934, P = 0.9317). Chemogenetic inhibition of PSTN CR neurons decreased sniffing, rearing, and walking behaviors. i, j There was no significant change in behavior in the OFT and light-dark box test after inhibition of PSTN CR neurons (n = 7, unpaired two-sided t-test). Data represent mean ± SEM, *P < 0.05, **P < 0.01.

Similar articles

Cited by

References

    1. Solie C, Girard B, Righetti B, Tapparel M, Bellone C. VTA dopamine neuron activity encodes social interaction and promotes reinforcement learning through social prediction error. Nat. Neurosci. 2022;25:86–97. doi: 10.1038/s41593-021-00972-9. - DOI - PMC - PubMed
    1. Eban-Rothschild A, Rothschild G, Giardino WJ, Jones JR, de Lecea L. VTA dopaminergic neurons regulate ethologically relevant sleep-wake behaviors. Nat. Neurosci. 2016;19:1356–1366. doi: 10.1038/nn.4377. - DOI - PMC - PubMed
    1. Watabe-Uchida M, Zhu L, Ogawa SK, Vamanrao A, Uchida N. Whole-brain mapping of direct inputs to midbrain dopamine neurons. Neuron. 2012;74:858–873. doi: 10.1016/j.neuron.2012.03.017. - DOI - PubMed
    1. Zseli G, et al. Elucidation of the anatomy of a satiety network: Focus on connectivity of the parabrachial nucleus in the adult rat. J. Comp. Neurol. 2016;524:2803–2827. doi: 10.1002/cne.23992. - DOI - PMC - PubMed
    1. Goto M, Swanson LW. Axonal projections from the parasubthalamic nucleus. J. Comp. Neurol. 2004;469:581–607. doi: 10.1002/cne.11036. - DOI - PubMed

Publication types

LinkOut - more resources