. 2023 Apr 24;14(4):289.
doi: 10.1038/s41419-023-05773-5.

Post-transcriptional modification of m6A methylase METTL3 regulates ERK-induced androgen-deprived treatment resistance prostate cancer

Affiliations

Post-transcriptional modification of m6A methylase METTL3 regulates ERK-induced androgen-deprived treatment resistance prostate cancer

Yang Li et al. Cell Death Dis. .

Abstract

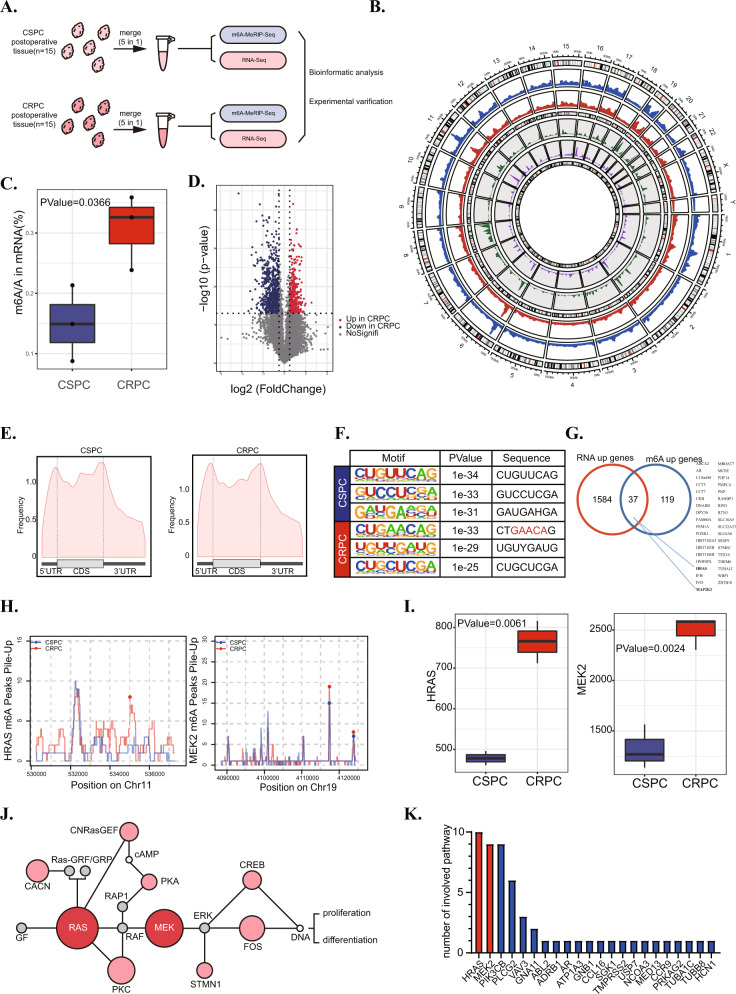
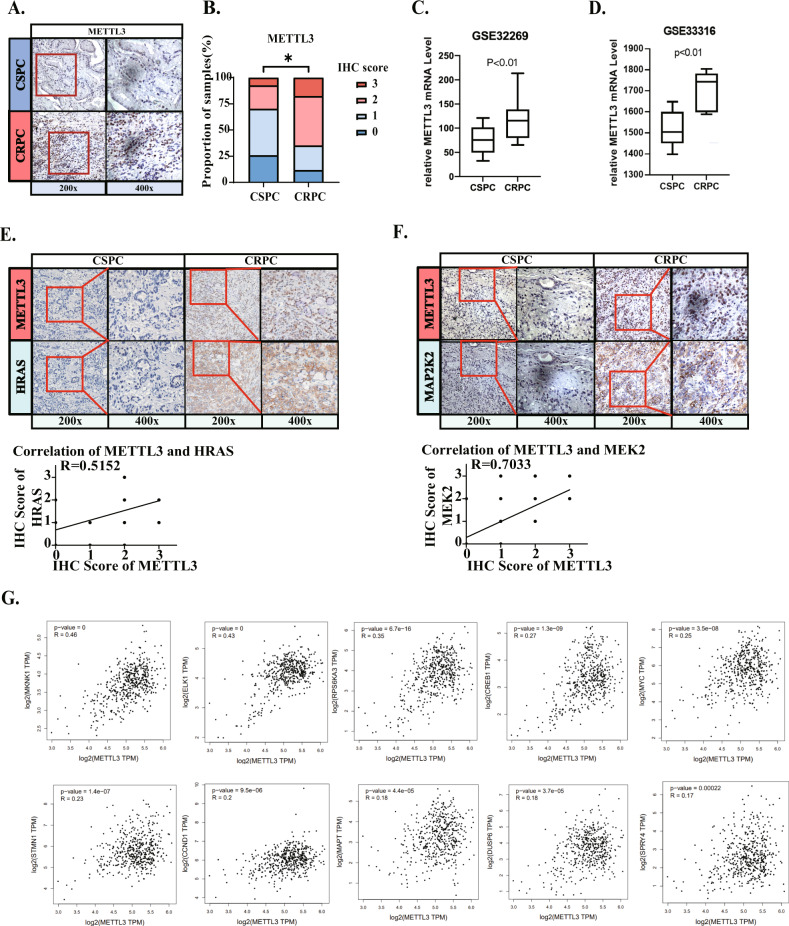
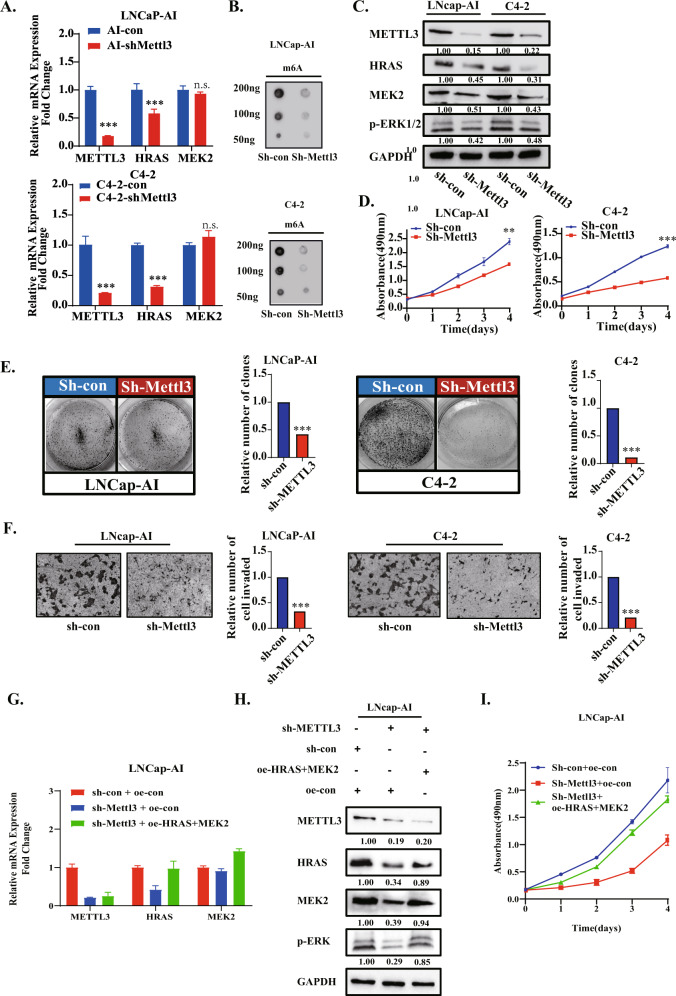
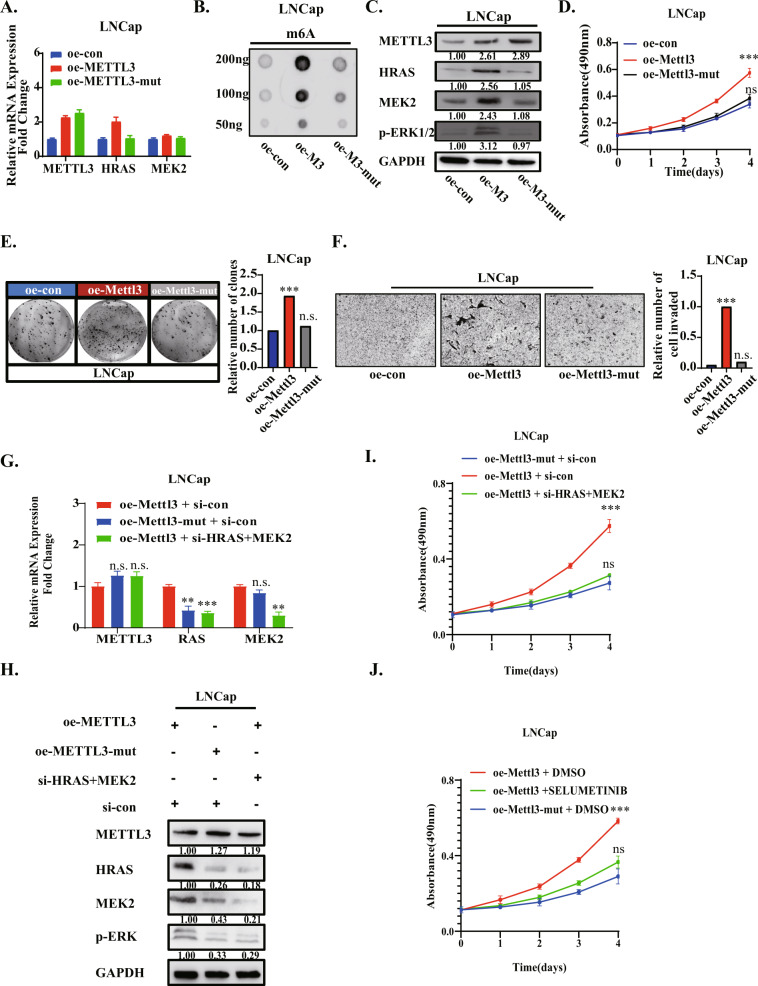
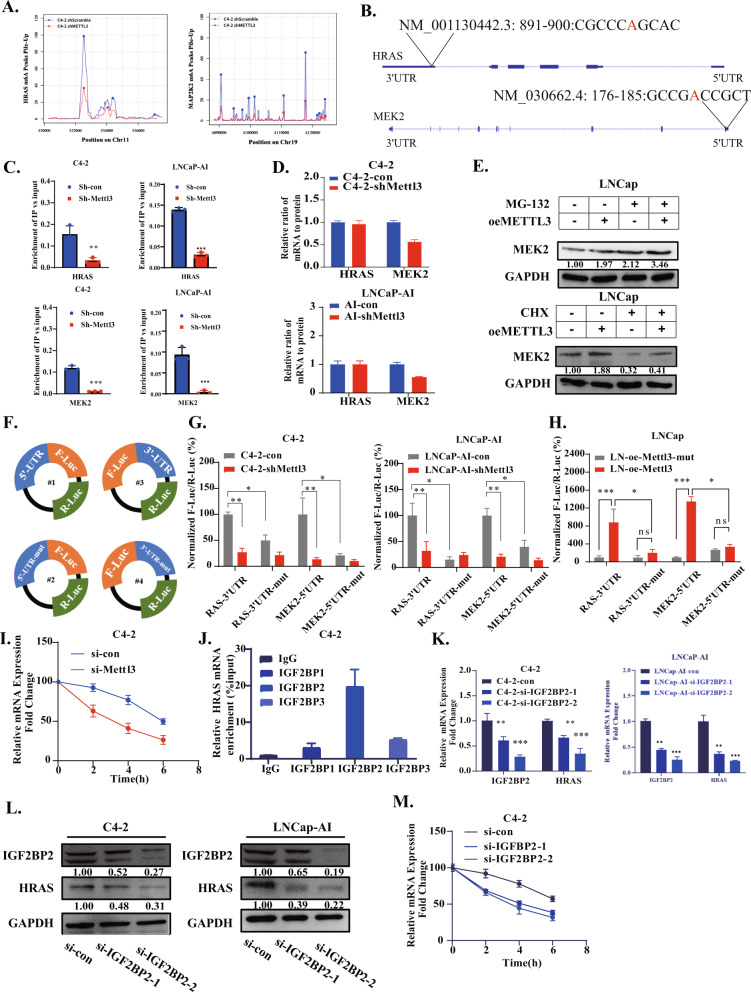
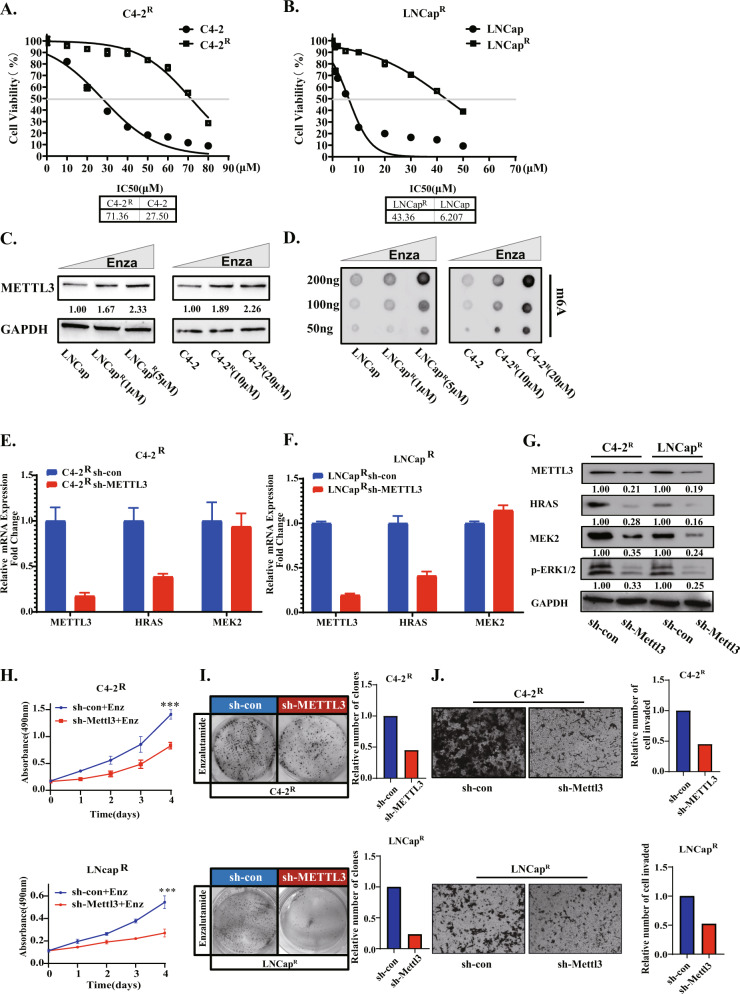
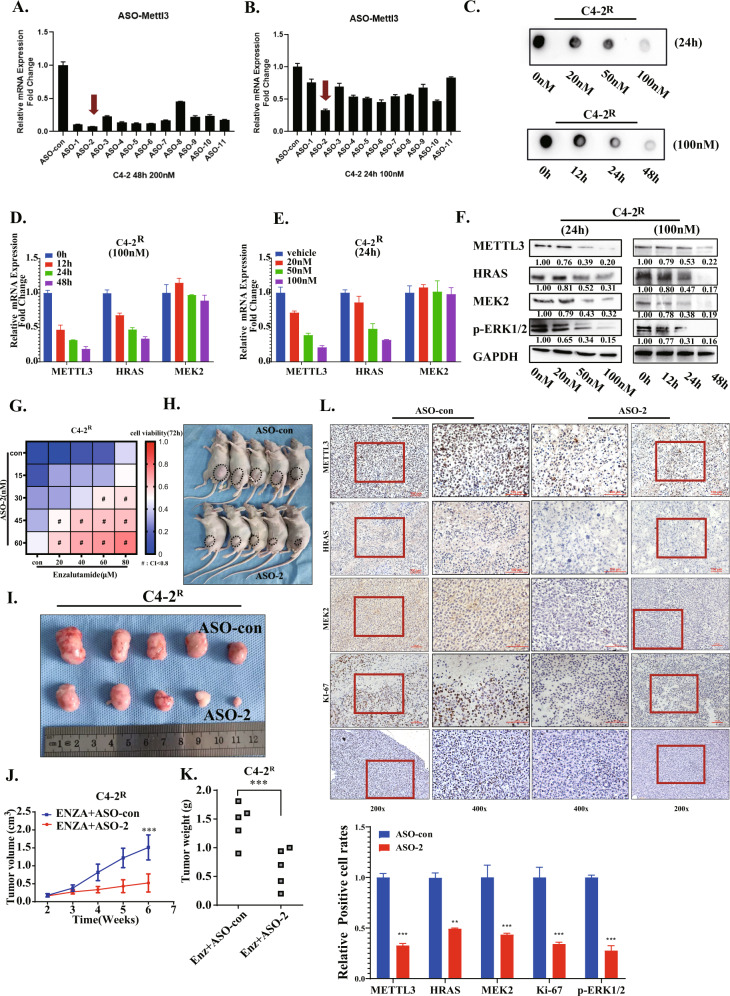
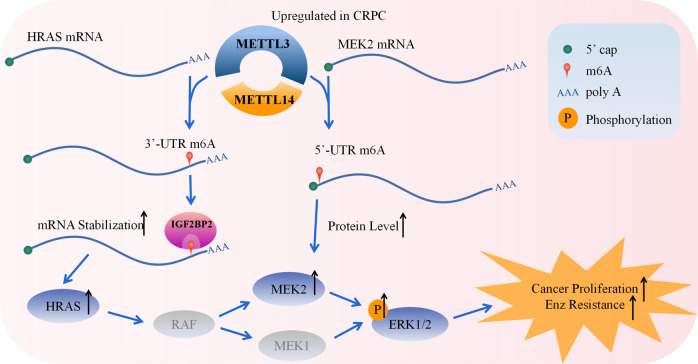
As the most common modification of RNA, N6-methyladenosin (m6A) has been confirmed to be involved in the occurrence and development of various cancers. However, the relationship between m6A and castration resistance prostate cancer (CRPC), has not been fully studied. By m6A-sequencing of patient cancer tissues, we identified that the overall level of m6A in CRPC was up-regulated than castration sensitive prostate cancer (CSPC). Based on the analysis of m6A-sequencing data, we found m6A modification level of HRas proto-oncogene, GTPase (HRAS) and mitogen-activated protein kinase kinase 2 (MEK2 or MAP2K2) were enhanced in CRPC. Specifically, tissue microarray analysis and molecular biology experiments confirmed that METTL3, an m6A "writer" up-regulated after castration, activated the ERK pathway to contribute to malignant phenotype including ADT resistance, cell proliferation and invasion. We revealed that METTL3-mediated ERK phosphorylation by stabilizing the transcription of HRAS and positively regulating the translation of MEK2. In the Enzalutamide-resistant (Enz-R) C4-2 and LNCap cell line (C4-2R, LNCapR) established in the current study, the ERK pathway was confirmed to be regulated by METTL3. We also found that applying antisense oligonucleotides (ASOs) to target the METTL3/ERK axis can restore Enzalutamide resistance in vitro and in vivo. In conclusion, METTL3 activated the ERK pathway and induced the resistance to Enzalutamide by regulating the m6A level of critical gene transcription in the ERK pathway.


Conflict of interest statement

The authors declare that they have no competing interests. All authors have made a significant contribution to the findings and methods described in the paper. All authors have reviewed and approved the manuscript. There are no financial or commercial interests, no ethical issues. The work has not been published and has not been submitted simultaneously to any other journal.

Figures

Fig. 1
Fig. 1. MeRIP-seq of CRPC tumours with enhanced m6A methylation.
A Flow chart of MERIP&RNA sequencing to detect CSPC and CRPC tissue. B Overall display of MERIP&RNA sequencing data in the Circos figure. C The total m6A level of CSPC and CRPC tissue. D The volcanoplot shows the results of RNA sequencing of CSPC and CRPC tissues from a global perspective. E Metagene showed an m6A distribution pattern in CRPC and CSPC tissue. The distribution of m6A was determined by MeRIP-seq. F The m6A motif and sequence enriched in CSPC and CRPC was showed. G Venn diagram showing significant overlap among variated genes in CRPC/CSPC and m6A enriched genes in CRPC/CSPC. H The data of MeRIP-seq data showed the level of m6A modification of HRAS and MEK2 in CSPC and CRPC tissues. I The results of RNA-seq showed the RNA levels of HRAS and MEK2 in CSPC and CRPC tissues. J The figure ranks genes with differences in both m6A and RNA levels by the number they are involved in the signaling pathway. HRAS and MEK2 are marked in red in the figure. K ERK signal pathway diagram, in which the genes with significant differences in m6A and RNA levels in CSPC and CRPC are marked in red, while genes with only RNA levels are labeled in pink.
Fig. 2
Fig. 2. Clinical analysis confirmed the positive correlated of METTL3 and HRAS/MEK2 in CRPC.
A Images of IHC-stained tissue microarray showed that METTL3 protein levels in CSPC and CRPC. B Statistical results of the IHC-stained tissue microarray showing METTL3 protein levels in CRPC vs CSPC. C, D Visually analyze the transcriptome data from the GEO database to compare the mRNA levels of METTL3 (GSE32269, clinical CRPC/CSPC tissue data and GSE33316, PDX model before vs after castration). E, F The correlation of METTL3 and HRAS&MEK2 protein expression was verified by an IHC-stained tissue microarray. G TCGA database was analyzed and we found that METTL3 and ERK1/2 downstream genes are widely positively correlated at the RNA level.
Fig. 3
Fig. 3. Reduced METTL3 decreases cell proliferation and migration by regulating the ERK pathway.
A The RNA levels of METTL3, HRAS and MEK2 were detected in LNcap-AI and C4-2 cells respectively transfected with sh-con and sh-METTL3 by RT-qPCR, and GAPDH was used as an internal reference. B The m6A levels were detected in 4 cell lines (LNcap-AI and C4-2transfected with sh-con, sh-METTL3, respectively) by dot-blotting. C The protein levels of METTL3, HRAS and MEK2 and phosphorylation of ERK1/2 were detected in 4 cell lines (LNcap-AI and C4-2 respectively transfected with sh-con, sh-METTL3) by Western blotting, and GAPDH was used as internal reference. D An MTT assay was used to detect the changes in cell viability after METTL3 knockdown. E The changes in cell proliferation after METTL3 knockdown were detected by plate cloning assay. Statistical results (right side) of the above proliferation assay. F Transwell assays were used to detect the changes in cell migration and invasion after METTL3 knockdown. G, H After overexpression of HRAS and MEK2 in LNCap-AI sh-METTL3 cells, the changes in RNA (G) and protein levels (H) were detected to determine knockdown efficiency. I After overexpression of HRAS and MEK2 in LNCap-AI sh-METTL3 cells, the changes in cell viability were observed by MTT assay.
Fig. 4
Fig. 4. Overexpression of METTL3 rather than catalytic mutation of METTL3 increases cell proliferation and migration by up-regulating the ERK pathway.
A The mRNA levels of METTL3, HRAS and MEK2 were observed in LNCaP cells overexpressing METTL3 (oe-M3), the catalytic mutant form(oe-M3-mut) and the control group (oe-con). B The m6A levels were detected in LNCaP overexpressing METTL3 (oe-M3), catalytic mutant form (oe-M3-mut) and control group (oe-con) cell lines by dot-blotting. C The protein levels of METTL3, HRAS, MEK2 and phosphorylation of ERK1/2 were detected in LNCaP overexpressing METTL3 (oe-M3), catalytic mutant form (oe-M3-mut) and control group (oe-con) by Western blotting, and GAPDH was used as internal reference. D An MTT assay was used to detect the changes of cell viability after overexpression of METTL3 and its catalytic domain mutants. E The changes of cell proliferation after overexpression of METTL3 and its catalytic domain mutants were detected by plate cloning assay. F Transwell assays were used to detect the changes of cell migration and invasion ability after overexpression of METTL3 and its catalytic domain mutants. G, H After knockdown of HRAS and MEK2 in LNCap oe-METTL3, the changes of RNA (G) and protein levels (H) were detected to determine knockdown efficiency. I After knockdown of HRAS, MEK2, HRAS & MEK2 in LNCap oe-METTL3, the changes of cell viability were observed by MTT assay. J After treatment selumetinib (MAPK pathway inhibitor) in LNCap oe-METTL3, the changes of cell viability compared with LNCap oe-METTL3-DMSO and LNCap oe-METTL3-mut were observed by MTT assay.
Fig. 5
Fig. 5. The m6A modification of HRAS and MEK2 mediates different mechanisms to regulate their respective protein levels.
A The results of MERIP-seq performed by C4-2 sh-con and C4-2 sh-METTL3 cell lines showed that the m6A modification sites of HRAS and MEK2. B Schematic representation of m6A position of HRAS and MEK2. C The results of MeRIP-qPCR showed that the enrichment of HRAS and MEK2 genes changed after METTL3 knockdown in C4-2/LNCap-AI cell line. D The relative ratio of protein to mRNA of HRAS and MEK2 genes in 4 cell lines. E After MG-132 and CHX were used to treat the two cell lines, respectively, the protein level of MEK2 was detected. F. Schematic representation of luciferase plasmid containing 3’UTR of HRAS, 5’UTR of MEK2 and their mutants. G After transfection of four plasmids in C4-2/LNCap-AI sh-con and C4-2/LNCap-AI sh-METTL3 cell lines for 24 h, fluorescence strength of luciferase were detected. H After four plasmids were transfected into LNCap oe-METTL3 and LNCap oe-METTL3-mut cell lines for 24 h, the fluorescence intensity of luciferase was detected. I After Act-D inhibited transcription, the RNA level of HRAS was determined after knocking down METTL3 for 2, 4 and 6 h. J RIP-qPCR was performed with IGF2BP1/2/3 antibody, and the RNA enrichment level of HRAS was detected. K. After knockdown of IGF2BP2, the RNA level of HRAS gene changed in C4-2. L After IGF2BP2 knockdown, the protein level of HRAS gene changed in C4-2. M After act-D inhibited transcription, the RNA level of HRAS decreased after IGF2BP2 knockdown, which indicated that IGF2BP2 knockdown could reduce the stability of HRAS mRNA.
Fig. 6
Fig. 6. High METTL3 expression is involved in the development of resistance to enzalutamide.
A, B Cell viability assay following treatment for 48 h with indicated concentrations of enzalutamide in C4-2/C4-2R and LNCap/LNCapR cell lines. C Western blotting showed the protein alteration of METTL3 in long-term enzalutamide treated in LNCap and C4-2 cell lines. D The total m6A levels of C4-2 and C4-2R cell lines were detected by dot blotting assay. EG qPCR and Western blotting showed the mRNA and protein levels of METTL3, HRAS, MEK2 and phosphorylation of ERK between C4-2R sh-con/LNCapR sh-con and C4-2R sh-METTL3/LNCapR sh-METTL3 cell lines. H An MTT assay was used to detect the changes of cell viability before and after METTL3 knockdown in the C4-2R and LNCapR cell lines. Cells were cultured with enzaluamide (20 nm). A P value of < 0.05 was considered significant. ***represents P < 0.001. I The cell proliferation of C4-2R and LNCapR cell lines before and after METTL3 knockdown was detected by plate cloning assay. J Transwell assays were used to detect the migration and invasion abilities of C4-2R and LNCapR cells before and after METTL3 knockdown.
Fig. 7
Fig. 7. ASO targeting METTL3 combined with enzalutamide inhibits the proliferation of enzalutamide-resistant PCa in vitro and in vivo.
A qPCR results showed the mRNA level of METTL3 transfected with 10 candidate ASO sequences in C4-2R cell line. ASOs were transfected at a concentration of 200 nm and RNA samples were harvested 48 h after transfection. B qPCR results showed the mRNA level of METTL3 transfected with 10 candidate ASO sequences in C4-2R cell line. ASOs were transfected at a concentration of 100 nm and RNA samples were harvested 24 h after transfection. C Dot blotting assay showing the total RNA m6A level of C4-2R cells transfected with ASO-2 at different concentrations and for different times. D, E qPCR assays showed the mRNA levels of METTL3/HRAS/MEK2 in C4-2R cell line after transfection with ASO-2 at different concentrations and for different times. F Western blotting showed the protein levels of METTL3/HRAS/MEK2 in C4-2R cell line after transfection with ASO-2 at different concentrations and for different times. G. Heatmap summarizing the combination index (CI) of ASO-2 and enzalutamide in C4-2R cell line. (CI less than 0.8 was marked with an #). H Xenograft tumor experiment were carried out in nude mice using C4-2R cell line. After tumor formation, ASO-2 or ASO-con was given to different groups, while the enzalutamide was given to all mice. This image shows the nude mice bearing tumor after being killed at the sixth week. I A photo of xenograft tumors in nude mice after dissection. The upper part was the control group, while the lower part shows the ASO-2 treatment group. J The curve depicts the volume change of xenograft tumors in nude mice of control group and ASO-2 experimental group.***represents P < 0.001. K The scatter plot depicts the weight of xenograft tumors in nude mice of control group and ASO-2 experimental group.***represents P < 0.001. L IHC staining showed the protein levels of METTL3, HRAS, MEK2, p-ERK1/2 and Ki-67 in xenografts of control group and ASO-2 experimental group. Statistical analysis are shown below. A P value of < 0.05 was considered significant. *represents P < 0.05, **represents P < 0.01 and ***represents P < 0.001.
Fig. 8
Fig. 8. Schematic describing how the upregulated METTL3&14 in CRPC activated the ERK pathway by regulating protein levels of HRAS and MEK2.
METTL3 enhances RNA stability of HRAS and enhances protein translation of MEK2 to activate the ERK pathway.

Similar articles

Cited by

References

    1. Li J, Xu C, Lee HJ, Ren S, Zi X, Zhang Z, et al. A genomic and epigenomic atlas of prostate cancer in Asian populations. Nature. 2020;580:93–99. doi: 10.1038/s41586-020-2135-x. - DOI - PubMed
    1. Siegel RL, Miller KD, Fuchs HE, Jemal A. Cancer Statistics, 2021. CA Cancer J Clin. 2021;71:7–33. doi: 10.3322/caac.21654. - DOI - PubMed
    1. Davis ID, Martin AJ, Stockler MR, Begbie S, Chi KN, Chowdhury S, et al. Enzalutamide with Standard First-Line Therapy in Metastatic Prostate Cancer. N. Engl J Med. 2019;381:121–31. doi: 10.1056/NEJMoa1903835. - DOI - PubMed
    1. Hussain M, Fizazi K, Saad F, Rathenborg P, Shore N, Ferreira U, et al. Enzalutamide in Men with Nonmetastatic, Castration-Resistant Prostate Cancer. N. Engl J Med. 2018;378:2465–74. doi: 10.1056/NEJMoa1800536. - DOI - PMC - PubMed
    1. Tran C, Ouk S, Clegg NJ, Chen Y, Watson PA, Arora V, et al. Development of a second-generation antiandrogen for treatment of advanced prostate cancer. Science. 2009;324:787–90. doi: 10.1126/science.1168175. - DOI - PMC - PubMed

Publication types