. 2023 Apr 24;9(1):68.
doi: 10.1038/s41531-023-00509-w.

CSF neurochemical profile and cognitive changes in Parkinson's disease with mild cognitive impairment

Affiliations

CSF neurochemical profile and cognitive changes in Parkinson's disease with mild cognitive impairment

Federico Paolini Paoletti et al. NPJ Parkinsons Dis. .

Abstract

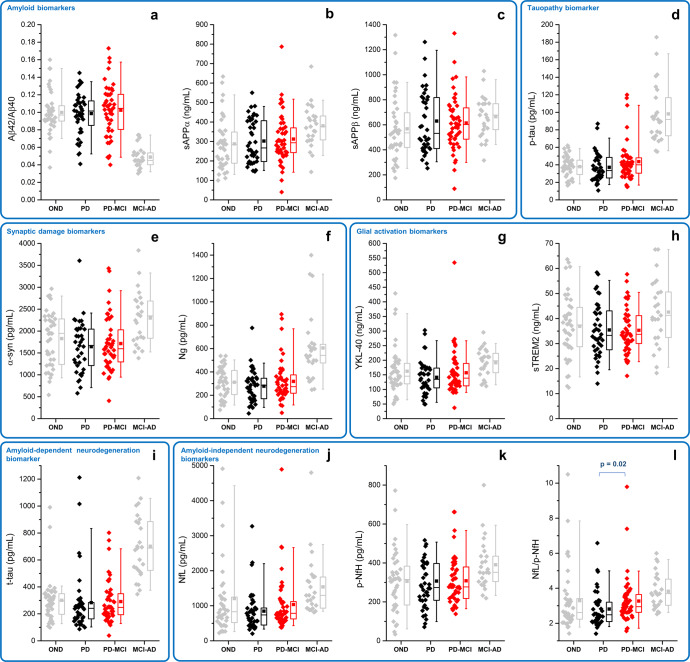
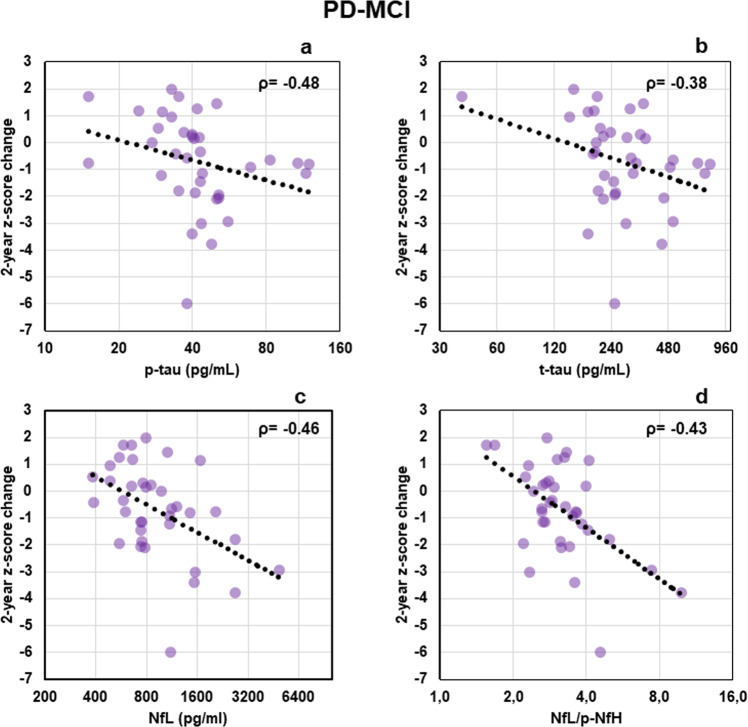
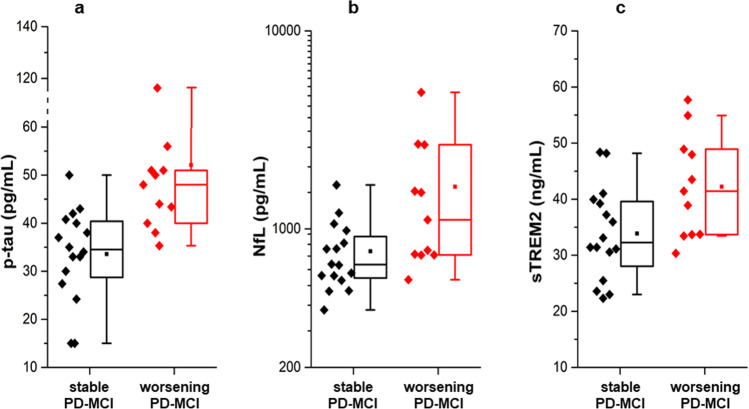
Pathophysiological substrate(s) and progression of Parkinson's disease (PD) with mild cognitive impairment (PD-MCI) are still matter of debate. Baseline cerebrospinal fluid (CSF) neurochemical profile and cognitive changes after 2 years were investigated in a retrospective series of PD-MCI (n = 48), cognitively normal PD (PD-CN, n = 40), prodromal Alzheimer's disease (MCI-AD, n = 25) and cognitively healthy individuals with other neurological diseases (OND, n = 44). CSF biomarkers reflecting amyloidosis (Aβ42/40 ratio, sAPPα, sAPPβ), tauopathy (p-tau), neurodegeneration (t-tau, NfL, p-NfH), synaptic damage (α-syn, neurogranin) and glial activation (sTREM2, YKL-40) were measured. The great majority (88%) of PD-MCI patients was A-/T-/N-. Among all biomarkers considered, only NfL/p-NfH ratio was significantly higher in PD-MCI vs. PD-CN (p = 0.02). After 2 years, one-third of PD-MCI patients worsened; such worsening was associated with higher baseline levels of NfL, p-tau, and sTREM2. PD-MCI is a heterogeneous entity requiring further investigations on larger, longitudinal cohorts with neuropathological verification.


Conflict of interest statement

The authors declare no competing interests.

Figures

Fig. 1
Fig. 1. Box plots relative to biomarkers measured in PD-MCI, PD-CN, MCI-AD and OND.
ac amyloid biomarkers: Aβ42/40, sAPPα, sAPPβ. d tauopathy biomarker: p-tau. e, f synaptic damage biomarkers: α-syn, Ng. g, h glial activation biomarkers: YKL-40, sTREM2. i amyloid-dependent neurodegeneration biomarker: t-tau. j–l amyloid-independent neurodegeneration biomarkers: NfL, p-NfH, NfL/p-NfH. Boxplots summarize the distribution of the data, where the box represents the interquartile range, the horizontal line inside the box represents the median, and the filled square within the box represents the mean. The whiskers extend to the minimum and maximum values within 90% of the data range. P-values have been corrected for multiple group comparisons. MCI-AD mild cognitive impairment due to Alzheimer’s disease, OND healthy cognitive patients with other neurological disorders, PD-CN cognitively normal Parkinson’s disease, PD-MCI Parkinson’s disease with mild cognitive impairment. Aβ42/Aβ40 β-amyloid 1-42/1-40 ratio, NfL neurofilament light chain, Ng neurogranin, p-NfH phosphorylated neurofilament heavy chain, p-tau phosphorylated-tau, sAPPα soluble amyloid precursor protein α, sAPPβ soluble amyloid precursor protein β, sTREM2 soluble triggering receptor expressed on myeloid cells 2, α-syn total α-synuclein, t-tau total tau, YKL-40 chitinase-3-like protein 1.
Fig. 2
Fig. 2. Scatter plots of correlations between biomarkers and Z-score change of cognitive tests.
a p-tau, b t-tau, c NfL, d NfL/p-NfH. The reported correlations produced, in the different groups, Spearman correlation coefficients significantly different from 0 after FDR correction and p-values < 0.05 after a nonparametric regression that considered age, sex, and disease duration as covariates. In order to allow a better visual interpretation of the Spearman correlation, biomarker values are shown on a log2-scale, a log fit was also added for visual purposes. NfL neurofilament light chain, p-NfH phosphorylated neurofilament heavy chain, p-tau phosphorylated tau protein, t-tau total tau protein.
Fig. 3
Fig. 3. Box plots showing differences in CSF biomarkers levels between PD-MCI patients showing at least 2 point-loss at both MMSE and MoCA (worsening PD-MCI, red) and PD-MCI without cognitive worsening (stable PD-MCI, black).
a difference in CSF p-tau between worsening PD-MCI and stable PD-MCI. b difference in CSF NfL between worsening PD-MCI and stable PD-MCI. c difference in CSF sTREM2 between worsening PD-MCI and stable PD-MCI. In boxplots, box height represents the interquartile range, the square represents the mean, the horizontal line represents the median and whiskers represent the 5–95% range. Biomarker values are shown in the log-scale for viewing purposes. NfL neurofilament light chain, p-tau phosphorylated tau protein, sTREM2 soluble triggering receptor expressed on myeloid cells 2.

References

    1. Aarsland D, et al. Parkinson disease-associated cognitive impairment. Nat. Rev. Dis. Prim. 2021;7:47. doi: 10.1038/s41572-021-00280-3. - DOI - PubMed
    1. Jack CR, et al. NIA-AA Research Framework: toward a biological definition of Alzheimer’s disease. Alzheimer’s Dement. 2018;14:535–562. doi: 10.1016/j.jalz.2018.02.018. - DOI - PMC - PubMed
    1. Litvan I, et al. Diagnostic criteria for mild cognitive impairment in Parkinson’s disease: Movement Disorder Society Task Force guidelines. Mov. Disord. 2012;27:349–356. doi: 10.1002/mds.24893. - DOI - PMC - PubMed
    1. Goldman JG, Aggarwal NT, Schroeder CD. Mild cognitive impairment: an update in Parkinson’s disease and lessons learned from Alzheimer’s disease. Neurodegener. Dis. Manag. 2015;5:425–443. doi: 10.2217/nmt.15.34. - DOI - PMC - PubMed
    1. Wallace ER, Segerstrom SC, van Horne CG, Schmitt FA, Koehl LM. Meta-analysis of cognition in Parkinson’s disease mild cognitive impairment and dementia progression. Neuropsychol. Rev. 2022;32:149–160. doi: 10.1007/s11065-021-09502-7. - DOI - PubMed