. 2023 Apr 24;13(1):6636.
doi: 10.1038/s41598-023-33052-y.

Water and heat exchanges in mammalian lungs

Affiliations

Water and heat exchanges in mammalian lungs

Benoit Haut et al. Sci Rep. .

Abstract

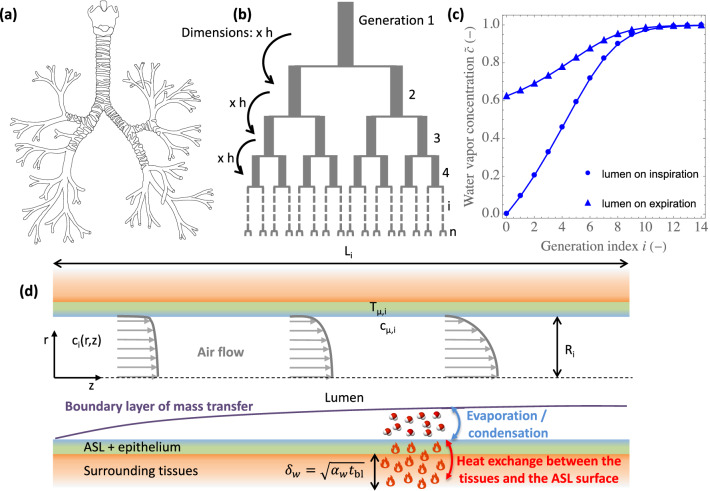
A secondary function of the respiratory system of the mammals is, during inspiration, to heat the air to body temperature and to saturate it with water before it reaches the alveoli. Relying on a mathematical model, we propose a comprehensive analysis of this function, considering all the terrestrial mammals (spanning six orders of magnitude of the body mass, M) and focusing on the sole contribution of the lungs to this air conditioning. The results highlight significant differences between the small and the large mammals, as well as between rest and effort, regarding the spatial distribution of heat and water exchanges in the lungs, and also in terms of regime of mass transfer taking place in the lumen of the airways. Interestingly, the results show that the mammalian lungs appear to be designed just right to fully condition the air at maximal effort (and clearly over-designed at rest, except for the smallest mammals): all generations of the bronchial region of the lungs are mobilized for this purpose, with calculated values of the local evaporation rate of water from the bronchial mucosa that can be very close to the maximal ability of the serous cells to replenish this mucosa with water. For mammals with a mass above a certain threshold ([Formula: see text] kg at rest and [Formula: see text] g at maximal effort), it appears that the maximal value of this evaporation rate scales as [Formula: see text] at rest and [Formula: see text] at maximal effort and that around 40% (at rest) or 50% (at maximal effort) of the water/heat extracted from the lungs during inspiration is returned to the bronchial mucosa during expiration, independently of the mass, due to a subtle coupling between different phenomena. This last result implies that, above these thresholds, the amounts of water and heat extracted from the lungs by the ventilation scale with the mass such as the ventilation rate does (i.e. as [Formula: see text] at rest and [Formula: see text] at maximal effort). Finally, it is worth to mention that these amounts appear to remain limited, but not negligible, when compared to relevant global quantities, even at maximal effort (4-6%).


Conflict of interest statement

The authors declare no competing interests.

Figures

Figure 1
Figure 1
(a) Illustration of the bronchial region of the lungs, with the airways dividing successively into smaller ones. (b) “Weibel A” geometrical representation of the bronchial region of the lungs. (c) Example of water vapor concentration profiles, calculated with the model developed in this paper, within the lumen of the lungs of an adult human at rest. These concentrations are dimensionless: c~=0 is the concentration at the top of the trachea during inspiration and c~=1 is the saturation concentration of water in air at the body temperature. The circles represent the profile on inspiration. The triangles represent the expiration, and we see that significant condensation of water occurs during this expiration. (d) Sketch of an airway in the bronchial region of the lungs, showing the various phenomena involved in air conditioning: the heat exchange between the tissues and the surface of the ASL; the evaporation/condensation of water; the convective/diffusive transport of water vapor in the diffusion boundary layer developing on the ASL–lumen interface; and the establishment of the flow, from a “flat” velocity profile to a parabolic one (if possible, according to the Reynolds number of the flow and the length of the airway).
Figure 2
Figure 2
(ab): Γi as a function of the generation index i, for mammals of different sizes, at rest (a) and at maximal effort (b). The dashed and dotted curves provide values of Γi,lim (Eq. 19) and Γi,sml (Eq. 20), respectively. (cd): Λi as a function of the generation index i, for mammals of different sizes, at rest (c) and at maximal effort (d). The dashed horizontal lines provide values of Λlim (Eq. 21), with ϕ/ψ=1 at rest and ϕ/ψ=0.25 at maximal effort (see Table 1). The dotted lines provide values of Λi,sml (Eq. 23).
Figure 3
Figure 3
Dimensionless water concentration profiles in the lumen, during inspiration (full circles) and expiration (triangles), for mammals of different sizes, at rest (a) and at maximal effort (b). Empty circles: values of c~μ,i.
Figure 4
Figure 4
Ew,i/Ew as a function of the generation index i, for mammals of different sizes, at rest (a) and at maximal effort (b).
Figure 5
Figure 5
Index of the generation in which the largest amount of water is extracted imax as a function of M, at rest (upper continuous curve) and at maximal effort (lower continuous curve), as well as the scaling law given by Eq. (26) (rest: lower dashed line, maximal effort: upper dashed line).
Figure 6
Figure 6
Effectivities of water (or heat) extraction as a function of the mammal mass M, at rest (a) and at maximal effort (b). η1: local effectivity in the trachea; ηimax: ηi for i=imax; η: overall effectivity of water (or heat) extraction. η: analytical approximation of the effectivity (Eq. 29).
Figure 7
Figure 7
(a) Total amounts of water Ew and heat Eh extracted per unit of time from the lungs, as functions of M, at rest (lower continuous curve) and at maximal effort (upper continous curve). The two dashed lines give Ew and Eh (see Eq. 31) at rest (lower line) and at maximal effort (upper line). The insert shows the ratio of Eh at rest to the BMR (upper curve) and the ratio of Eh at maximal effort to the MMR (lower curve). On this insert, the horizontal dashed lines give the ratio of Eh at rest to the BMR (upper curve) and the ratio of Eh at maximal effort to the MMR (lower curve). To compute these curves, we have assumed that a mammal of 70 kg has a BMR of 80 W and a MMR of 1400 W. (b) Time average of the evaporation rate in the trachea J1 as a function of M, at rest (lower curve) and at maximal effort (upper curve). The two dashed lines give J1 (see Eq. 33) at rest (lower line) and at maximal effort (upper line). c0insp=1.22 mol m−3 has been used to generate this figure.

References

    1. Weibel ER. Morphometry of the Human Lung. Academic Press; 1963.
    1. Negus VE. Humidification of the air passages. Thorax. 1952;7:148–151. doi: 10.1136/thx.7.2.148. - DOI - PMC - PubMed
    1. Sherwood L, Klandorf K, Yancey PH. Animal Physiology: From Genes to Organisms. Cengage Learning; 2012.
    1. Walker JEC, Wells RE. Heat and water exchange in the respiratory tract. Am. J. Med. 1961;30:259–267. doi: 10.1016/0002-9343(61)90097-3. - DOI - PubMed
    1. Williams R, Rankin N, Smith T, Galler D, Seakins P. Relationship between humidity and temperature of inspired gas and the function of the airway mucosa. Crit. Care Med. 1996;24:1920–1929. doi: 10.1097/00003246-199611000-00025. - DOI - PubMed

Publication types