. 2023 Apr 24;14(1):2336.
doi: 10.1038/s41467-023-38105-4.

A massively parallel screening platform for converting aptamers into molecular switches

Affiliations

A massively parallel screening platform for converting aptamers into molecular switches

Alex M Yoshikawa et al. Nat Commun. .

Abstract

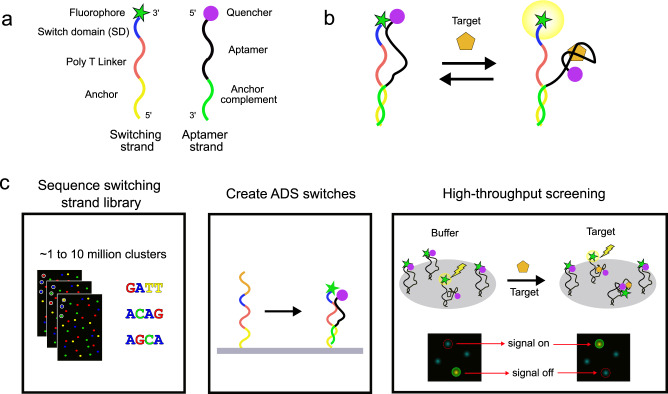
Aptamer-based molecular switches that undergo a binding-induced conformational change have proven valuable for a wide range of applications, such as imaging metabolites in cells, targeted drug delivery, and real-time detection of biomolecules. Since conventional aptamer selection methods do not typically produce aptamers with inherent structure-switching functionality, the aptamers must be converted to molecular switches in a post-selection process. Efforts to engineer such aptamer switches often use rational design approaches based on in silico secondary structure predictions. Unfortunately, existing software cannot accurately model three-dimensional oligonucleotide structures or non-canonical base-pairing, limiting the ability to identify appropriate sequence elements for targeted modification. Here, we describe a massively parallel screening-based strategy that enables the conversion of virtually any aptamer into a molecular switch without requiring any prior knowledge of aptamer structure. Using this approach, we generate multiple switches from a previously published ATP aptamer as well as a newly-selected boronic acid base-modified aptamer for glucose, which respectively undergo signal-on and signal-off switching upon binding their molecular targets with second-scale kinetics. Notably, our glucose-responsive switch achieves ~30-fold greater sensitivity than a previously-reported natural DNA-based switch. We believe our approach could offer a generalizable strategy for producing target-specific switches from a wide range of aptamers.


Conflict of interest statement

The authors declare no competing interests.

Figures

Fig. 1
Fig. 1. Overview of the ADS construct and the high-throughput screening process used to convert known aptamers to molecular switches.
a Design of the fluorophore-labeled switching strand and quencher-labeled aptamer strand. b Target-induced conformational changes in the ADS construct result in a change in distance between the fluorophore and quencher, providing an optical readout. c Overview of the screening process. First, the switching strand library is sequenced on the flow-cell. Second, the ADS constructs are assembled on the surface of the flow-cell via addition of aptamer strands. Lastly, target-responsive molecular switches are identified by sequentially imaging the flow-cell in buffer alone and with the target molecule. Imaging data from each ADS construct cluster reveals the presence of switches for which target binding results in increased (signal-on) or decreased (signal-off) fluorescence.
Fig. 2
Fig. 2. Analysis of the 1000 best-performing ADS sequences.
a Histogram of the frequency with which each base-position within the ATP aptamer was complementary to an SD sequence. This analysis was based only on the longest complementary region for each SD, with complementary regions of <3 nucleotides discarded. Nucleotides at each position in the aptamer are labeled above the histogram. Source data are provided as a Source Data file. b Histogram of Smith-Waterman similarity distances between the ATP aptamer and the reverse-complement of the top 1000 SDs from our screen. Source data are provided as a Source Data file. c Secondary structure of the ATP aptamer as previously discovered via NMR. Boxed regions m1, m2, and m3 indicate segments complementary to the three recurring SD motifs that we identified.
Fig. 3
Fig. 3. Identification and characterization of ATP aptamer switches.
a Results from the high-throughput screen of switching domains for the ATP aptamer. Orange and blue bars respectively represent the cluster intensity in buffer and 500 μM ATP. Data are presented as mean values (n = 5 replicates) and error bars represent the standard deviation of the measurements. Individual data points are overlayed as black dots. Source data are provided as a Source Data file. b Extracted images of individual ATP-responsive ADS clusters (red circle) on the MiSeq flow-cell from multiple buffer and ATP cycles. c Validation of selected ADS constructs identified from the high-throughput screen. 50 nM fluorophore - and quencher-labeled ADS construct was incubated with various concentrations of ATP and measured on a plate reader (n = 4 replicates). A two independent binding site model was used to fit the raw data and normalize the binding signals between 0 and 1, as represented by the solid lines. Data are presented as mean values and error bars represent the standard deviation of the measurements. Source data are provided as a Source Data file.
Fig. 4
Fig. 4. Analysis of the top 1000 unique glucose SD sequences.
a Predicted secondary structure of the phenylboronic acid-modified glucose aptamer NNGmin. Red bolded Ts denote location of modifications. The boxed region m1 indicates a motif that was highly recurrent among the sequence elements targeted by our top SDs. b Histogram of the frequency with which each aptamer base-position was complementary to an SD. Source data are provided as a Source Data file. c Histogram of Smith-Waterman similarity distances between the glucose aptamer and the reverse-complement of the top 1000 SD sequences. Source data are provided as a Source Data file.
Fig. 5
Fig. 5. Identification and characterization of phenylboronic acid-modified aptamer switches for glucose.
a Analysis of the top four aptamer switch clusters identified in our flow-cell screen. Orange and blue bars represent cluster intensity in buffer and 10 mM glucose, respectively. Data are presented as mean values (n = 4 replicates) and error bars represent the standard deviation of the measurements. Individual data points are overlayed as black dots. Source data are provided as a Source Data file. b Extracted images of clusters glu-1, −2, and −3 (red circles) on the MiSeq flow cell for both the buffer and glucose cycles. c Validation of the glucose affinity of the four aptamers shown in panel A. 50 nM labeled ADS construct was incubated with various concentrations of glucose and the fluorescence signal was measured on a plate reader. The solid lines represent the fitted single binding site model. Data are presented as mean values (n = 3 replicates) and error bars represent the standard deviation of the measurements. Source data are provided as a Source Data file.

Similar articles

Cited by

References

    1. Serganov A, Nudler E. A decade of riboswitches. Cell. 2013;152:17–24. doi: 10.1016/j.cell.2012.12.024. - DOI - PMC - PubMed
    1. Mandal M, Breaker RR. Gene regulation by riboswitches. Nat. Rev. Mol. Cell Biol. 2004;5:451–463. doi: 10.1038/nrm1403. - DOI - PubMed
    1. Wittmann A, Suess B. Engineered riboswitches: expanding researchers’ toolbox with synthetic RNA regulators. FEBS Lett. 2012;586:2076–2083. doi: 10.1016/j.febslet.2012.02.038. - DOI - PubMed
    1. Thavarajah W, et al. Point-of-use detection of environmental fluoride via a cell-free riboswitch-based biosensor. ACS Synth. Biol. 2020;9:10–18. doi: 10.1021/acssynbio.9b00347. - DOI - PMC - PubMed
    1. Paige JS, Nguyen-Duc T, Song W, Jaffrey SR. Fluorescence imaging of cellular metabolites with RNA. Science (1979) 2012;335:1194. - PMC - PubMed

Publication types