. 2023 Apr 24;13(1):6642.
doi: 10.1038/s41598-023-33769-w.

Standardized Centella asiatica (ECa 233) extract decreased pain hypersensitivity development in a male mouse model of chronic inflammatory temporomandibular disorder

Affiliations

Standardized Centella asiatica (ECa 233) extract decreased pain hypersensitivity development in a male mouse model of chronic inflammatory temporomandibular disorder

Nattapon Rotpenpian et al. Sci Rep. .

Erratum in

Abstract

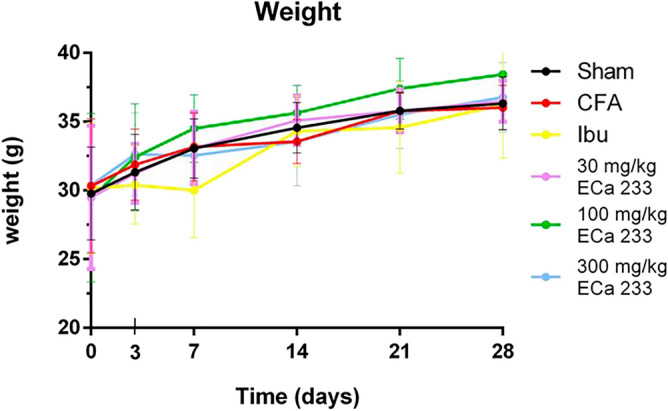
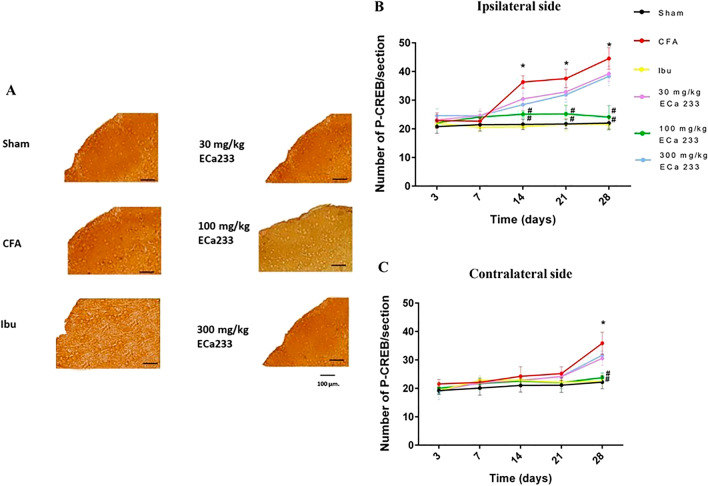
Chronic inflammatory temporomandibular disorder (TMD) pain has a high prevalence, and available nonspecific treatments have adverse side effects. ECa 233, a standardized Centella asiatica extract, is highly anti-inflammatory and safe. We investigated its therapeutic effects by injecting complete Freund's adjuvant (CFA) into right temporomandibular joint of mice and administering either ibuprofen or ECa 233 (30, 100, and 300 mg/kg) for 28 days. Inflammatory and nociceptive markers, bone density, and pain hypersensitivity were examined. CFA decreased ipsilateral bone density, suggesting inflammation localization, which ipsilaterally caused immediate calcitonin gene-related peptide elevation in the trigeminal ganglia (TG) and trigeminal subnucleus caudalis (TNC), followed by late increase of NaV1.7 in TG and of p-CREB and activation of microglia in TNC. Contralaterally, only p-CREB and activated microglia in TNC showed delayed increase. Pain hypersensitivity, which developed early ipsilaterally, but late contralaterally, was reduced by ibuprofen and ECa 233 (30 or 100 mg/kg). However, ibuprofen and only 100-mg/kg ECa 233 effectively mitigated marker elevation. This suggests 30-mg/kg ECa 233 was antinociceptive, whereas 100-mg/kg ECa 233 was both anti-inflammatory and antinociceptive. ECa 233 may be alternatively and safely used for treating chronic inflammatory TMD pain, showing an inverted U-shaped dose-response relationship with maximal effect at 100 mg/kg.


Conflict of interest statement

N.P. is currently an instructor at Faculty of Medicine Siriraj Hospital, Mahidol University, Thailand. He has received a research grant (R016331041) from Siriraj Research Fund (SRF) type 1, Faculty of Medicine Siriraj Hospital, Mahidol University. Other authors declare no financial relationships or activities with any organizations that might have an influence on the submitted work.

Figures

Figure 1
Figure 1
No difference in weight in all groups at every time point (mean ± SEM; n = 9, two-way analysis of variance). CFA, complete Freund’s adjuvant; Ibu, ibuprofen.
Figure 2
Figure 2
Pain response scores tested by von Frey filament and cold acetone tests performed at different time points in all groups. In the complete Freund’s adjuvant (CFA) group, the pain scores of all behavioral tests significantly increased on the ipsilateral side at post–CFA-injection days 14 [F(5,48) = 16.187, P < 0.05] and 21 [F(5,48) = 15.159, P < 0.05], and 28 [F(5,48) = 18.299, P < 0.05] as per von-Frey test and at days 14 [F(5,48) = 11.367, P < 0.05], 21 [F(5,48) = 12.357, P < 0.05] and 28 [F(5,48) = 17.045, P < 0.05] as per cold acetone test, and on the contralateral side at post-CFA-injection day 28 [F(5,48) = 19.543, P < 0.05, F(5,48) = 17.697, P < 0.05, von-Frey test and cold acetone test, respectively]. In the Ibu, 30ECa, and 100ECa groups, the pain scores significantly decreased on the ipsilateral side, but not in the 300ECa group, at post–CFA-injection days 14, 21, and 28 {as per the von-Frey test, Ibu: [F(5,48) = 17.299, P < 0.05], [F(5,48) = 16.199, P < 0.05], and [F(5,48) = 17.299, P < 0.05]; 30ECa: [F(5,48) = 16.215, P < 0.05], [F(5,48) = 16.058, P < 0.05], and [F(5,48) = 16.192, P < 0.05]; 100ECa: [F(5,48) = 18.252, P < 0.05], [F(5,48) = 16.358, P < 0.05], and [F(5,48) = 16.014, P < 0.05]; and 300ECa: [F(5,48) = 28.512, P = 0.159], [F(5,48) = 26.358, P = 0.125], and [F(5,48) = 26.514, P = 0.201] and as per the cold acetone test, Ibu: [F(5,48) = 15.211, P < 0.05], [F(5,48) = 14.992, P < 0.05], and [F(5,48) = 16.129, P < 0.05]; 30ECa: [F(5,48) = 16.058, P < 0.05], [F(5,48) = 15.018, P < 0.05], and [F(5,48) = 16.047, P < 0.05]; 100ECa: [F(5,48) = 17.931, P < 0.05], [F(5,48) = 16.308, P < 0.05], and [F(5,48) = 16.703, P < 0.05]; and 300ECa: [F(5,48) = 21.434, P = 0.149], [F(5,48) = 25.384, P = 0.135], and [F(5,48) = 26.014, P = 0.230]}. On the contralateral side, the pain scores significantly decreased in the Ibu, 30ECa, and 100ECa groups at post–CFA-injection day 28 for von-Frey test (Ibu: [F (5,48) = 11.251, P < 0.05]; 30ECa: [F(5,48) = 10.267, P < 0.05]; 100ECa: [F(5,48) = 11.004, P < 0.05]) for cold acetone test (Ibu: [F(5,48) = 10.501, P < 0.05]; 30ECa: [F(5,48) = 10.707, P < 0.05]; 100ECa: [F(5,48) = 10.804, P < 0.05]) compared with that in the CFA group. (mean ± SEM; n = 9; *P < 0.05 compared with the Sham group, #P < 0.05 compared with the CFA group, two-way analysis of variance followed by Fisher’s least significant difference post hoc test).
Figure 3
Figure 3
Bone density changes in the condylar head of temporomandibular joints (TMJs) determined by micro–computed tomography (micro-CT). (a,b) Sample images of micro-CT scans of the ipsilateral and contralateral TMJs at post–CFA-injection day 28, scale bar = 1 mm. (c) Bone density changes on the ipsilateral side of the TMJ’s condylar head. The groups treated with complete Freund’s adjuvant, 30 mg/kg ECa 233, and 300 mg/kg ECa 233 (CFA, 30ECa, and 300ECa groups, respectively) had significant bone density reductions on the ipsilateral side at post–CFA-injection days 21 (CFA [F(5,48) = 60.339, P < 0.05], 30ECa [F(5,48) = 58.931, P < 0.05], 300ECa [(5,48) = 61.135, P < 0.05]) and 28 (CFA [F(5,48) = 49.158, P < 0.05], 30ECa [(5,48) = 48.621, P < 0.05], 300ECa [(5,48) = 47.996, P < 0.05]) compared with the Sham group whereas the Ibu and 100ECa groups did not showed bone density reduction on both days (day 21: Ibu [F(5,48) = 77.678, P = 0.324], 100ECa [F(5,48) = 87.678, P = 0.424]; day 28: Ibu [F(5,48) = 78.728, P = 0.334], 100ECa [F(5,48) = 74.018, P = 0.384]) (mean ± SEM; n = 3/group/time point; *P < 0.05, two-way analysis of variance followed by Fisher’s least significant difference post hoc test). (d) Bone density changes on the contralateral side of the TMJ’s condylar head. No difference was observed in bone density on the contralateral side in all groups. (mean ± SEM; n = 3/group/time point).
Figure 4
Figure 4
Calcitonin gene-related peptide (CGRP) expression in TGs in all groups at different time points. (a) An example of CGRP staining by immunohistochemistry at the ipsilateral trigeminal ganglia (TG) at post–CFA-injection day 3, scale bar = 20 µm. (b,c) Percentage of positive CGRP neurons per the total number of neurons in different groups. The CGRP expression in the complete Freund’s adjuvant–treated (CFA) group increased in the ipsilateral TG at post–CFA-injection days 3 [F(5,48) = 17.046, P < 0.05], 7 [F(5,48) = 16.046, P < 0.05], and 14 [F(5,48) = 15.048, P < 0.05] compared with that in the Sham group. Likewise, the CGRP expression in the groups treated with ibuprofen and 100 mg/kg ECa 233 (Ibu and 100ECa groups, respectively) significantly decreased in the ipsilateral TG at post–CFA-injection days 3 (Ibu [F(5,48) = 16.541, P < 0.05], 100ECa [F(5,48) = 17.291, P < 0.05]), 7 (Ibu [F(5,48) = 13.421, P < 0.05], 100ECa [F(5,53) = 14.913, P < 0.05]), and 14 (Ibu [F(5,48) = 13.421, P < 0.05], 100ECa [F(5,53) = 15.931, P < 0.05]), compared with that in the CFA group. In contrast to Ibu and 100ECa groups, the 30ECa and 300ECa groups could not show the decreased CGRP expression (day 3: 30ECa [F(5,48) = 33.541, P = 0.254], 300ECa [F(5,48) = 40.129, P = 0.354]; day 7: 30ECa [F(5,48) = 32.134, P = 0.265], 300ECa [F(5,48) = 41.229, P = 0.334]; day 14: 30ECa [F(5,48) = 31.334, P = 0.255], 300ECa [F(5,48) = 40.091, P = 0.374]). In the contralateral TG, the CGRP expression did not change by CFA on any days (day 3: [F(5,48) = 31.254, P = 0.220]; day 7: [F(5,48) = 30.324, P = 0.213]; day 14: [F(5,48) = 33.424, P = 0.296]). (mean ± SEM; n = 3/group/time point; *P < 0.05 compared with the Sham group, #P < 0.05 compared with the CFA group, two-way analysis of variance followed by Fisher’s least significant difference post hoc test).
Figure 5
Figure 5
Voltage-gated sodium ion channel 1.7 (NaV1.7) expression in TGs in all groups at different time points. (a) An example of NaV1.7 staining by immunohistochemistry at the ipsilateral TG at post–CFA-injection day 28, scale bar = 20 µm. (b,c) Percentage of positive NaV1.7 neurons per total number of neurons in different groups. At post–CFA-injection days 21 and 28 in the ipsilateral TG, the NaV1.7 expression in the complete Freund’s adjuvant–treated (CFA) group increased compared with that in the Sham group (day 21 [F(5,48) = 9.463, P < 0.05], day 28 [F(5,48) = 8.633, P < 0.05]), whereas that in the groups treated with ibuprofen and 100 mg/kg ECa 233 (Ibu and 100ECa groups, respectively) significantly decreased (day 21: Ibu [F(5,48) = 10.521, P < 0.05], 100ECa [F(5,48) = 12.545, P < 0.05]; day 28: Ibu [F(5,48) = 9.452, P < 0.05], 100ECa [F(5,48) = 10.985, P < 0.05]) compared with that in the CFA group. Both 30ECa and 300ECa showed no difference from the CFA group (day 21: 30ECa [F(5,48) = 5.9372, P = 0.183], 300ECa [F(5,48) = 6.937, P = 0.192]; day 28: 30ECa [F(5,48) = 5.342, P = 0.173], 300ECa [F(5,48) = 6.937, P = 0.192]). In the contralateral TG, CFA did not change the NaV1.7 expression (day 21 [F(5,48) = 1.925, P = 0.132], day 28 [F(5,48) = 1.895, P = 0.113]) (mean ± SEM; n = 3/groups at each time point; *P < 0.05 compared with the Sham group, #P < 0.05 compared with the CFA group, two-way analysis of variance followed by Fisher’s least significant difference post hoc test).
Figure 6
Figure 6
Calcitonin gene-related peptide (CGRP) expression in the trigeminal subnucleus caudalis (TNC) in all groups at different time points. (a) An example of CGRP staining by immunohistochemistry at the ipsilateral TNC at post–CFA-injection day 3, scale bar = 100 µm. (b,c) Number of positive CGRP expression in both sides of TNC in different groups. At post–CFA-injection days 3, 7, and 14 in the ipsilateral TNC, the CGRP expression in the complete Freund’s adjuvant–treated (CFA) group increased compared with that in the Sham group (day 3 [F(5,48) = 13.106, P < 0.05], day 7 [F(5,48) = 15.826, P < 0.05], day14 [F(5,48) = 14.806, P < 0.05]), whereas that in the groups treated with ibuprofen and 100 mg/kg ECa 233 (Ibu and 100ECa groups, respectively) significantly decreased compared with that in the CFA group (day 3: Ibu [F(5,48) = 10.452, P < 0.05], 100ECa [F(5,48) = 12.885, P < 0.05]; day 7: Ibu [F(5,48) = 12.342, P < 0.05], 100ECa [F(5,48) = 12.185, P < 0.05]; day 14: Ibu [F(5,48) = 13.452, P < 0.05], 100ECa [F(5,48) = 12.235, P < 0.05]) Both 30ECa and 300ECa showed no difference from the CFA group (day 3: 30ECa [F(5,48) = 21.485, P = 0.221], 300ECa [F(5,48) = 22.485, P = 0.281]; day 7: 30ECa [F(5,48) = 22.545, P = 0.261], 300ECa [F(5,48) = 21.345, P = 0.293]; day 14: 30ECa [F(5,48) = 20.698, P = 0.231], 300ECa [F(5,48) = 20.435, P = 0.267]). In the contralateral TNC, CFA injection did not change the CGRP expression (day 3 [F(5,48) = 19.944, P = 0.363], day 7 [F(5,48) = 17.444, P = 0.263], day 14 [F(5,48) = 20.124, P = 0.353]) (mean ± SEM; n = 3/group/time point; *P < 0.05 compared with the Sham group, #P < 0.05 compared with the CFA group, two-way analysis of variance followed by Fisher’s least significant difference post hoc test).
Figure 7
Figure 7
Phosphorylated cAMP response element-binding protein (p-CREB) expression in trigeminal subnucleus caudalis (TNC) in all groups at different time points. (A) An example of p-CREB staining by immunohistochemistry at the ipsilateral TNC at post–CFA-injection day 28, scale bar = 100 µm. (B,C) Expression of p-CREB in both sides of TNCs in different groups. In the ipsilateral TNC at post–CFA-injection days 14, 21, and 28 and in the contralateral TNC at post–CFA-injection day 28, the p-CREB expression in the complete Freund’s adjuvant–treated (CFA) group increased compared with that in the Sham group (on the ipsilateral side: day 14 [F(5,48) = 35.179, P < 0.05], day 21 [F(5,48) = 34.179, P < 0.05], day 28 [F(5,48) = 33.789, P < 0.05]; on the contralateral side: day 28 [F(5,48) = 26.885, P < 0.05]), whereas that in the groups treated with ibuprofen and 100 mg/kg ECa 233 (Ibu and 100ECa groups, respectively) significantly decreased compared with that in the CFA group (day 14 on the ipsilateral side: Ibu [F(5,48) = 21.225, P < 0.05], 100ECa [F(5,48) = 25.247, P < 0.05]; day 21 on the ipsilateral side: Ibu [F(5,48) = 22.375, P < 0.05], 100ECa [F(5,48) = 26.027, P < 0.05]; day 28 on the ipsilateral side: Ibu [F(5,48) = 24.335, P < 0.05], 100ECa [F(5,48) = 26.247, P < 0.05]; day 28 on the contralateral side: Ibu [F(5,48) = 26.245, P < 0.05], 100ECa [F(5,48) = 27.161, P < 0.05]). Both 30ECa and 300ECa showed no difference from the CFA group (day 14 on the ipsilateral side: 30ECa [F(5,48) = 40.485, P = 0.207], 300ECa [F(5,48) = 39.532, P = 0.236]; day 21 on the ipsilateral side: 30ECa [F(5,48) = 40.532, P = 0.196], 300ECa [F(5,48) = 39.532, P = 0.179]; day 28 on the ipsilateral side: 30ECa [F(5,48) = 41.485, P = 0.187], 300ECa [F(5,48) = 39.852, P = 0.196]; day 28 on the contralateral side: 30ECa [F(5,48) = 40.495, P = 0.197], 300ECa [F(5,48) = 39.972, P = 0.194]) (mean ± SEM; n = 3/group at each time; *P < 0.05 compared with the Sham group, #P < 0.05 compared with the CFA group, two-way analysis of variance followed by Fisher’s least significant difference post hoc test).
Figure 8
Figure 8
Expression of activated microglia in trigeminal subnucleus caudalis (TNC) in all groups at different time points. (A) An example of activated microglia staining by immunohistochemistry at the ipsilateral TNC at post–CFA-injection day 28, scale bar = 100 µm. (B,C) Expression of activated microglia on both sides of TNC in the different groups. In the ipsilateral TNC at post–CFA-injection days 14, 21, and 28 and in the contralateral TNC at post–CFA-injection day 28, the expression of activated microglia in the complete Freund’s adjuvant–treated (CFA) group increased compared with that in the Sham group (on the ipsilateral side: day 14 [F(5,48) = 32.013, P < 0.05], day 21 [F(5,48) = 29.084, P < 0.05], day 28 [F(5,48) = 34.027, P < 0.05]; on the contralateral side: day 28 [F(5,53) = 25.521, P < 0.05]), whereas that in the groups treated with ibuprofen and 100 mg/kg ECa 233 (Ibu and 100ECa groups, respectively) significantly decreased compared with that in the CFA group (day 14 on the ipsilateral side: Ibu [F(5,48) = 20.135, P < 0.05], 100ECa [F(5,48) = 22.154, P < 0.05]; day 21 on the ipsilateral side: Ibu [F(5,48) = 22.500, P < 0.05], 100ECa [F(5,48) = 25.034, P < 0.05]; day 28 on the ipsilateral side: Ibu [F(5,48) = 24.335, P < 0.05], 100ECa [F(5,48) = 26.154, P < 0.05]; day 28 on the contralateral side: Ibu [F(5,48) = 27.135, P < 0.05], 100ECa [F(5,48) = 27.247, P < 0.05]). Both 30ECa and 300ECa showed no difference from the CFA group (day 14 on the ipsilateral side: 30ECa [F(5,48) = 35.545, P = 0.315], 300ECa [F(5,48) = 36.005, P = 0.309]; day 21 on the ipsilateral side: 30ECa [F(5,48) = 35.785, P = 0.335], 300ECa [F(5,48) = 40.005, P = 0.319]; day 28 on the ipsilateral side: 30ECa [F(5,48) = 39.785, P = 0.375], 300ECa [F(5,48) = 41.305, P = 0.329]; day 28 on the contralateral side: 30ECa [F(5,48) = 39.894, P = 0.385], 300ECa [F(5,48) = 42.385, P = 0.362]) (mean ± SEM; n = 3/group/time point; *P < 0.05 compared with the Sham group, #P < 0.05 compared with the CFA group, two-way analysis of variance followed by Fisher’s least significant difference post hoc test).
Figure 9
Figure 9
Expressions of CGRP and NaV1.7 in TG, and expressions of CGRP, p-CREB, and activated microglia in TNC in Sham, CFA, and 100ECa groups at different time points. (a) Expressions of CGRP and NaV1.7 in the ipsilateral TG. (b) Expressions of CGRP, p-CREB, and activated microglia in the ipsilateral TNC. (c) Expressions of CGRP and NaV1.7 in the contralateral TG. (d) Expressions of CGRP, p-CREB, and activated microglia in the contralateral TNC. (mean ± SEM; n = 3/group/time point; *P < 0.05 compared with the Sham group, #P < 0.05 compared with the CFA group, two-way analysis of variance followed by Fisher’s least significant difference post hoc test).

References

    1. Häggman-Henrikson B, et al. Increasing gender differences in the prevalence and chronification of orofacial pain in the population. Pain. 2020;161:1768–1775. doi: 10.1097/j.pain.0000000000001872. - DOI - PMC - PubMed
    1. van Selms MKA, Wiegers JW, van der Meer HA. Temporomandibular disorders, pain in the neck and shoulder area, and headache among musicians. J. Oral Rehabil. 2020;47:132–142. doi: 10.1111/joor.12886. - DOI - PMC - PubMed
    1. Ibi M. Inflammation and temporomandibular joint derangement. Biol. Pharm. Bull. 2019;42:538–542. doi: 10.1248/bpb.b18-00442. - DOI - PubMed
    1. Edelmayer RM, Brederson JD, Jarvis MF, Bitner RS. Biochemical and pharmacological assessment of MAP-kinase signaling along pain pathways in experimental rodent models: A potential tool for the discovery of novel antinociceptive therapeutics. Biochem. Pharmacol. 2014;87:390–398. doi: 10.1016/j.bcp.2013.11.019. - DOI - PubMed
    1. Romero-Reyes M, Uyanik JM. Orofacial pain management: Current perspectives. J. Pain Res. 2014;7:99–115. doi: 10.2147/jpr.s37593. - DOI - PMC - PubMed

Publication types