. 2023 Apr 24;3(1):58.
doi: 10.1038/s43856-023-00277-x.

Impact of age and comorbidities on SARS-CoV-2 vaccine-induced T cell immunity

Collaborators, Affiliations

Impact of age and comorbidities on SARS-CoV-2 vaccine-induced T cell immunity

Lisa Loksø Dietz et al. Commun Med (Lond). .

Abstract

Background: Older age and chronic disease are important risk factors for developing severe COVID-19. At population level, vaccine-induced immunity substantially reduces the risk of severe COVID-19 disease and hospitalization. However, the relative impact of humoral and cellular immunity on protection from breakthrough infection and severe disease is not fully understood.

Methods: In a study cohort of 655 primarily older study participants (median of 63 years (IQR: 51-72)), we determined serum levels of Spike IgG antibodies using a Multiantigen Serological Assay and quantified the frequency of SARS-CoV-2 Spike-specific CD4 + and CD8 + T cells using activation induced marker assay. This enabled characterization of suboptimal vaccine-induced cellular immunity. The risk factors of being a cellular hypo responder were assessed using logistic regression. Further follow-up of study participants allowed for an evaluation of the impact of T cell immunity on breakthrough infections.

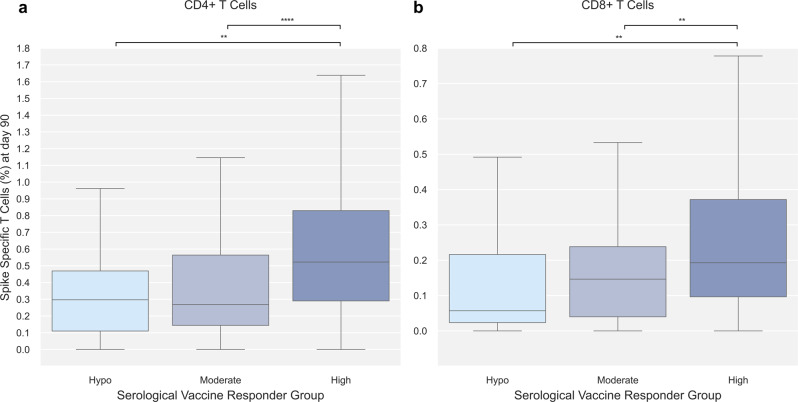
Results: We show reduced serological immunity and frequency of CD4 + Spike-specific T cells in the oldest age group (≥75 years) and higher Charlson Comorbidity Index (CCI) categories. Male sex, age group ≥75 years, and CCI > 0 is associated with an increased likelihood of being a cellular hypo-responder while vaccine type is a significant risk factor. Assessing breakthrough infections, no protective effect of T cell immunity is identified.

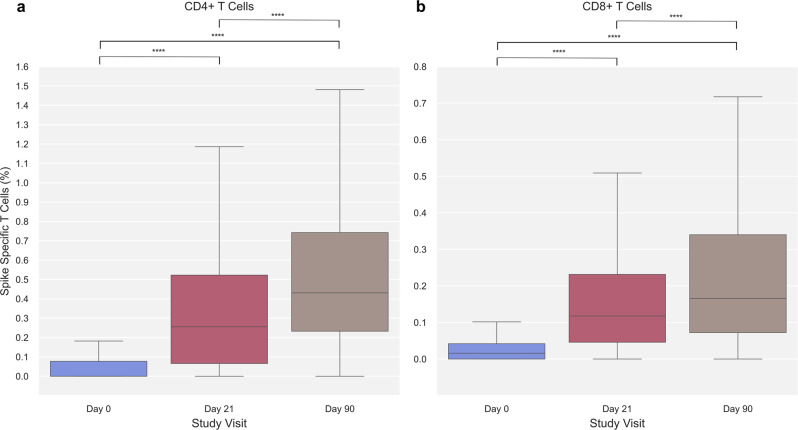
Conclusions: SARS-CoV-2 Spike-specific immune responses in both the cellular and serological compartment of the adaptive immune system increase with each vaccine dose and are progressively lower with older age and higher prevalence of comorbidities. The findings contribute to the understanding of the vaccine response in individuals with increased risk of severe COVID-19 disease and hospitalization.

Plain language summary

Vaccination has proven very effective in protecting against severe disease and hospitalization of people with COVID-19, the disease caused by SARS-CoV-2. It is still unclear, however, how the different components of the immune system respond to SARS-CoV-2 vaccination and protect from infection and severe disease. Two of the most predominant components of the immune system are specialized proteins and cells. The proteins circulate in the blood and help clear the virus by binding to it, while the cells either kill the virus or help other cells to produce more antibodies. Here, we examined the response of these two components to the SARS-CoV-2 vaccine in 655 Danish citizens. The response of both components was lower in people over 75 years old and with other diseases. These findings help in understanding the immune responses following SARS-CoV-2 vaccination in people at increased risk of severe symptoms of COVID-19.


Conflict of interest statement

NBS served as principal investigator in clinical studies from Pfizer and Gilead. All other authors declare no competing interests.

Figures

Fig. 1
Fig. 1. SARS-CoV-2 Spike-specific T cells at each study visit.
a SARS-CoV-2 Spike-specific CD4 + T cells at day 0 (blue), 21 (red), and 90 (brown) (n = 286, 460, and 462, respectively). b SARS-CoV-2 Spike-specific CD8 + T cells at day 0 (blue), 21 (red), and 90 (brown) (n = 272, 444, and 449, respectively). Data was compared using unpaired, non-parametric Mann–Whitney U-test. Error bars show the distribution within 1.5 times IQR. p-value annotation legend: *1.00·10−02 < p ≤ 5.00·10−02, **1.00·10−03 < p ≤ 1.00·10−02, ***1.00·10−04 < p ≤ 1.00·10−03, ****p ≤ 1.00·10−04.
Fig. 2
Fig. 2. SARS-CoV-2 Spike-specific T cells with age and Charlson Comorbidity Index (CCI).
a SARS-CoV-2 Spike-specific CD4 + T cells at 0, 21, and 90 stratified by age group (<65 years [light blue], 65–74 years [blue], ≥75 years [dark blue]). Group sizes are; at day 0 n = 142 (<65 years), n = 54 (65–74 years), n = 90 (≥75 years); at day 21 n = 234 (<65 years), n = 123 (65–74 years), n = 103 (≥75 years); at day 90 n = 214 (<65 years), n = 134 (65–74 years), n = 114 (≥75 years). b SARS-CoV-2 Spike-specific CD8 + T cells at 0, 21, and 90 stratified by age group (<65 years [light blue], 65–74 years [blue], ≥75 years [dark blue]). Group sizes are; at day 0 n = 139 (<65 years), n = 54 (65–74 years), n = 79 (≥75 years); at day 21 n = 233 (<65 years), n = 118 (65–74 years), n = 93 (≥75 years); at day 90 n = 213 (<65 years), n = 130 (65–74 years), n = 106 (≥75 years). c SARS-CoV-2 Spike-specific CD4 + T cells at day 90 in the three age groups stratified by Charlson Comorbidity Index (CCI) (CCI = 0 [light green], CCI = 1–2 [green], CCI > 2 [dark green]). Group sizes are; in age group <65 years n = 175 (CCI = 0), n = 30 (CCI = 1–2), n = 9 (CCI > 2); age group 65–74 years n = 88 (CCI = 0), n = 37 (CCI = 1–2), n = 5 (CCI > 2); age group ≥75 n = 79 (CCI = 0), n = 21 (CCI = 1–2), n = 6 (CCI > 2). d SARS-CoV-2 Spike-specific CD8 + T cells at day 90 in the three age groups stratified by CCI (CCI = 0 [light green], CCI = 1–2 [green], CCI > 2 [dark green]). Group sizes are; in age group <65 years n = 175 (CCI = 0), n = 29 (CCI = 1–2), n = 9 (CCI > 2); age group 65–74 years n = 88 (CCI = 0), n = 37 (CCI = 1–2), n = 5 (CCI > 2); age group ≥75 n = 79 (CCI = 0), n = 21 (CCI = 1–2), n = 6 (CCI > 2). Data was compared using unpaired, non-parametric Mann–Whitney U-test. Error bars show the distribution within 1.5 times IQR. p-value annotation legend: *1.00·10−02 < p ≤ 5.00·10−02, **1.00·10−03 < p ≤ 1.00·10−02, ***1.00·10−04 < p ≤ 1.00·10−03, ****p ≤ 1.00·10−04.
Fig. 3
Fig. 3. SARS-CoV-2 Spike IgG by age and Charlson Comorbidities Index (CCI).
a SARS-CoV-2 Spike IgG arbitrary units (AU)/ml at day 0, 21, and 90 stratified by age group (<65 years [light blue], 65–74 years [blue], ≥75 years [dark blue]). Group sizes are; at day 0 n = 352 (<65 years), n = 154 (65–74 years), n = 144 (≥75 years); at day 21 n = 304 (<65 years), n = 152 (65–74 years), n = 142 (≥75 years); at day 90 n = 238 (<65 years), n = 146 (65–74 years), n = 139 (≥75 years). b SARS-CoV-2 Spike IgG at day 90 in the three age groups stratified by Charlson Comorbidity Index (CCI) (CCI = 0 [light green], CCI = 1–2 [green], CCI > 2 [dark green]). Group sizes are; in age group <65 years n = 195 (CCI = 0), n = 33 (CCI = 1–2), n = 10 (CCI > 2); age group 65–74 years n = 92 (CCI = 0), n = 46 (CCI = 1–2), n = 8 (CCI > 2); age group ≥ 75 n = 97 (CCI = 0), n = 32 (CCI = 1–2), n = 10 (CCI > 2). Data was compared using unpaired, non-parametric Mann–Whitney U-test. Error bars show the distribution within 1.5 times IQR. p-value annotation legend: *1.00·10−02 < p ≤ 5.00·10−02, **1.00·10−03 < p ≤ 1.00·10−02, ***1.00·10−04 < p ≤ 1.00·10−03, ****p ≤ 1.00·10−04.
Fig. 4
Fig. 4. SARS-CoV-2 Spike-specific T cells at day 90 by serological vaccine responder group.
Day 90 SARS-CoV-2 Spike-specific T cells stratified by serological vaccine responder group (Hypo [light blue], Moderate [blue], High [dark blue]). Serological vaccine responder group was defined based on the change in Spike IgG at day 90 relative to their pre-vaccine (baseline) levels: vaccine hypo-, moderate- and high responders were individuals with a log10 fold change of <2, 2-3, or >3 in Spike IgG, respectively. a SARS-CoV-2 Spike-specific CD4 + T cells; n = 46 (Hypo), n = 105 (Moderate), n = 318 (High). b SARS-CoV-2 Spike-specific CD8 + T cells; n = 36 (Hypo), n = 101 (Moderate), n = 309 (High). Data was compared using unpaired, non-parametric Mann–Whitney U-test. Error bars show the distribution within 1.5 times IQR. p-value annotation legend: *1.00·10−02 < p ≤ 5.00·10−02, **: 1.00·10−03 < p ≤ 1.00·10−02, ***1.00·10−04 < p ≤ 1.00·10−03, ****p ≤ 1.00·10−04.
Fig. 5
Fig. 5. Risk factors for cellular COVID-19 vaccine hypo-responsiveness.
a Forest plot of adjusted odds ratios (aOR) for cellular CD4 + hypo-responsiveness with 95% confidence intervals (CI). Number of hypo-responders and responders, respectively, for each variable from top to bottom is; n = 25 and n = 206 (Female), n = 36 and n = 186 (Male), n = 20 and n = 185 (<65 years), n = 11 and n = 123 (65–74 years), n = 30 and n = 84 (≥75 years), n = 36 and n = 306 (CCI = 0), n = 19 and n = 72 (CCI = 1–2), n = 6 and n = 14 (CCI > 2), n = 56 and n = 184 (BNT162b2), n = 5 and n = 208 (mRNA-1273). b Forest plot of adjusted odds ratios (aOR) for cellular CD8 + hypo-responsiveness with 95% confidence intervals. Number of hypo-responders and responders, respectively, for each variable from top to bottom is; n = 55 and n = 172 (Female), n = 61 and n = 152 (Male), n = 44 and n = 160 (<65 years), n = 29 and n = 101 (65–74 years), n = 43 and n = 63 (≥75 years), n = 75 and n = 258 (CCI = 0), n = 32 and n = 55 (CCI = 1–2), n = 9 and n = 11 (CCI > 2), n = 98 and n = 130 (BNT162b2), n = 18 and n = 194 (mRNA-1273). Data was assessed in a multivariable logistical regression including sex, age group, Charlson Comorbidity Index (CCI) score, and vaccine type as predictors. Participants receiving ChAdOx1 as their first dose were excluded from the model given the small sample size (n = 9).

References

    1. Zhu N, et al. A novel coronavirus from patients with Pneumonia in China, 2019. N. Engl. J. Med. 2020;382:727–733. doi: 10.1056/NEJMoa2001017. - DOI - PMC - PubMed
    1. Wu Z, McGoogan JM. Characteristics of and important lessons from the coronavirus disease 2019 (COVID-19) outbreak in China: summary of a report of 72 314 cases from the Chinese center for disease control and prevention. Jama. 2020;323:1239–1242. doi: 10.1001/jama.2020.2648. - DOI - PubMed
    1. Williamson EJ, et al. Factors associated with COVID-19-related death using OpenSAFELY. Nature. 2020;584:430–436. doi: 10.1038/s41586-020-2521-4. - DOI - PMC - PubMed
    1. Søgaard OS, et al. Characteristics associated with serological Covid-19 vaccine response and durability in an older population with significant comorbidity: the Danish nationwide ENFORCE study. Clin. Microbiol. Infect. 2022;28:1126–1133. doi: 10.1016/j.cmi.2022.03.003. - DOI - PMC - PubMed
    1. Emborg, H.-D. et al. Vaccine effectiveness of the BNT162b2 mRNA COVID-19 vaccine against RT-PCR confirmed SARS-CoV-2 infections, hospitalisations and mortality in prioritised risk groups. medRxiv10.1101/2021.05.27.21257583 (2021).