Clinical Trial
. 2023 Jun;29(6):1437-1447.
doi: 10.1038/s41591-023-02326-3. Epub 2023 Apr 24.

Tau-targeting antisense oligonucleotide MAPTRx in mild Alzheimer's disease: a phase 1b, randomized, placebo-controlled trial

Affiliations
Clinical Trial

Tau-targeting antisense oligonucleotide MAPTRx in mild Alzheimer's disease: a phase 1b, randomized, placebo-controlled trial

Catherine J Mummery et al. Nat Med. 2023 Jun.

Erratum in

Abstract

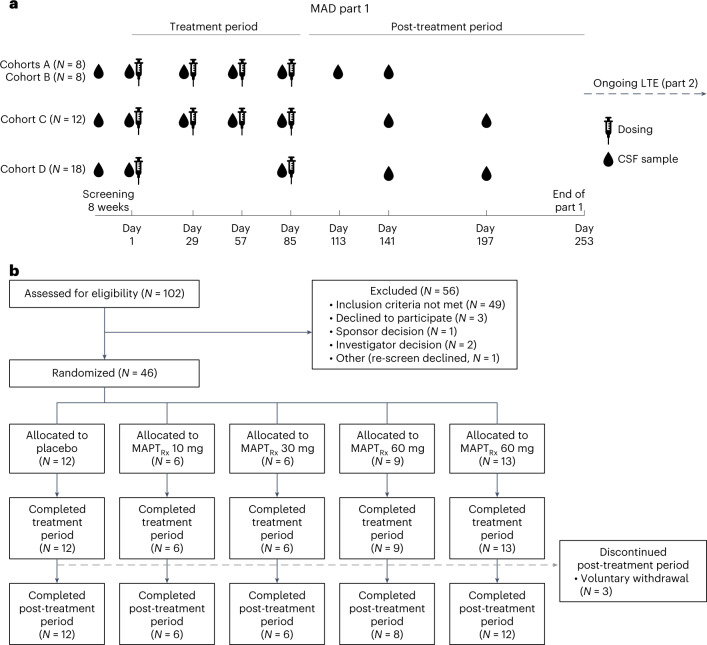
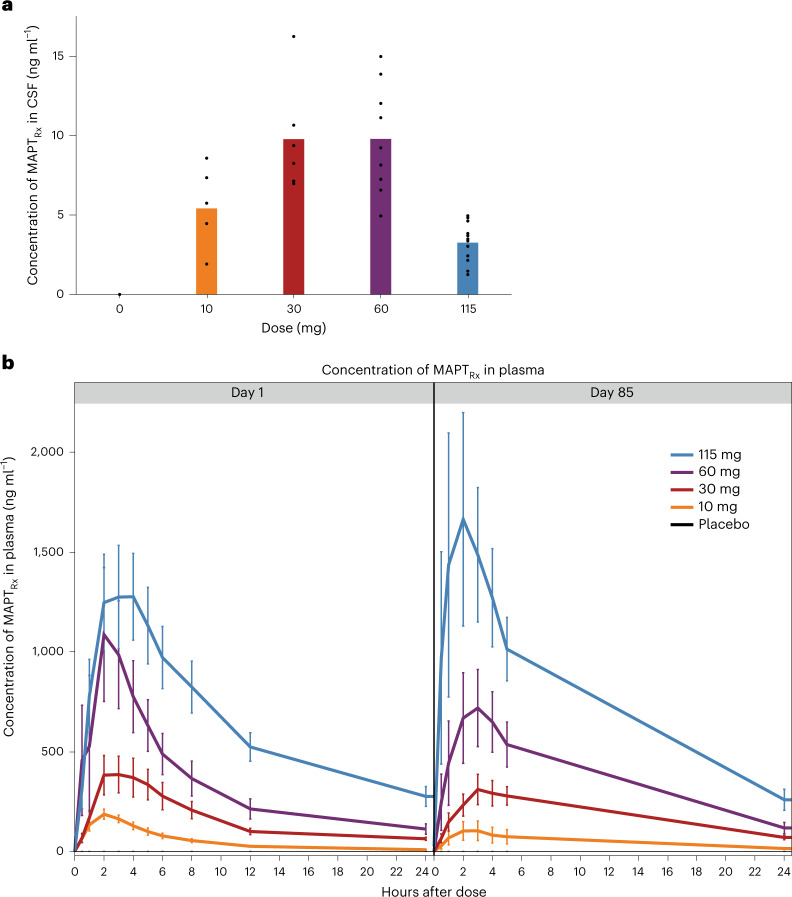
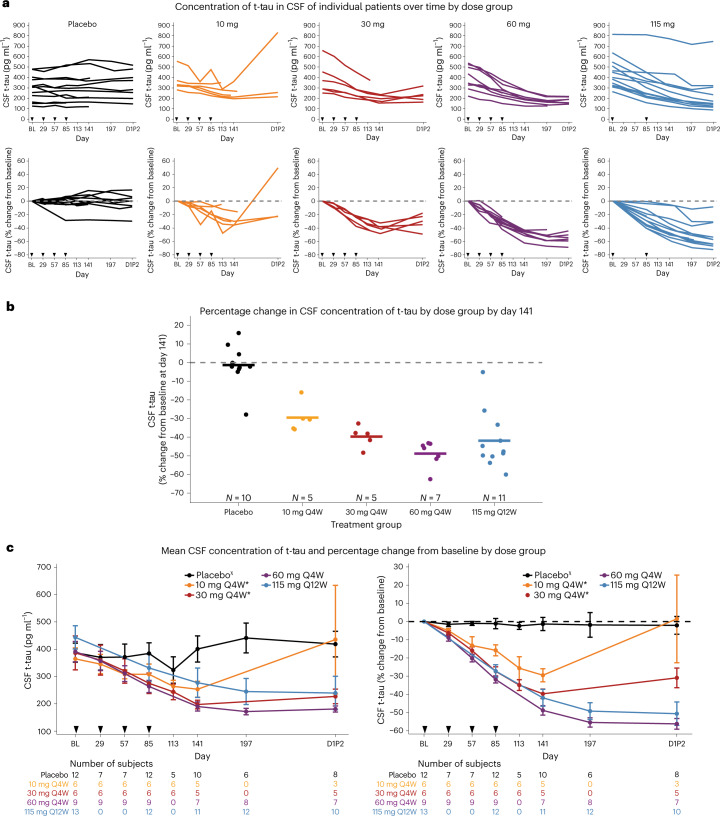
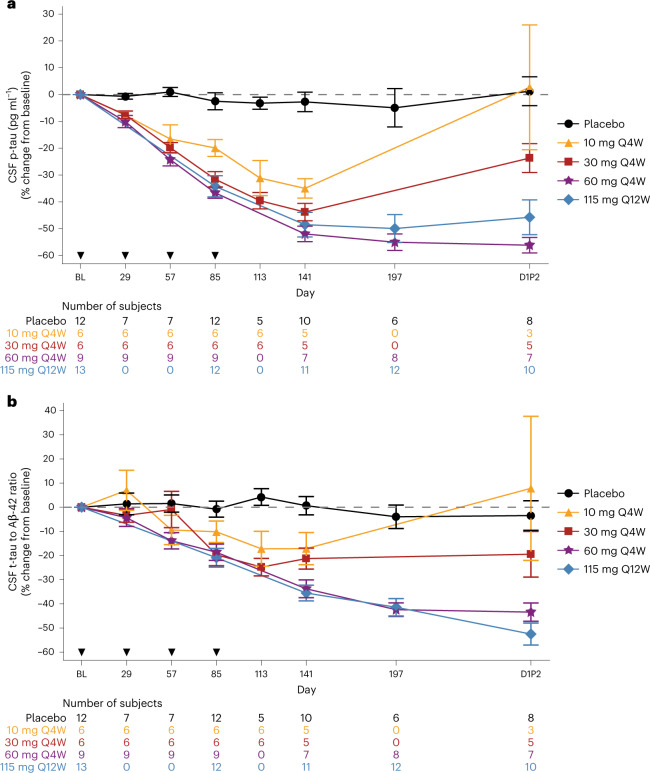
Tau plays a key role in Alzheimer's disease (AD) pathophysiology, and accumulating evidence suggests that lowering tau may reduce this pathology. We sought to inhibit MAPT expression with a tau-targeting antisense oligonucleotide (MAPTRx) and reduce tau levels in patients with mild AD. A randomized, double-blind, placebo-controlled, multiple-ascending dose phase 1b trial evaluated the safety, pharmacokinetics and target engagement of MAPTRx. Four ascending dose cohorts were enrolled sequentially and randomized 3:1 to intrathecal bolus administrations of MAPTRx or placebo every 4 or 12 weeks during the 13-week treatment period, followed by a 23 week post-treatment period. The primary endpoint was safety. The secondary endpoint was MAPTRx pharmacokinetics in cerebrospinal fluid (CSF). The prespecified key exploratory outcome was CSF total-tau protein concentration. Forty-six patients enrolled in the trial, of whom 34 were randomized to MAPTRx and 12 to placebo. Adverse events were reported in 94% of MAPTRx-treated patients and 75% of placebo-treated patients; all were mild or moderate. No serious adverse events were reported in MAPTRx-treated patients. Dose-dependent reduction in the CSF total-tau concentration was observed with greater than 50% mean reduction from baseline at 24 weeks post-last dose in the 60 mg (four doses) and 115 mg (two doses) MAPTRx groups. Clinicaltrials.gov registration number: NCT03186989 .


Conflict of interest statement

C.J.M. reports advisory board membership for Roche, Lilly, Biogen and Ionis; research grants from Biogen; seminar chair for Biogen; chair of data safety monitoring board for AD trial led by Imperial College; supported by the NIHR Biomedical Research Centre dementia subtheme at UCLH. M.J. reports advisory board membership for Biogen Sweden AB and BioArctic AB. S.D. reports salary support from the Fonds de recherche du Québec – Santé; consultancies from Biogen, Wave Life Sciences, AZTherapies and Janssen Pharmaceuticals; advisory board membership and/or speaker fees from Eisai, Biogen, Sunovion, Innodem Neurosciences, HealthTech Connex and QurAlis; cofounder of AFX Medical Inc. E.G.B.V. reports consultancies from New Amsterdam Pharma, Treeway, ReMynd, Vivoryon, Biogen, Vigil Neuroscience, ImmunoBrain Checkpoint and Brainstorm Therapeutics. PI of studies with AC immune, CogRX therapeutics, New Amsterdam Pharma, Janssen, UCB, Roche, GreenValley, Vivoryon, ImmunoBrain, Alector and Alzheon and sub-I from DIAN-TU, Alzheon, Eli Lilly, Cortexyme, Biogen en Fuij Film Toyama. L.M., K.M.M., C.Y., D.L., D.A.N., R.C., C.F.B., C.J. and R.M.L. are employees of, and hold stock in, Ionis. D.L.G., E.H. and E.R. are employees of, and hold stock in, Biogen. The remaining authors declare no competing interests.

Figures

Fig. 1
Fig. 1. Trial design and patient flow diagram.
a, Dosing and CSF sample collection for MAD part 1. CSF samples were obtained before the administration of study drug on days 1, 29, 57 and 85 for cohort A (10 mg MAPTRx or placebo monthly), cohort B (30 mg MAPTRx or placebo monthly) and cohort C (60 mg MAPTRx or placebo monthly) and on days 1 and 85 for cohort D (115 mg MAPTRx or placebo quarterly). The results of CSF samples obtained during screening and on day 1 (baseline) were averaged to serve as the baseline assessment, and the CSF samples on days 29, 57 and 85 served as 28 day, 56 day or 84 day post-dose trough samples. Two CSF samples were obtained in the post-treatment period, on either day 113 or day 141 for cohorts A and B and day 141 and day 197 for cohorts C and D. b, Patient flow during MAD part 1. Eligible patients were randomly assigned in a 3:1 ratio to receive the ASO MAPTRx or placebo in all cohorts.
Fig. 2
Fig. 2. MAPTRx exposure in CSF and plasma.
a, The maximum pre-dose CSF concentration of MAPTRx according to dose group: placebo or the various MAPTRx dose groups (that is, day 28 ‘trough’ (pre-dose) for placebo, 10 mg (n = 6 patients), 30 mg (n = 6 patients) and 60 mg (n = 9 patients) monthly groups; day 84 trough for 115 mg (n = 12 patients) quarterly dose group). Bar represents mean value and points represent individual values. b, Mean ± standard error of the mean concentration of MAPTRx in plasma, according to dose group, over the 24 h periods after the administration of the first dose (left; day 1) and fourth dose for 10 mg (n = 6 patients; all timepoints), 30 mg (n = 6 patients (n = 5 patients at 4 h and 5 h after dose on day 1 and 3 h after dose on day 85)) and 60 mg (n = 9 patients (n = 8 patients at 1 h after dose on day 1)) monthly dose groups and second dose for 115 mg (n = 13 patients on day 1, n = 12 patients on day 85) quarterly dose group (right; day 85). Error bars indicate the standard error.
Fig. 3
Fig. 3. Effect of MAPTRx on CSF concentrations of t-tau protein.
a, The concentrations of t-tau in CSF over time for individual patients in each dose group; absolute values, measured in picograms per milliliter (pg ml−1), are shown in the top graphs, and the percentage changes from baseline are shown in the bottom graphs. Arrowheads indicate the days on which MAPTRx or placebo was administered. b, The percentage change in the concentration of t-tau in CSF from baseline to the timepoint 56 days after the last dose (day 141). Circles indicate individual patients, and horizontal lines indicate group means. c, The mean concentration of t-tau in CSF (left) and the mean percentage change from baseline (right) over time according to dose group. CSF was not collected at 16 weeks post-last dose (day 197) for the 10 mg and 30 mg groups. Error bars indicate the standard error of the mean. Q4W and Q12W indicates dosing every 4 or 12 weeks, respectively. *Participants assigned to cohort A or B did not seamlessly transition to LTE part 2 and experienced a variable gap ranging from 5 to 19 months between completion of MAD part 1 at day 253 and start of LTE part 2 (D1P2). χPlacebo group was pooled. Subjects assigned to cohorts A or B and randomized to placebo had a variable gap between completion of MAD part 1 and start of LTE part 2 (D1P2).
Fig. 4
Fig. 4. Effect of MAPTRx on CSF concentrations of p-tau protein and tau/Aβ42.
a, The mean percentage change from baseline in p-tau over time according to dose group. b, The mean percentage change from baseline in the ratio of t-tau to Aβ42 over time according to dose group. Error bars indicate the standard error of the mean. Q4W and Q12W indicates dosing every 4 or 12 weeks, respectively. *Participants assigned to cohort A or B did not seamlessly transition to LTE part 2 and experienced a variable gap ranging from 5 to 19 months between completion of MAD part 1 at day 253 and start of LTE part 2 (D1P2). χPlacebo group was pooled. Subjects assigned to cohorts A or B and randomized to placebo had a variable gap between completion of MAD part 1 and start of LTE part 2 (D1P2).

Comment in

Similar articles

Cited by

References

    1. Lane CA, Hardy J, Schott JM. Alzheimer’s disease. Eur. J. Neurol. 2018;25:59–70. doi: 10.1111/ene.13439. - DOI - PubMed
    1. 2021 Alzheimer’s disease facts and figures. Alzheimers Dement.17, 327–406 (2021). - PubMed
    1. 2020 Alzheimer’s disease facts and figures. Alzheimers Dement.10.1002/alz.12068 (2020).
    1. McKhann GM, et al. The diagnosis of dementia due to Alzheimer’s disease: recommendations from the National Institute on Aging-Alzheimer’s Association workgroups on diagnostic guidelines for Alzheimer’s disease. Alzheimers Dement. 2011;7:263–269. doi: 10.1016/j.jalz.2011.03.005. - DOI - PMC - PubMed
    1. Shaw LM, et al. Appropriate use criteria for lumbar puncture and cerebrospinal fluid testing in the diagnosis of Alzheimer’s disease. Alzheimers Dement. 2018;14:1505–1521. doi: 10.1016/j.jalz.2018.07.220. - DOI - PMC - PubMed

Publication types

MeSH terms

Associated data