

Misinformation Caused Increased Urban Mobility and the End of Social Confinement Before the Second Wave of COVID-19 in Amazonia
- PMID: 37095286
- PMCID: PMC10124928
- DOI: 10.1007/s40615-023-01607-4
Misinformation Caused Increased Urban Mobility and the End of Social Confinement Before the Second Wave of COVID-19 in Amazonia
Abstract
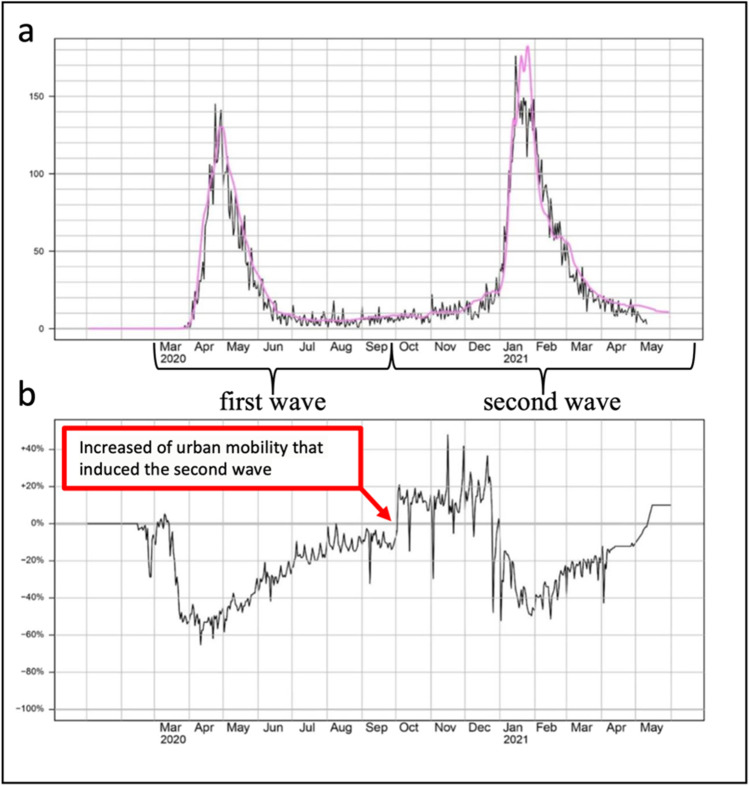
Tendentious projections about COVID-19 in Brazil provided an appealing excuse for individuals and decision-makers to justify poor choices during a critical phase of the pandemic. The erroneous results likely contributed to premature resumption of in-person school classes and easing of restrictions on social contact, favoring the resurgence of COVID-19. In Manaus, the largest city in the Amazon region, the COVID-19 pandemic did not end in 2020 of its own accord, but rather rebounded in a disastrous second wave of the disease.
Keywords: Amazon; Brazil; COVID-19; Prevention; Public health; Social confinement; Virus coevolution.
© 2023. W. Montague Cobb-NMA Health Institute.
Conflict of interest statement
The authors declare no competing interests.
Figures
References
-
- López L, Rodó X. The end of social confinement and COVID-19 re-emergence risk. Nat Hum Behav. 2020;4:746–55. https://www.nature.com/articles/s41562-020-0908-8. - PubMed
-
- Federal S. CPI da Pandemia Relatório Final. Brasília: Comissão Parlamentar de Inquérito da Pandemia, Senado Federal; 2022. p. 1080. Available at: https://legis.senado.leg.br/comissoes/comissao?codcol=2441.
Publication types
MeSH terms
LinkOut - more resources
Full Text Sources
Medical