. 2023 Apr 24;13(1):6617.
doi: 10.1038/s41598-023-33891-9.

Characterization of the m6A regulator-mediated methylation modification patterns in oral squamous cell carcinoma

Affiliations

Characterization of the m6A regulator-mediated methylation modification patterns in oral squamous cell carcinoma

Lu Pan et al. Sci Rep. .

Abstract

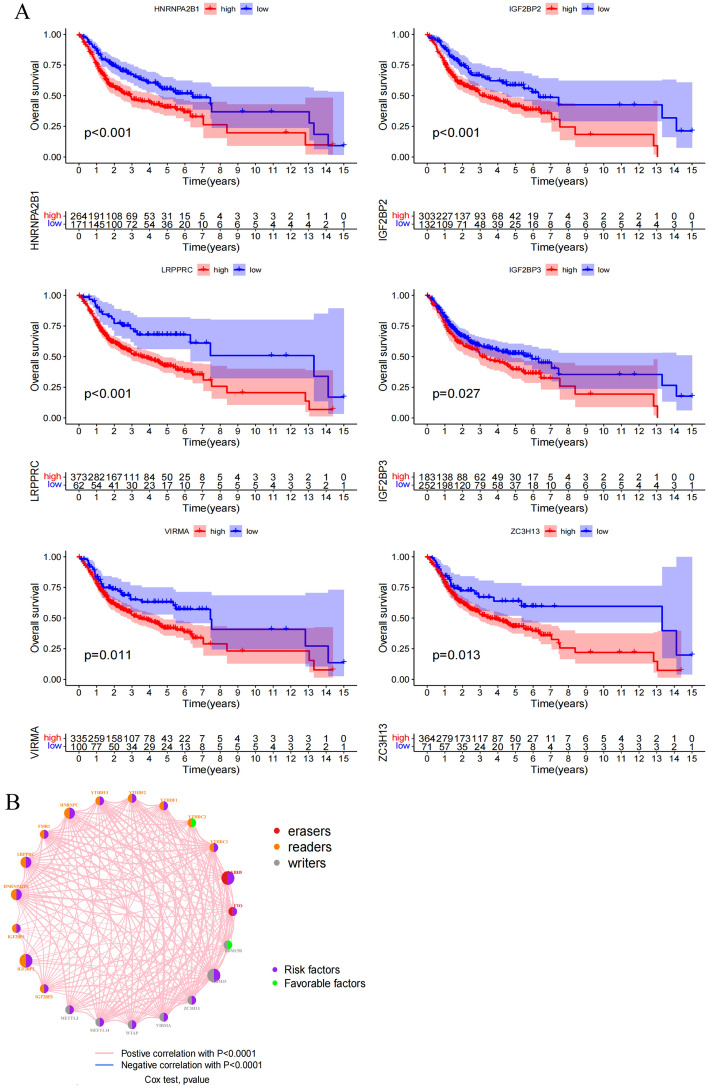
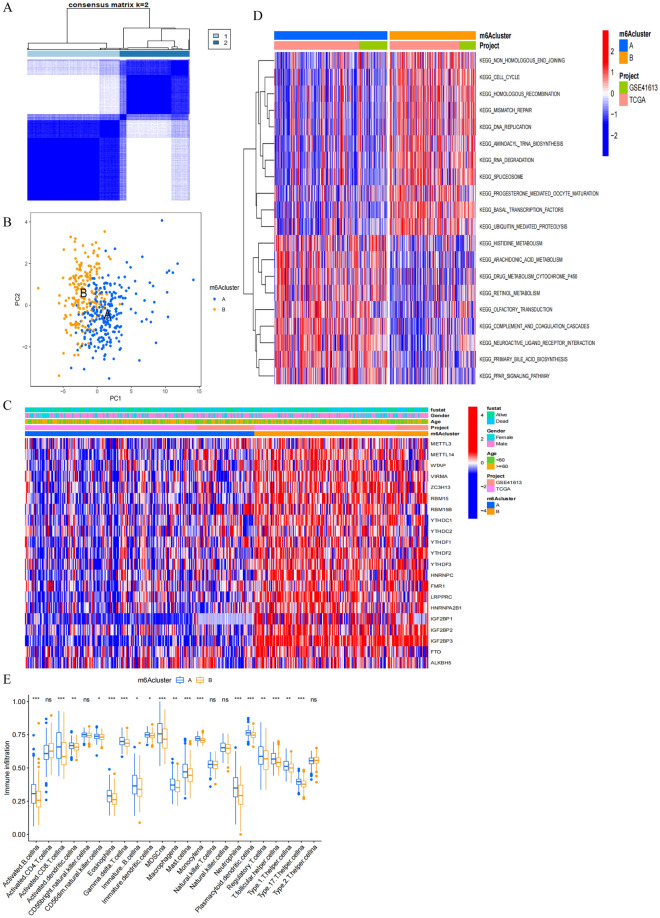
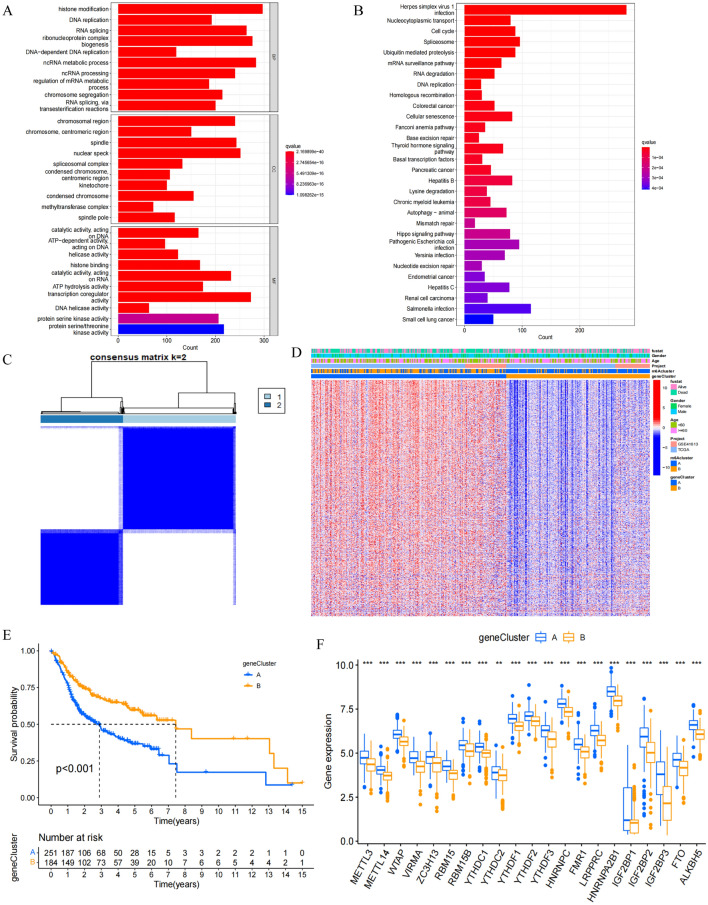
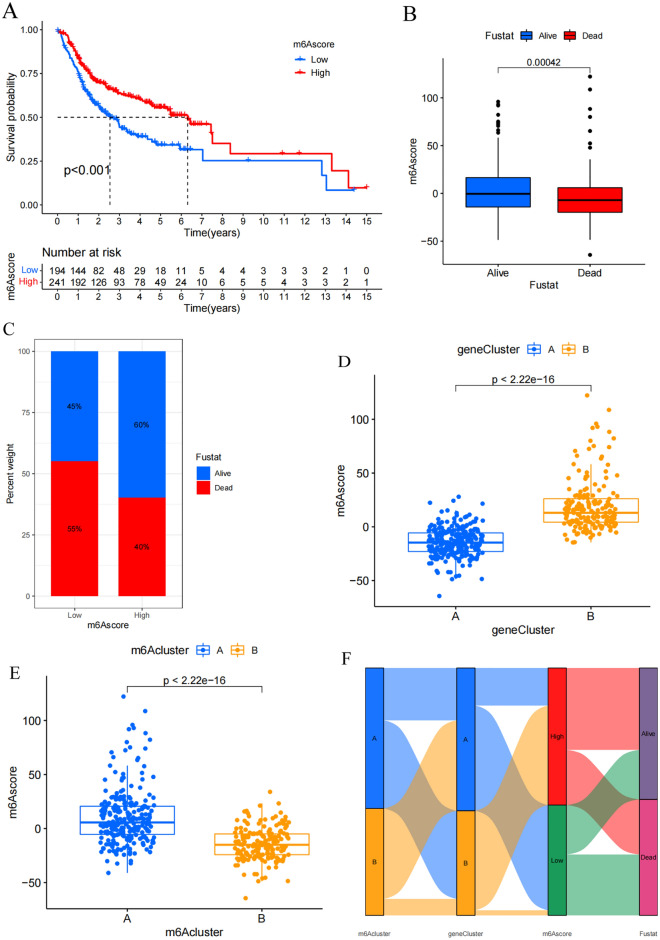
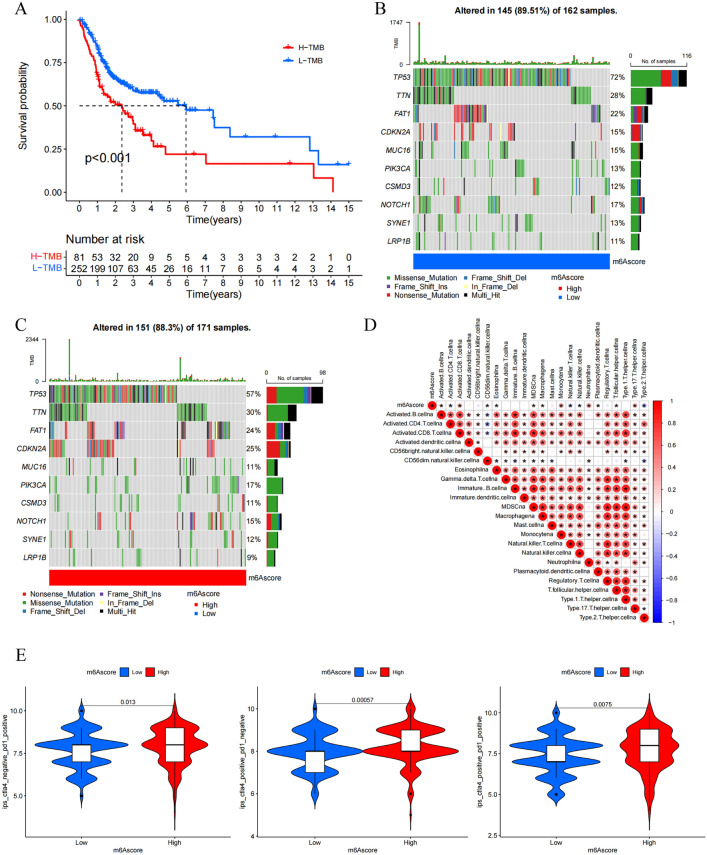
N6-methyladenosine (m6A) is a form of posttranscriptional modification that plays important roles in cancer including oral squamous cell carcinoma (OSCC). Most studies to date have focused on a limited number of regulators and oncogenic pathways, thus failing to provide comprehensive insight into the dynamic effects of m6A modification. In addition, the role of m6A modification in shaping immune cell infiltration in OSCC has yet to be clarified. This study was designed to assess m6A modification dynamics in OSCC and to understand how such modifications influence clinical immunotherapeutic treatment outcomes. m6A modification patterns linked with 23 m6A regulators were analyzed in 437 OSCC patients from TCGA and GEO cohorts. These patterns were then quantified through m6A score based on algorithms derived from a principal component analysis (PCA) approach. The m6A modification patterns of OSCC samples were grouped into two clusters based on the m6A regulators expression, and immune cell infiltration was linked with the 5-year survival outcomes of patients in these clusters. 1575 genes associated with OSCC patient prognosis were identified and used to re-cluster these samples into two groups. Patients in clusters exhibiting higher levels of m6A regulator expression exhibited poorer overall survival (OS), whereas patients with high m6A scores survived for longer (p < 0.001). The overall mortality rates in the groups of patients with low and high m6A scores were 55% and 40%, respectively, and the m6A score distributions in clusters of patients grouped by m6A modification patterns and gene expression further supported the link between a high m6A score and better prognostic outcomes. Immunophenoscore (IPS) values for patients in different m6A score groups suggested that the use of PD-1-specific antibodies or CTLA-4 inhibitors alone or in combination would yield superior treatment outcomes in patients in the high-m6A score group relative to the low-m6A score group. m6A modification patterns are relevant to heterogeneity in OSCC. Detailed analyses of m6A modification patterns may thus offer novel insight regarding immune cell infiltration within the OSCC tumor microenvironment, guiding novel efforts to provide patients with more effective immunotherapeutic interventions.


Conflict of interest statement

The authors declare no competing interests.

Figures

Figure 1
Figure 1
Landscape of genetic and expression variation of m6A regulators in OSCC. (A) Expression of 23 m6A regulator genes between normal tissues and OSCC tissues. Tumor, red; Normal, blue. Top edge of box: upper quartile; bottom edge of box: lower quartile; Internal horizontal line: median. Dots above and below: outliers. *p < 0.05; **p < 0.01; ***p < 0.001. (B) Mutation frequency of 23 m6A regulator genes in 506 OSCC samples from TCGA database. Each column represented a sample. The upper barplot showed TMB; the lower barplot showed conversion fraction in each sample; the right barplot showed the proportion of each variant type. Number on the right represented the mutation frequency of each regulator gene. (C) Differential expression of IGF2BP2 in LRPPRC wild and LRPPRC mutant samples. LRPPRC mutant, red; LRPPRC wild, blue. Top edge of box: upper quartile; bottom edge of box: lower quartile; Internal horizontal line: median. Dots above and below: outliers. The upper number represented p value. (D) The CNV frequency of 23 m6A regulator genes in TCGA-HNSC cohort. The height of the column represented the CNV frequency. The deletion frequency, blue dot; the amplification frequency, red dot. (E) The CNV location of 23 m6A regulator genes on chromosomes.
Figure 2
Figure 2
Correlation of m6A regulators with prognosis. (A) Kaplan–Meier survival analysis of m6A regulators between the high-expression group and the low-expression group using clinical information of OSCC patients in TCGA and GSE41613 cohort. High-expression, red curve; Low-expression, blue curve. P value less than 0.05 was statistically significant. (B) The interaction between m6A regulators in OSCC. Writers, readers and erasers were marked with red, orange and gray, respectively. The circle size represented the effect of each regulator on prognosis, and the range of values calculated by Cox test was p < 1e−04, p < 0.001, p < 0.01, p < 0.05 and p < 1, respectively. Green in the circle, favorable factors of prognosis; Purple in the circle, risk factors of prognosis. Curves linking regulators showed their interactions, with thickness showing the correlation strength. Positive correlation with p < 0.0001, pink curve; Negative correlation with p < 0.0001, blue curve. The figure was generated using R software (V 4.1.2, https://www.r-project.org/).
Figure 3
Figure 3
Characteristics of m6A methylation modification patterns. (A) Consensus clustering analysis of m6A regulators. Consensus clustering matrix for k = 2. Cluster A, 1; Cluster B, 2. (B) PCA analysis of m6A regulators. Samples in cluster A, blue dots; Samples in cluster B, yellow dots. (C) Unsupervised clustering of m6A regulators in OSCC patients from TCGA and GSE41613 cohort. Fustat, gender, age, project and m6Acluster were used as patient annotations. High expression, red; low expression, blue. (D) The heatmap of GSVA showing KEGG pathways in each m6A modification patterns. Red represented activated pathways and blue represented inhibited pathways. KEGG pathways were downloaded from the website (http://www.gsea-msigdb.org/). (E) ssGSEA of immune cells infiltration in individual m6A modification patterns. Cluster A, bule; Cluster B, yellow. Top edge of box: upper quartile; bottom edge of box: lower quartile; Internal horizontal line: median. Dots above and below: outliers. *p < 0.05; **p < 0.01; ***p < 0.001; ns no statistical significance.
Figure 4
Figure 4
DEGs associated with prognosis. (A) Functional annotation of DEGs by GO enrichment analysis. The color depth of the barplot represented q value and the length of the barplot represented number of enriched genes. (B) Functional annotation of DEGs by KEGG enrichment analysis. The color depth of the barplot represented q value and the length of the barplot represented number of enriched genes. (C) Consensus clustering analysis of prognosis related genes. Consensus clustering matrix for k = 2. Gene cluster A, 1; Gene cluster B, 2. (D) Unsupervised clustering of prognosis related genes in OSCC patients from TCGA and GSE41613 cohort. Fustat, gender, age, project, m6Acluster and gene cluster were used as patient annotations. High expression, red; low expression, blue. (E) Kaplan–Meier survival analysis of OSCC patients in different gene clusters. Gene cluster A, blue curve; Gene cluster B, yellow curve. Log-rank p < 0.001 showed a significant survival difference between two gene clusters. (F) Differential expression of m6A regulators between gene cluster A and gene cluster B. Gene cluster A, blue; Gene cluster B, yellow. Top edge of box: upper quartile; bottom edge of box: lower quartile; internal horizontal line: median. Dots above and below: outliers. *p < 0.05; **p < 0.01; ***p < 0.001.
Figure 5
Figure 5
High m6A score associated with better prognosis. (A) Kaplan–Meier survival analysis of OSCC patients in different m6A score groups. Low-m6A score group, blue curve; High-m6A score group, red curve. Log-rank p < 0.001 showed a significant survival difference between two groups. (B) Differences in m6A score between alive and dead patients in TCGA and GSE41613 cohort. Alive, blue; Dead, red. Top edge of box: upper quartile; bottom edge of box: lower quartile; internal horizontal line: median. Dots above and below: outliers. The upper number represented p value. (C) The proportion of alive and dead patients in the low-m6A score group and the high-m6A score group. Alive, blue; Dead, red. Numbers in the barplots represented percentages. (D) Differences in m6A score between m6A clusters. Cluster A, blue; Cluster B, yellow. Top edge of box: upper quartile; bottom edge of box: lower quartile; internal horizontal line: median. Dots represented samples and the upper number represented p value. (E) Differences in m6A score between gene clusters. Gene cluster A, blue; Gene cluster B, yellow. Top edge of box: upper quartile; bottom edge of box: lower quartile; internal horizontal line: median. Dots represented samples and the upper number represented p value. (F) Sankey diagram showing the correlations among m6A clusters, gene clusters, m6A score and fustat.
Figure 6
Figure 6
Mutation and immunity in tumor m6A modification patterns. (A) Kaplan–Meier survival analysis of OSCC patients in low TMB group and high TMB group. Low TMB group, blue curve; High TMB group, red curve. Log-rank p < 0.001 showed a significant survival difference between two groups. (B,C) TMB of top ten high-frequency mutated genes in 162 samples from low-m6Ascore group (B) and 171 samples from high-m6Ascore group (C). Each column represented a sample. The upper barplot showed TMB; the right barplot showed the proportion of each variant type. Numbers on the right represented the mutation frequency of genes. (D) Correlations between m6A score and immune cells infiltration using Spearman analysis. Negative correlation was marked with blue and positive correlation with red. *p < 0.05. (E) Correlations between m6A score and IPS. Low-m6A score group, blue; High-m6A score group, red. The upper number represented p value. p value less than 0.05 was statistically significant.

Similar articles

Cited by

References

    1. Bray F, et al. Global cancer statistics 2018: GLOBOCAN estimates of incidence and mortality worldwide for 36 cancers in 185 countries. CA Cancer J. Clin. 2018;68:394–424. doi: 10.3322/caac.21492. - DOI - PubMed
    1. Zanoni DK, et al. Survival outcomes after treatment of cancer of the oral cavity (1985–2015) Oral Oncol. 2019;90:115–121. doi: 10.1016/j.oraloncology.2019.02.001. - DOI - PMC - PubMed
    1. Lin W, Chen M, Hong L, Zhao H, Chen Q. Crosstalk between PD-1/PD-L1 blockade and its combinatorial therapies in tumor immune microenvironment: A focus on HNSCC. Front. Oncol. 2018;8:532. doi: 10.3389/fonc.2018.00532. - DOI - PMC - PubMed
    1. Doroshow DB, et al. PD-L1 as a biomarker of response to immune-checkpoint inhibitors. Nat. Rev. Clin. Oncol. 2021;18:345–362. doi: 10.1038/s41571-021-00473-5. - DOI - PubMed
    1. Dominissini D, et al. Topology of the human and mouse m6A RNA methylomes revealed by m6A-seq. Nature. 2012;485:201–206. doi: 10.1038/nature11112. - DOI - PubMed

Publication types