. 2024 Feb;42(2):305-315.
doi: 10.1038/s41587-023-01756-1. Epub 2023 Apr 24.

Efficient engineering of human and mouse primary cells using peptide-assisted genome editing

Affiliations

Efficient engineering of human and mouse primary cells using peptide-assisted genome editing

Zhen Zhang et al. Nat Biotechnol. 2024 Feb.

Abstract

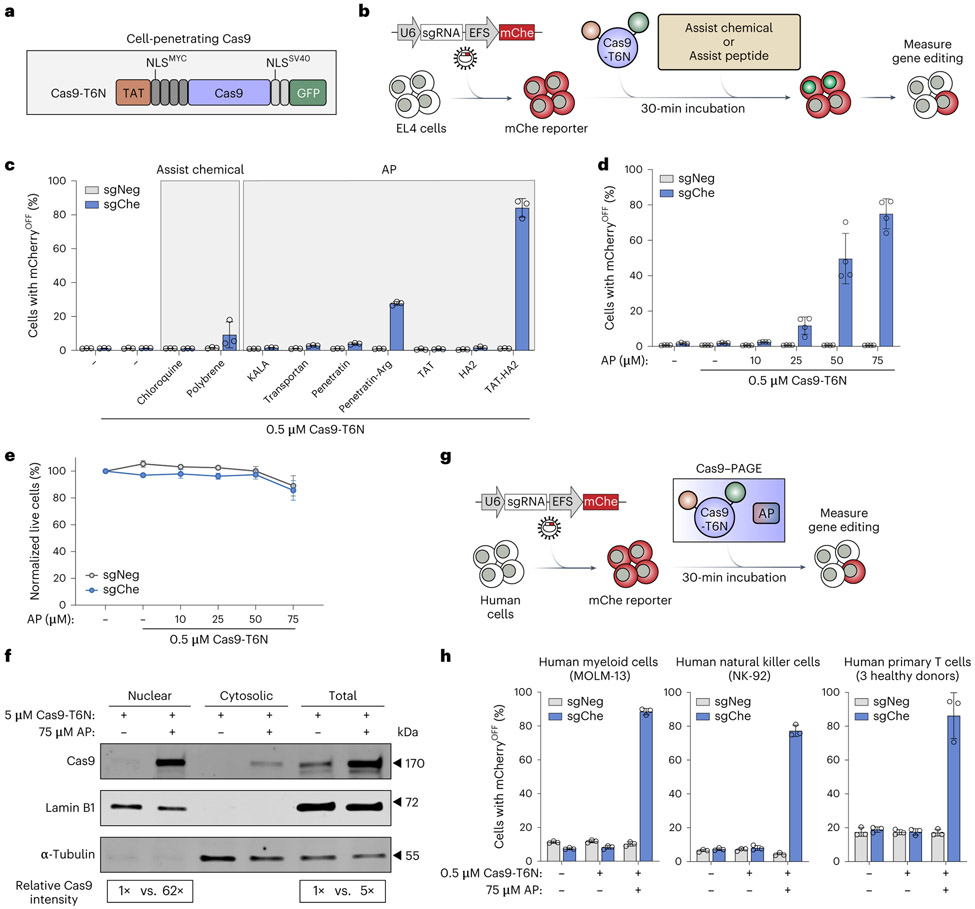
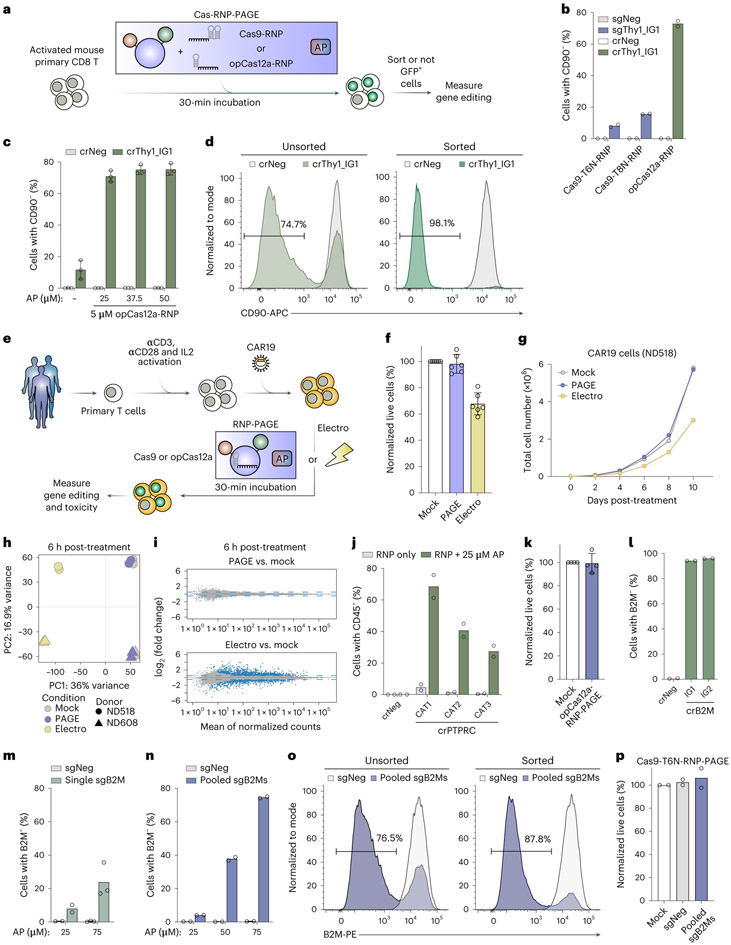
Simple, efficient and well-tolerated delivery of CRISPR genome editing systems into primary cells remains a major challenge. Here we describe an engineered Peptide-Assisted Genome Editing (PAGE) CRISPR-Cas system for rapid and robust editing of primary cells with minimal toxicity. The PAGE system requires only a 30-min incubation with a cell-penetrating Cas9 or Cas12a and a cell-penetrating endosomal escape peptide to achieve robust single and multiplex genome editing. Unlike electroporation-based methods, PAGE gene editing has low cellular toxicity and shows no significant transcriptional perturbation. We demonstrate rapid and efficient editing of primary cells, including human and mouse T cells, as well as human hematopoietic progenitor cells, with editing efficiencies upwards of 98%. PAGE provides a broadly generalizable platform for next-generation genome engineering in primary cells.


Figures

Fig. 1 ∣
Fig. 1 ∣. Development of PAGE CRISPR–Cas9 system.
a, Design of a cell-penetrating Cas9 (Cas9-T6N). Cas9 is fused N-terminally to HIV TAT and 4× Myc NLS and C-terminally to 2× SV40 NLS and GFP. b, Schematic workflow to quantify the gene editing efficiency of different Cas9-CPPs and conditions using an EL4 mCherry (mChe) reporter cell. EL4, a mouse T lymphoblast, was lentivirally transduced with a bicistronic expression vector stably expressing an mChe fluorescence reporter and a sgRNA targeting the mCherry gene or the Ano9 gene as a negative control. EL4 mChe cells were incubated with Cas9-T6N protein together with various assist chemicals or APs for 30 min, followed by extensive washing and trypsinization to remove residual cell surface-bound Cas9-T6N. Gene editing efficiency was quantified by the loss of the mChe-positive cell population via flow cytometry. c, Quantification of the editing efficiency of Cas9-T6N with various assist chemicals and APs in the EL4 mChe reporter cell line. EL4 mChe reporter cells were treated with 0.5 μM Cas9-T6N in the presence of the chemicals 200 mM chloroquine or 1 mg ml−1 polybrene, or 75 μM of the APs as indicated. The percentage of cells with loss of mChe was measured by flow cytometry on day 4 post-treatment (n = 3, biological replicates). d,e, Quantification of gene editing efficiency and live cell recovery with titration of AP. EL4 mChe cells were treated with 0.5 μM Cas9-T6N in the presence of various concentrations of AP, here TAT-HA2. Live cell populations were measured immediately following treatment, while gene editing efficiency was measured at day 4 post-treatment (n = 4, biological replicates). f, Western blotting of Cas9, lamin B1 and α-Tubulin levels in the nuclear fraction, cytosolic fraction and whole-cell lysates prepared from EL4 cells were incubated with either Cas9-T6N only or Cas9-T6N and TAT-HA2. EL4 cells were incubated with 5 μM of Cas9-T6N ±75 μM of TAT-HA2 for 30 min. Nuclear and cytosolic fractions were separated and subjected to immunoblotting analyses using antibodies against Cas9, nuclear marker lamin B1 and cytosolic marker α-Tubulin. A representative experiment of two independent replicates is shown (n = 2, biological replicates). The relative intensity of Cas9 protein is quantified using gel densitometry and normalized first to lamin B1 and then to the Cas9 from either a nuclear fraction or whole-cell lysates without TAT-HA2 treatment. Here AP is TAT-HA2. g, Workflow of Cas9-PAGE system for gene editing in diverse human cell types. The combination of cell-penetrating Cas protein and AP was termed PAGE. h, Quantification of PAGE system-mediated gene editing efficiency in various human cell types. mChe reporter was established in indicated cell types: a human myeloid cell line MOLM-13, a human natural killer cell line NK-92 and human primary T cells isolated from peripheral blood mononuclear cells of three healthy donors. mChe reporter cells were incubated with 0.5 μM Cas9-T6N and 75 μM AP for 30 min. The percentage of cells with loss of mChe was measured by flow cytometry on day 4 post-treatment (n = 3, biological replicates). Error bars smaller than the symbol width were not shown. Data were presented as mean ± s.d.
Fig. 2 ∣
Fig. 2 ∣. Development of Cas9-PAGE genome editing in clinically relevant models of mouse primary T cells.
a, Schematic workflow of Cas9-PAGE system in mouse CD8+ T cells ex vivo. b, Quantification of Cas9-PAGE-mediated gene editing of Thy1 in mouse CD8+ T cells ex vivo. Activated mouse primary CD8+ T cells were retrovirally transduced with either sgThy1_IG1 or sgNeg co-expressing with an mChe reporter. sgRNA+/mChe+ cells were FACS sorted and incubated with 5 μM Cas9-T6N and various concentrations of AP for 30 min. Flow cytometry analysis of surface CD90 level was performed at 4 d after PAGE incubation (n = 2, biological replicates). c, A representative flow cytometry plot of surface CD90 expression level of primary CD8+ T cells transduced with indicated sgRNAs at 6 d after PAGE incubation (5 μM Cas9-T6N and 25 μM AP). d, Schematic workflow of Cas9-PAGE in mouse primary CD8+ T cells for in vivo study. Donor CD8+ T cells from P14 transgenic (CD45.1+ or CD45.1/2+ congenic) mice were isolated and activated with anti-CD3, anti-CD28 and IL-2, followed by retroviral transduction with either experimental or negative control sgRNA expression vector linked with a fluorescence marker. sgRNA-transduced T cells were incubated with 5 μM Cas9-T6N and 25 μM AP for 30 min before FACS sorting to enrich the Cas9 and sgRNA double positive population. Experimental and negative control sgRNA-transduced P14 T cells were mixed in a 1:1 ratio, followed by adoptive transfer to CD45.2+ congenic recipient mice that were infected with LCMV clone13 virus. Gene editing and P14 T cell population were evaluated by flow cytometry over a time course of 30 d. e,f, Example flow cytometry plot (e) and quantification of CD90 surface expression (f) following Cas9-PAGE-mediated editing at day 8 postinfection (n = 10, biological replicates). sgThy1_IG1 was designed to target the immunoglobulin-like domain (IG) of Thy1. g,h, Example flow cytometry plot (g) and quantification of PD-1 surface expression (h) following Cas9-PAGE-mediated editing at day 8 postinfection (n = 9, biological replicates). sgPdcd1_ IG44 was designed to target the IG of Pdcd1. CD44+ CD8+ T cells were used as a positive control for CD90 expression in flow cytometry plot (e). Lack of CD44 expression (CD44) was used to identify naive CD8+ T cells as a negative control for PD-1 expression in flow cytometry plot (g). i, Proportion of cotransferred P14 T cells transduced with indicated sgRNA in blood over time. P14, CD8+ T cells with specific T cell receptor for the LCMV DbGP33-41 epitope.j, P14 T cells transduced with indicated sgRNAs as a proportion of total CD8+ T cells in blood over a time course of 30 d. n = 10 in the days 8 and 15 postinfection samples, n = 5 in the days 22 and 30 postinfection samples, biological replicates (i,j). P values are indicated (two-tailed Wilcoxon matched-pairs signed rank test). Error bars smaller than the symbol width were not shown. Data were presented as mean ± s.e.m.
Fig. 3 ∣
Fig. 3 ∣. Development of CRISPR-RNP-PAGE genome editing in human CAR T cells.
a, A schematic workflow of Cas RNP complex of PAGE in mouse primary CD8+ T cells ex vivo. Cas9-T6N, Cas9-T8N or opCas12a-T8N was mixed with its associated guide RNA to form an RNP complex before co-incubation with activated mouse primary CD8+ T cells. b, Quantification of Cas9-T6N-RNP, Cas9-T8N-RNP or opCas12a-T8N-RNP-mediated gene editing of Thy1 in mouse CD8+ T cells ex vivo. Cells were incubated with either 5 μM Cas9-T6N-RNP, Cas9-T8N-RNP or opCas12a-T8N-RNP and 25 μM AP for 30 min. Flow cytometry analysis of surface CD90 level was performed at 5 d after RNP-PAGE incubation (n = 2, biological experiments from two donor mice). c, Quantification of opCas12-RNP-PAGE-mediated gene editing of Thy1 in mouse CD8+ T cells with various concentrations of AP ex vivo. Cells were incubated with 5 μM opCas12a-T8N-RNP and indicated concentrations of AP for 30 min. Flow cytometry analysis of surface CD90 level was performed at 5 d after opCas12-RNP-PAGE incubation (n = 3, biological experiments from three different donor mice). d, Representative flow cytometry plot of surface CD90 expression level of primary CD8+ T cells treated with opCas12-RNP-PAGE. Cells were either sorted or not based on the GFP positivity right after the incubation with 5 μM opCas12-T8N-RNP and 25 μM AP, followed by flow cytometry analysis of surface CD90 level at 5 d after PAGE incubation. sgThy1_IG1 and crThy1_IG1 were designed to target the IG of Thy1. Error bars smaller than the symbol width were not shown. Data were presented as mean ± s.d. e, Schematic workflow of either RNP-PAGE or RNP electroporation in human CAR19 cells ex vivo. CAR19, a CAR of T cells, specifically recognizes the CD19 antigen. Human primary T cells from healthy donors were isolated and activated with anti-CD3, anti-CD28 and IL-2. Activated T cells were transduced with CAR19 lentivirus 1-d post-activation. On day 4 postinfection, CAR19+ cells were FACS sorted before treatment with either opCas12a-RNP-PAGE or opCas12a-RNP electroporation. f, Live cells were quantified 6-h post-treatment with either opCas12a-RNP-PAGE or electroporation. The data were normalized to the mock treatment control group (n = 6, representing biological replicates from three health donors). g, Expansions of PAGE-treated or electroporated CAR19 cells were monitored over a time course of 10 d. h, A principal component analysis plot of RNA-seq data for CAR19 cells at 6-h posttreatment of either PAGE or electroporation is shown, with n = 4 representing biological replicates from two healthy donors. i, MA plot of the log2 fold change of all genes in either PAGE-treated or electroporated CAR19 cells from h. The differential gene expression statistical test was performed using DESeq2, which employs a default two-sided Wald test with Benjamini–Hochberg multiple test correction. The x-axis represents the mean of the read counts of replicates, while the y-axis shows the log2 fold change calculated by DESeq2 with batch correction. Blue dots indicate genes with a Benjamini–Hochberg adjusted P < 0.01 and an absolute log2 fold change greater than 0.5. Blue dotted lines indicate an absolute log2fold change of 0.5. j, Quantification of opCas12a-T8N-RNP-mediated gene editing of PTPRC in CAR19 ex vivo. Cells were incubated with 5 μM opCas12a-T8N-RNP with or without 25 μM AP for 30 min. Cell surface CD45 expression level was measured via flow cytometry analysis at 6 d after RNP-PAGE incubation (n = 2, biological replicates). crRNAs were designed to target the catalytic domain (CAT) of PTPRC. k, Live cells were quantified immediately following either mock or opCas12a-RNP-PAGE incubation. The data were normalized to the mock treatment control group (n = 4, biological replicates representing four health donors). l, Quantification of opCas12a-RNP-PAGE-mediated gene editing of B2M in CAR19 ex vivo. Cell surface B2M level was measured via flow cytometry at 10 d after RNP-PAGE incubation (n = 2, representing biological replicates from two health donors). crRNAs were designed to target the IG of B2M. m,n, Quantification of Cas9-RNP-PAGE-mediated gene editing of B2M in CAR19 cells ex vivo. Cells were incubated with 5 μM of Cas9-T6N under indicated conditions of AP and sgRNA for 30 min. Flow cytometry analysis of surface B2M level was performed 10 d after Cas9-RNP-PAGE incubation (n = 2 in the 25 μM AP group in (m), n = 3 in the 75 μM AP group in m and n = 2 in n, representing biological experiments from two health donors). o, Representative flow cytometry plot of surface B2M expression level of CAR19 cells treated with Cas9-RNP-PAGE. Cells were either sorted or not based on the GFP positivity right after the incubation with 5 μM Cas9-T6N-RNP and 75 μM AP, followed by flow cytometry analysis of surface B2M level at 10 d after PAGE incubation. p, Live cells were quantified immediately following either mock or Cas9-RNP-PAGE incubation. The data were normalized to the mock treatment control group (n = 2, representing biological experiments from two health donors). Data were presented as mean ±s.d. ND, normal donor; electro, electroporation.
Fig. 4 ∣
Fig. 4 ∣. PAGE-mediated multiplex genome editing in human CAR T cells and HSPCs.
a, Schematic workflow of opCas12-RNP-PAGE-mediated multiplex gene editing in human CAR19 ex vivo. The sequential double knockout of B2M and PTPRC was performed by incubating CAR19 cells with opCas12a-RNP-PAGE containing a single crRNA targeting B2M on day 0 for 30 min, followed by a second 30-min incubation with opCas12a-RNP-PAGE containing a single crRNA targeting PTPRC 2 d later. For the simultaneous triple knockout of B2M, TRAC and PTPRC, opCas12a-RNP-PAGE containing a mixture of three crRNA targeting each gene was incubated with CAR19 for 30 min. Cellular toxicity was evaluated immediately after each PAGE incubation, and gene editing efficiency was measured 10 d after PAGE treatment. b,d, Live cells were quantified immediately following either mock or opCas12a-RNP-PAGE incubation. The data were normalized to the mock treatment control group (n = 3, representing biological experiments from three health donors). c,e, Quantification of opCas12a-RNP-PAGE-mediated multiplex gene editing in CAR19 ex vivo. Cell surface B2M and CD45 levels were measured via flow cytometry at 10 d after RNP-PAGE incubation in the sequential multiplex gene editing (c). Cell surface B2M, CD45 and TCR levels were measured via flow cytometry at 10 d after RNP-PAGE incubation in the simultaneous multiplex gene editing (e) (n = 3, representing biological experiments from three health donors). f, Schematic workflow of ex vivo genome engineering of primary human HSPCs using either opCas12a-RNP-PAGE or Cas12a-RNP electroporation methods. HSPCs were obtained from healthy donors and treated with either PAGE or electroporation methods. The HSPCs were then differentiated into erythroid cells using a three-phase erythroid differentiation protocol, followed by assessment of genome editing efficiency, cell expansion and reactivation of fetal hemoglobin. g, Quantification of gene editing efficiency of BCL11A + 58 kb enhancer using either PAGE or electroporation. The bar graph depicts the TIDE assay score (indel%), on-target mutagenesis efficiency, of indicated method (n = 4 in the PAGE treatment group and n = 2 in the electroporation treatment group, representing biological replicates from two different health donors). h, Relative cell expansion of CD34+ HSPCs edited by either PAGE or electroporation methods. The number of live cells was quantified at day 6 after gene editing using either PAGE or electroporation methods. The data were normalized to the mock treatment control group (n = 2, representing biological experiments from two health donors). i, qRT-PCR analysis of fetal globin transcripts (HBG) of total globin transcripts (HBG + HBB) on day 13 after gene editing using either opCas12a-RNP-PAGE or Cas12a-RNP electroporation. HBG, hemoglobin subunit gamma 1 and 2, HBB, hemoglobin subunit beta. Negative control crRNA, crNeg2/3, targeting GCG and non-expressed genes in HSPCs were used (n = 4 in the PAGE treatment group and n = 2 in the electroporation treatment group, representing biological replicates from two different health donors).j, Summary of HbF flow cytometry of primary erythroid precursor cells edited by opCas12a-RNP-PAGE with indicated crRNAs (n = 4, representing biological replicates from two health donors). k, Representative flow cytometry plot of intracellular HbF staining from j. Data were presented as mean ± s.d. Electro, electroporation.

Comment in

References

    1. Doudna JA The promise and challenge of therapeutic genome editing. Nature 578, 229–236 (2020). - PMC - PubMed
    1. Hsu PD, Lander ES & Zhang F Development and applications of CRISPR–Cas9 for genome engineering. Cell 157, 1262–1278 (2014). - PMC - PubMed
    1. Komor AC, Badran AH & Liu DR CRISPR-based technologies for the manipulation of eukaryotic genomes. Cell 168, 20–36 (2017). - PMC - PubMed
    1. June CH, O’Connor RS, Kawalekar OU, Ghassemi S & Milone MC CAR T cell immunotherapy for human cancer. Science 359, 1361–1365 (2018). - PubMed
    1. Rosenberg SA, Restifo NP, Yang JC, Morgan RA & Dudley ME Adoptive cell transfer: a clinical path to effective cancer immunotherapy. Nat. Rev. Cancer 8, 299–308 (2008). - PMC - PubMed