. 2024 Feb;42(2):275-283.
doi: 10.1038/s41587-023-01763-2. Epub 2023 Apr 24.

Efficient evolution of human antibodies from general protein language models

Affiliations

Efficient evolution of human antibodies from general protein language models

Brian L Hie et al. Nat Biotechnol. 2024 Feb.

Abstract

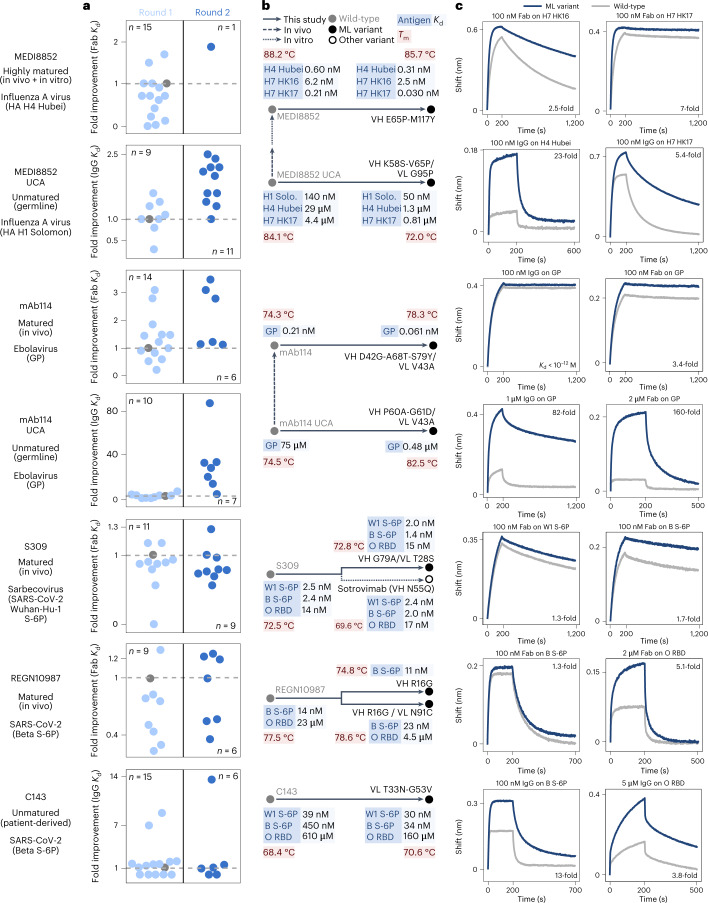
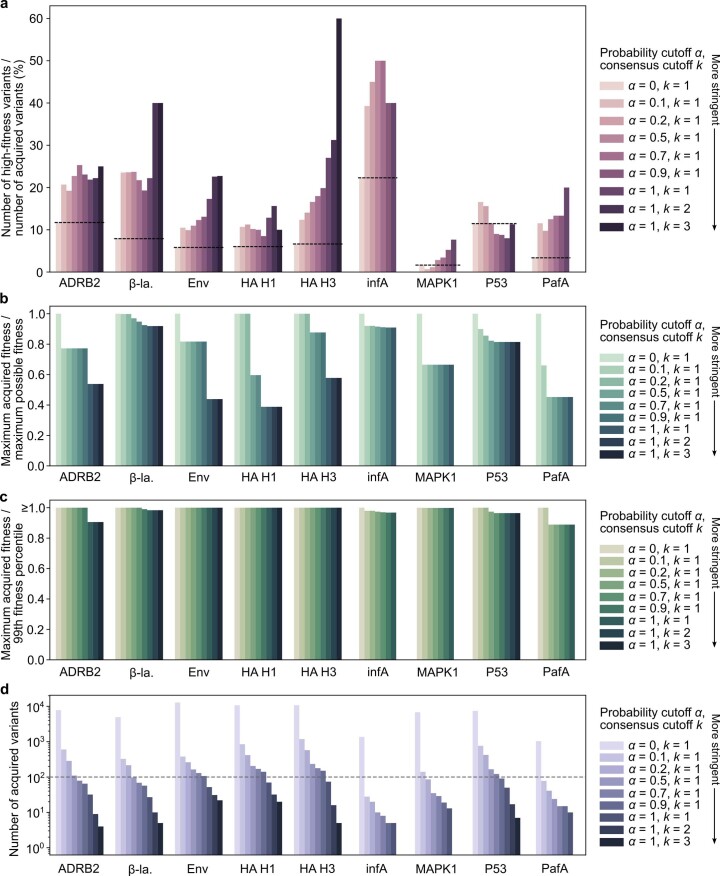
Natural evolution must explore a vast landscape of possible sequences for desirable yet rare mutations, suggesting that learning from natural evolutionary strategies could guide artificial evolution. Here we report that general protein language models can efficiently evolve human antibodies by suggesting mutations that are evolutionarily plausible, despite providing the model with no information about the target antigen, binding specificity or protein structure. We performed language-model-guided affinity maturation of seven antibodies, screening 20 or fewer variants of each antibody across only two rounds of laboratory evolution, and improved the binding affinities of four clinically relevant, highly mature antibodies up to sevenfold and three unmatured antibodies up to 160-fold, with many designs also demonstrating favorable thermostability and viral neutralization activity against Ebola and severe acute respiratory syndrome coronavirus 2 (SARS-CoV-2) pseudoviruses. The same models that improve antibody binding also guide efficient evolution across diverse protein families and selection pressures, including antibiotic resistance and enzyme activity, suggesting that these results generalize to many settings.


Conflict of interest statement

B.L.H., V.R.S. and P.S.K. are named as inventors on a provisional patent application applied for by Stanford University and the Chan Zuckerberg Biohub related to this study. B.L.H. performs research for Meta Platforms, Inc. The remaining authors declare no competing interests.

Figures

Fig. 1
Fig. 1. Guiding evolution with protein language models.
a,b, Two possible models for relating the space of mutations with high evolutionary plausibility (for example, mutations seen in antibodies) to the space with high fitness under specific selection pressures (for example, mutations that result in high binding affinity to a specific antigen). Both models assume that mutations with high fitness make up a rare subset of the full mutational space and that, in general, high-fitness mutations are also evolutionarily plausible. Under the first model (a), mutations with high fitness are rare within the subset of mutations that are evolutionarily plausible. Under the second model (b), when restricted to the regime of plausible mutations, improvements to fitness become much more common. c, Protein language models, trained on millions of natural protein sequences learn amino acid patterns that are likely to be seen in nature. We hypothesized that most mutations with high language model likelihood would also be evolutionarily plausible. Assuming that this is true, and if the second model (b) better describes nature, then a language model with no information about specific selection pressures can still efficiently guide evolution.
Fig. 2
Fig. 2. Language-model-guided affinity maturation of seven human antibodies.
a, Strip plots visualizing the two rounds of directed evolution conducted for each antibody. Each point represents an IgG or Fab variant plotted according to the fold change in Kd from wild-type on the y axis and jitter on the x axis; a gray, dashed line is drawn at a fold change of 1, and the wild-type point is colored gray. MEDI8852 variants were screened against HA H4 Hubei; MEDI8852 UCA variants against HA H1 Solomon; mAb114 and mAb114 UCA variants against ebolavirus GP; S309 variants against Wuhan-Hu-1 S-6P; and REGN10987 and C143 variants against Beta S-6P. b, Phylogenetic trees illustrating the evolutionary trajectories from wild-type to the highest-affinity variant(s) of each antibody. Nodes are annotated with the Kd values for different antigens and the Tm of the Fab; all Kd values are for the monovalent Fab versions except those of C143, which are apparent Kd values for the bivalent IgGs. B, Beta; H1 Solo., H1 Solomon; ML variant, machine-learning-guided variant; O, Omicron; W1, Wuhan-Hu-1. c, We obtained avidity and affinity measurements via BLI of IgGs and Fabs at the indicated concentrations binding to the indicated antigen. Selected BLI traces of the highest-affinity variants for the respective antigens are plotted alongside those of the wild-type variants.
Fig. 3
Fig. 3. Specificity and improved neutralization potency of affinity-matured variants.
a, Polyspecificity of antibody wild-types and variants was quantified using an assay that measures non-specific binding to soluble membrane proteins via flow cytometry, where higher MFI values correspond to more non-specific binding (Methods). Control antibodies are elotuzumab (a clinical antibody with low polyspecificity), ixekizumab (a clinical antibody with high polyspecificity) and 4E10 (a research antibody with high polyspecificity beyond a therapeutically viable level). Bar height indicates the mean across n = 3 replicate wells; black dots indicate independent measurements. b, Variants of the antibody C143, obtained from our language-model-guided affinity maturation campaign, demonstrate improved neutralization activity in a pseudovirus assay. For Beta pseudovirus, out of the three higher-affinity variants that we also screened for neutralization activity, the best improvement is the 32-fold improvement of VL G53V; for D614G pseudovirus, the best improvement is the 19-fold improvement of VL T33N-G53V (Supplementary Table 9). Also see Extended Data Fig. 2. Points indicate the mean; error bars indicate the s.d.; n = 4 independent experiments. c, Fold change in Kd correlates well with fold change in IC50 (Spearman r = 0.82, n = 15 antibody variants) across all designs tested, consistent with higher binding affinity contributing to improved viral neutralization activity. WT, wild-type.
Fig. 4
Fig. 4. Guiding evolution without explicitly modeling fitness.
a, The same strategy and language models that we use to affinity mature antibodies can also recommend high-fitness changes across a diversity of selection pressures and protein families, as identified experimentally using high-throughput scanning mutagenesis assays, (described in Supplementary Table 13). ‘Fraction positive’ indicates the percentage of high-fitness amino acid substitutions within either the set of substitutions recommended by the language model (LM guided) or the set of all single-residue substitutions (Background). A large portion of language-model-guided substitutions have high fitness, which, in many cases, is significantly enriched compared to the background percentage; also see Extended Data Figs. 4–6, and see Supplementary Table 13 for the exact one-sided hypergeometric P values and sample sizes. ADRB2, adrenoreceptor beta 2; β-la., β-lactamase; Env, envelope glycoprotein; infA, translation initiation factor 1; MAPK1, mitogen-activated protein kinase 1; PafA, phosphate-irrepressible alkaline phosphatase. b, Conceptually, the prior information encoded by evolutionary plausibility is represented in this cartoon by the rainbow road, where ascending corresponds to improving fitness and descending corresponds to lowering fitness. Moving in any direction (for example, via random or brute force mutagenesis) would most likely decrease fitness or have a high chance of being a detrimental change (represented by the green ball). However, if evolutionary plausibility is an efficient prior (Fig. 1b), then movement that is constrained to the plausible regime (for example, when guided by a language model) substantially increases the chance of improving fitness (represented by the red ball).
Extended Data Fig. 1
Extended Data Fig. 1. ESM masked versus wildtype marginals.
(a) Representative scatter plots showing all possible single-site substitutions to an antibody sequence plotted according to their log-likelihood ratios to wildtype, where likelihoods are computed based on either masked marginals (y-axis) or wildtype marginals (x-axis). A red dashed line is plotted where masked and wildtype marginal values are equal. The wildtype marginal log-likelihoods are consistently lower overall, effectively serving to make the α parameter more stringent, while (b) the rank-based correlation between masked marginals and wildtype marginals is close to 1 in all cases.
Extended Data Fig. 2
Extended Data Fig. 2. Pseudovirus neutralization of affinity-matured variants.
(a) Neutralization curves for wildtype antibodies (gray) and variants obtained by our language-model-guided affinity maturation campaigns. Also see Supplementary Tables 5, 8, and 9 for corresponding IC50 values. Points indicate the mean; error bars indicate the standard deviation; n = 4 independent assays. (b) Fold-improvement in kon has low correlation with fold-change in IC50 (Spearman r = 0.12), while fold-improvement in koff has high correlation with fold-change in IC50 (Spearman r = 0.79); compare to Fig. 3c. Correlations involve n = 15 antibody variants. We define a higher kon and a lower koff as improved, so we divide the mutant value by the wildtype value to calculate fold-improvement in kon and vice-versa to calculate fold-improvement in koff.
Extended Data Fig. 3
Extended Data Fig. 3. UniRef90 significance and robustness analysis.
(a) A histogram of the null distribution generated by simulating how many avidity-enhancing substitutions would be recommended from a site-independent model based on UniRef90 alignments. Results are for n = 4.5 million simulations as described in Methods. Based on this null distribution and given that the language models recommended 12 avidity-enhancing substitutions, we estimate P = 0.0085. (b) The number of known avidity-enhancing substitutions recommended by a UniRef90 site-independent model at varying alignment depths, where our benchmark analyses are performed using an alignment depth of 10,000. The red line indicates the number of avidity-enhancing substitutions found by the language models. The combined number of known avidity-enhancing substitutions is provided in the stacked bar plot on the left and are separated by the antibody in the three right panels. The substitutions corresponding to each alignment depth and antibody are provided in Supplementary Data 3.
Extended Data Fig. 4
Extended Data Fig. 4. Relationship between likelihood stringency and fitness efficiency.
To obtain the set A of language-model-recommended variants, we varied two parameters controlling the stringency of acquired variants (where more stringent corresponds to fewer variants): α is a cutoff controlling the likelihood ratio of the mutant probability to the wildtype probability, and k is a cutoff controlling the number of consensus language models (Methods). (a) At varying cutoffs, we computed the percentage fraction of variants in A that correspond to high-fitness variants, using scanning mutagenesis data for validation. When α = 0 and k = 1, this value is equivalent to the percentage of high-fitness variants in the full scanning mutagenesis dataset (a black dashed line is also drawn at this value for each protein). In all cases except for P53, we observe that increasing the likelihood stringency generally improves the efficiency at which high-fitness variants are acquired. In Fig. 4, we report values for α = 1, k = 2, except for when these cutoffs result in A < 5 (infA, MAPK1, and PafA), in which case we report α = 1, k = 1. (b, c) Given a set of acquired variants A at varying cutoffs, we also computed how much the maximum fitness represented in A compares either to the maximum possible fitness value obtained across the full mutational scan (b) or to the 99th percentile of fitness values across the full mutational scan (c). To compare across proteins, we plotted the maximum acquired fitness value normalized by the maximum possible fitness (b) or by the 99th percentile with a threshold at 1 (c). At even at the most stringent cutoffs, the best acquired variant of most proteins has at least 50% of the fitness value of the maximum fitness peak. Additionally, at the most stringent cutoffs, the best acquired variant of all proteins is above or close to the 99th percentile of fitness values. (d) We plotted the number of acquired variants A, which is the denominator of the values plotted in (a). A gray horizontal dashed line is also plotted at 100.
Extended Data Fig. 5
Extended Data Fig. 5. Benchmarking enrichment of high-fitness variants.
(a, b) Variant effect prediction methods were ranked by the number of high-fitness variants acquired, controlling for the sample size N of total acquired variants used in Fig. 4, and ordered by the mean rank across eight proteins (Methods). Our consensus voting strategy (‘ESM vote’) ranks higher on average than all other methods based on its ability to acquire high-fitness variants. Methods profiled by Livesey and Marsh are in black text; ESM-based strategies profiled in this study are in red text. The full list of mean ranks is provided as Supplementary Data 5. ESM vote: the consensus strategy for acquiring substitutions used to select variants for experimental measurement in our antibody experiments. ESM summed: acquiring substitutions based on summed language model likelihood across the six language models used in this study. (b) Strip plot illustrating the number of high-fitness variants (vertical axis) among the top-N acquired substitutions to each protein (horizontal axis), where each point represents a different method for acquiring substitutions. These values are used to calculate the mean rank in (a). The expected number of variants that would be acquired via random guessing is plotted as a horizontal dashed line for each protein. (c, d) A similar analysis as in (a, b) but comparing the consensus voting strategy to each component of the ESM ensemble individually. Ensembling the recommendations across language models more consistently acquires high-fitness variants than when only using a single language model.
Extended Data Fig. 6
Extended Data Fig. 6. Scatter plots of DMS fitness data and ESM-ranked variants.
Variants of each protein (with a single-site substitution from wildtype) are plotted as blue circles according to the experimentally-determined fitness value on the y-axis and the summed log-likelihood across the six ESM models considered in our analysis. The variants acquired by the ESM consensus voting scheme are plotted as red circles. The cutoff above which we define a high-fitness variant is plotted as a gray dashed line. The marginal distribution of experimental fitness values is also plotted as a histogram along the y-axis.
Extended Data Fig. 7
Extended Data Fig. 7. Comparison of affinity fold improvements versus experimental scale.
Points indicate the results of affinity maturation beginning with an unmatured starting point (indicated by circles) or with a matured starting point (indicated by plus signs). The horizontal axis indicates the experimental scale in terms of variants tested or the experimental library size. The vertical axis indicates the fold improvement obtained by affinity maturation. Results from this study are plotted in black. While there is substantial uncertainty about the size of the mutational space explored by in-vivo somatic hypermutation (to include the unproductive B cell clones), we estimate a scale between 103 to 106 based on the number of B cells contained within a germinal center (about 103 to 104),, the mutation rate of somatic hypermutation (about 1 mutation per kb per division), the doubling time of B cells (about 10 hours), and a timescale of a few weeks. The results of natural affinity maturation of the unmatured antibodies in this study,,, are plotted as blue dots (Supplementary Data 1). We also plot the results of recent studies reporting advances in antibody engineering technologies, including Mason et al. who achieve a 3-fold improvement in the binding of trastuzumab to human epidermal growth factor receptor 2 (HER2) using a library of ~39 K variants and Wellner et al. who achieve between a 2.3- and 580-fold improvement in the binding of unmatured nanobodies to SARS-CoV-2 RBD (picked out of a naïve library) using a continuously evolving yeast system involving 106 to 107 sorted cells over four or more rounds of selection.

References

    1. Futuyma, D. J. Evolutionary Biology 3rd ed (Sinauer Associates, 1997).
    1. Wright, S. The roles of mutation, inbreeding, crossbreeding and selection in evolution. Proc. of the VI International Congress of Genetics 355–366 (Blackwell, 1932).
    1. Arnold FH. Directed evolution: bringing new chemistry to life. Angew. Chem. Int. Ed. Engl. 2018;57:4143–4148. - PMC - PubMed
    1. Fowler DM, Fields S. Deep mutational scanning: a new style of protein science. Nat. Methods. 2014;11:801–807. - PMC - PubMed
    1. Hunter SA, Cochran JR. Cell-binding assays for determining the affinity of protein–protein interactions. Methods Enzymol. 2016;580:21–44. - PMC - PubMed