. 2023 May;26(5):737-750.
doi: 10.1038/s41593-023-01315-6. Epub 2023 Apr 24.

Tau activation of microglial cGAS-IFN reduces MEF2C-mediated cognitive resilience

Affiliations

Tau activation of microglial cGAS-IFN reduces MEF2C-mediated cognitive resilience

Joe C Udeochu et al. Nat Neurosci. 2023 May.

Abstract

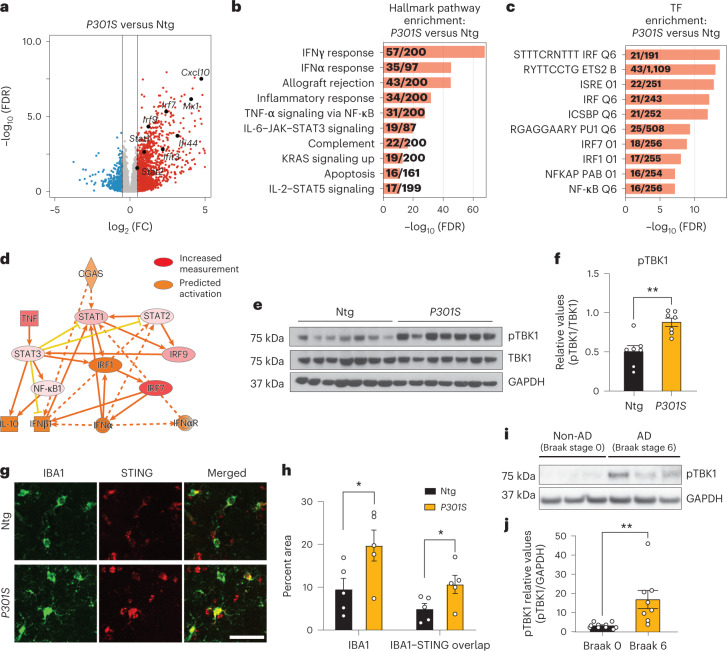
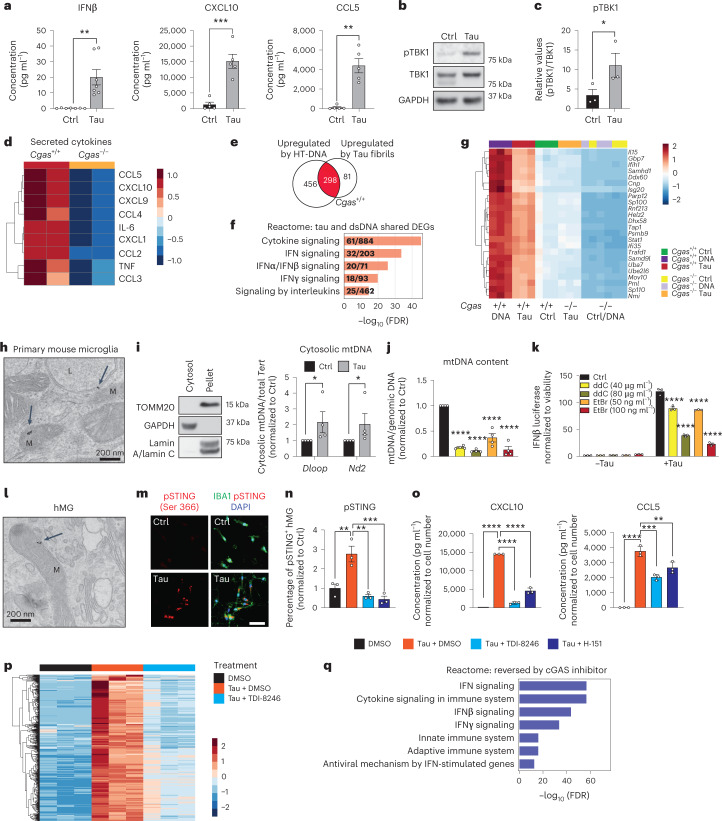
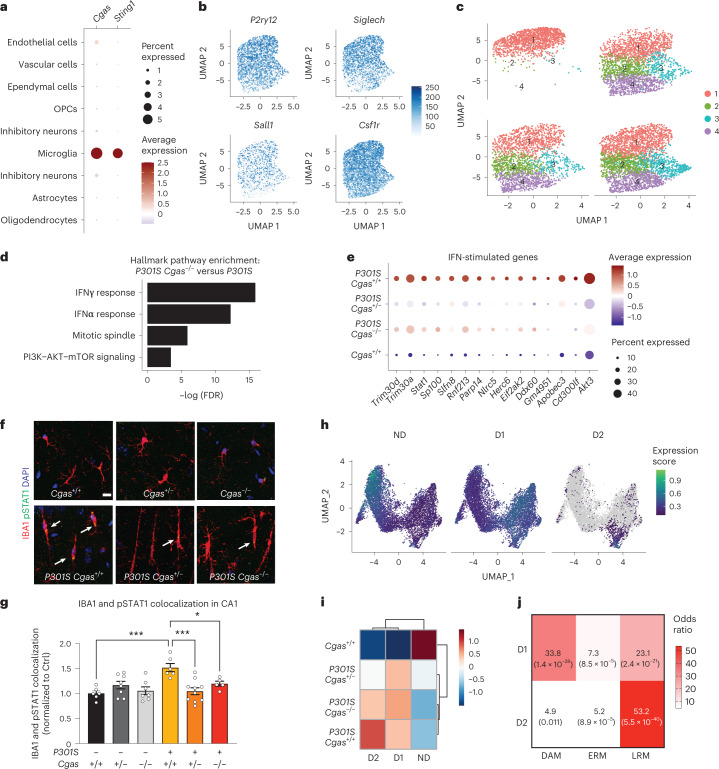
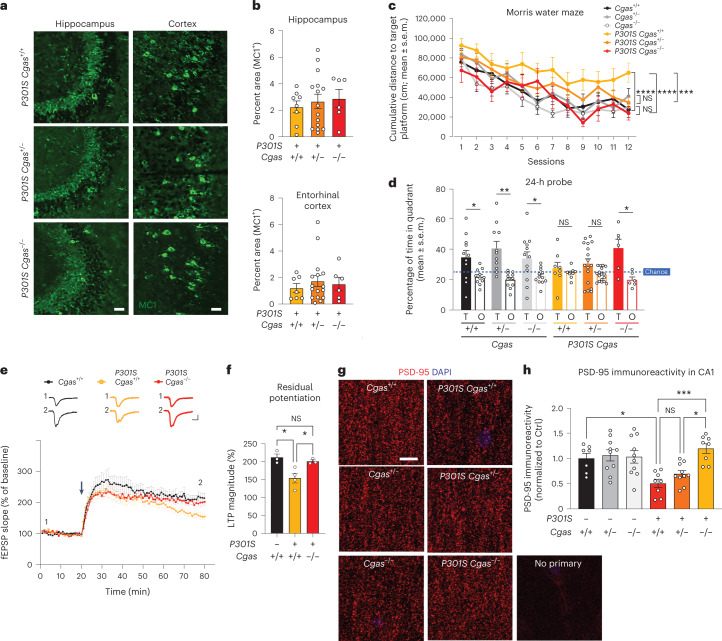
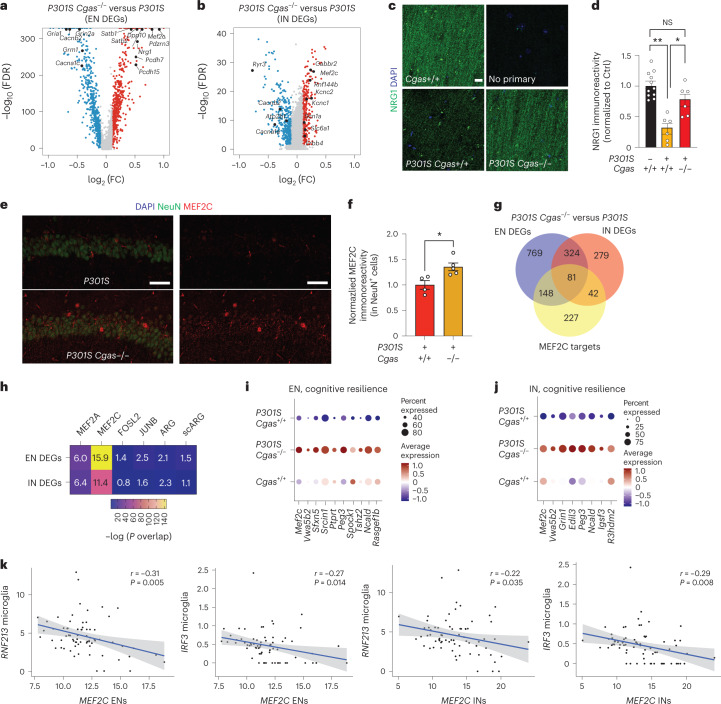
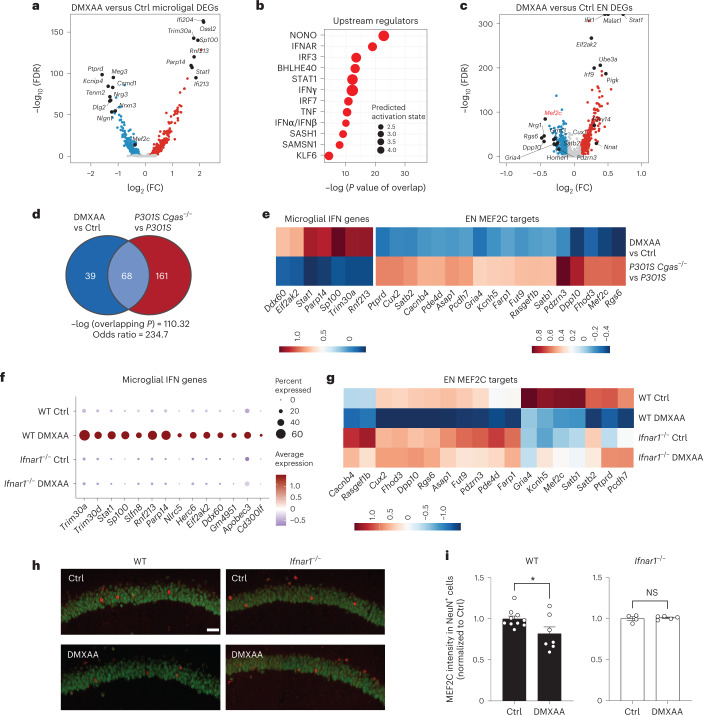
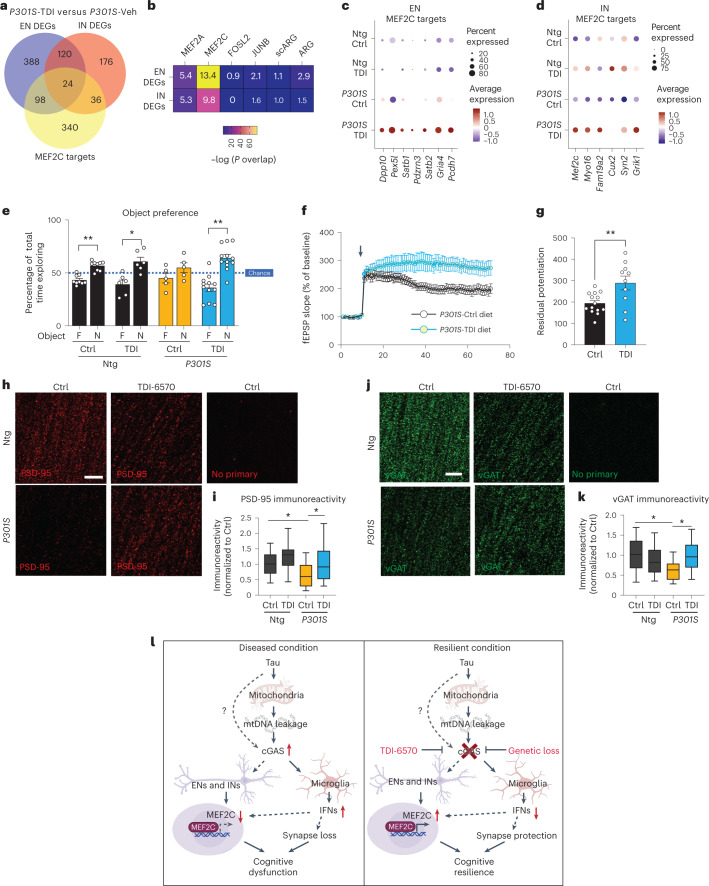
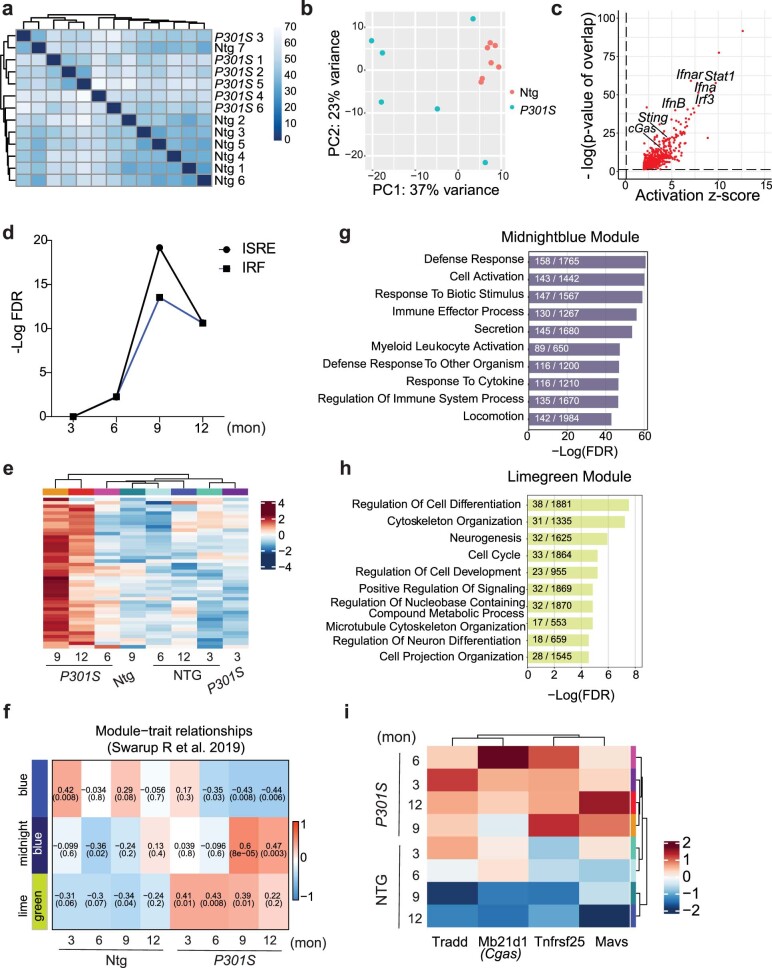
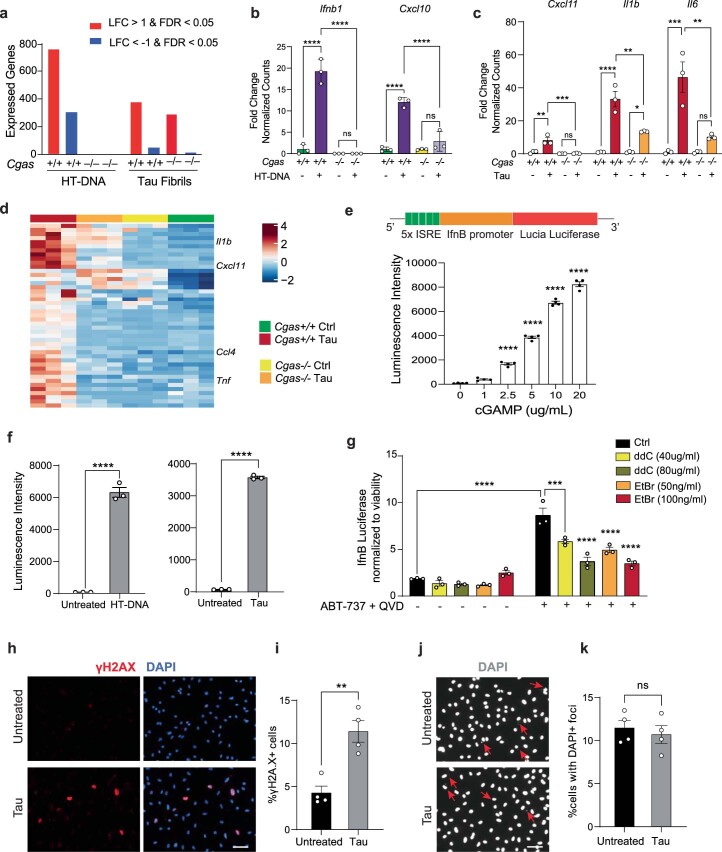
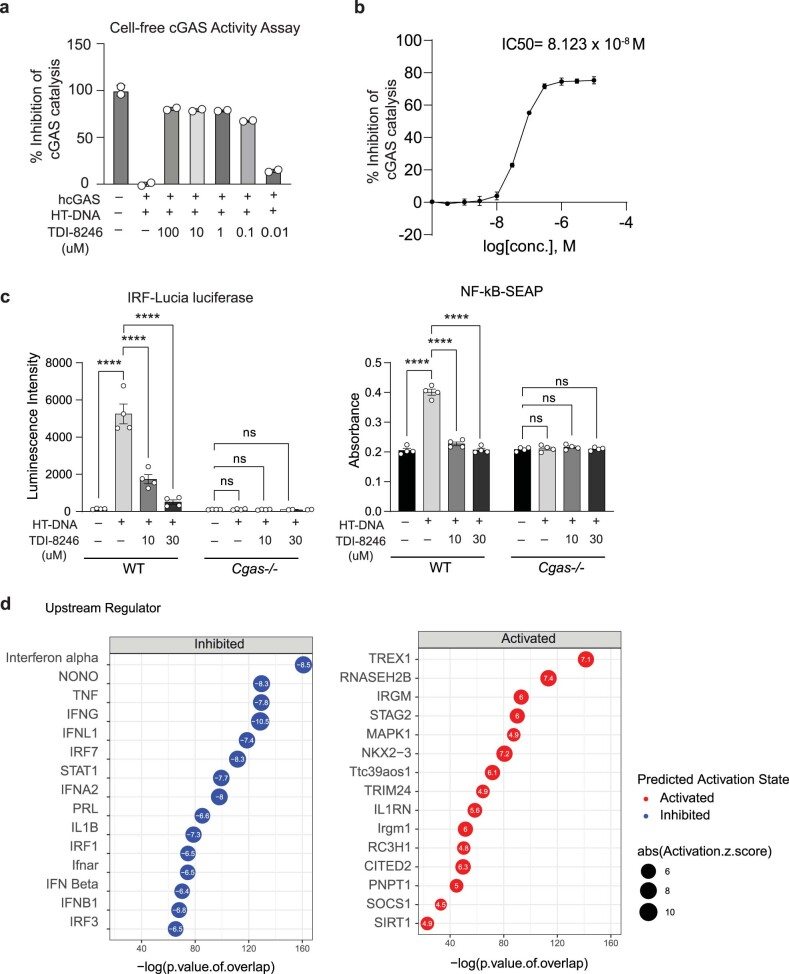
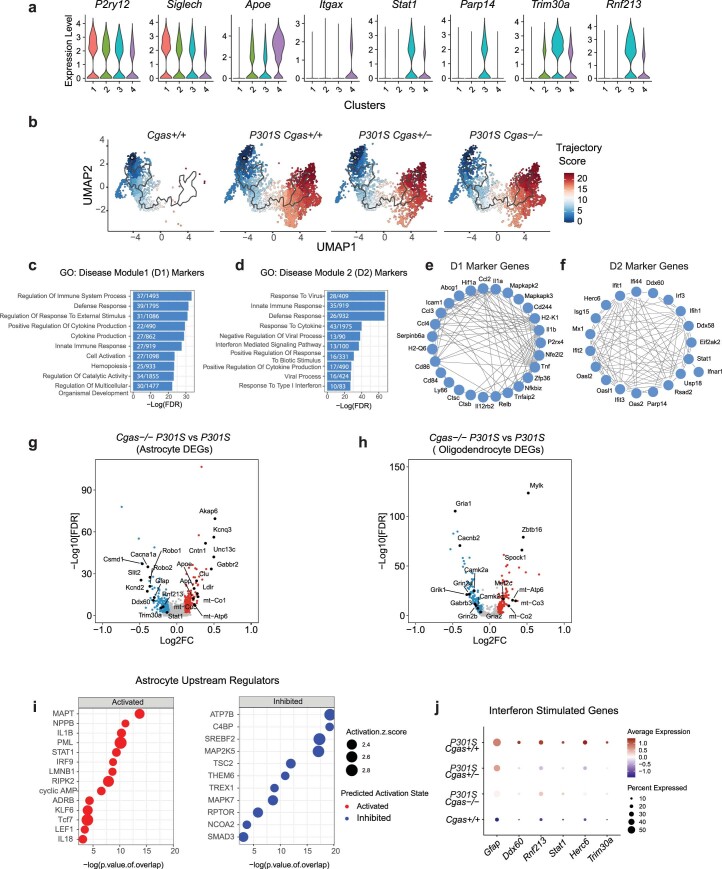
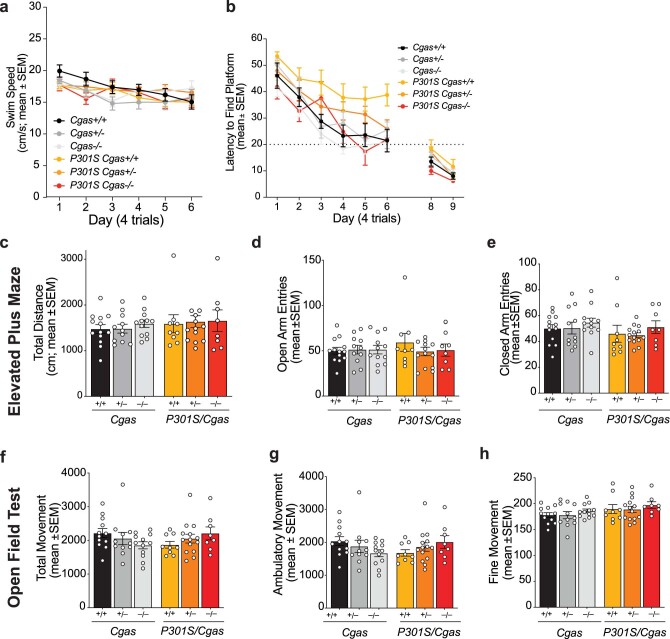
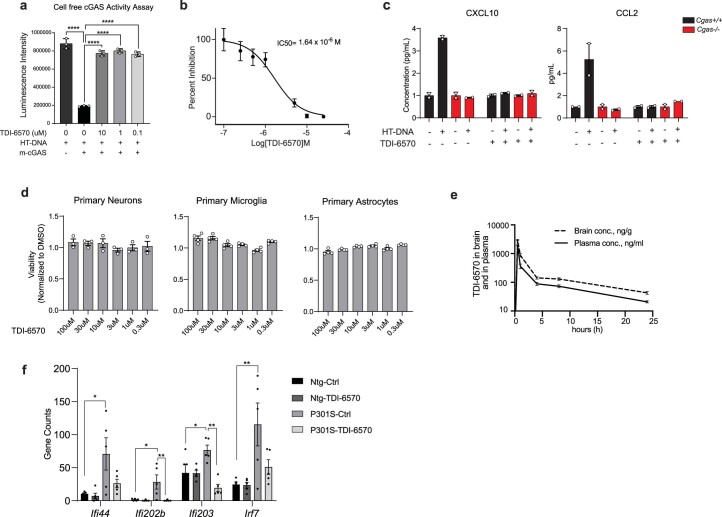
Pathological hallmarks of Alzheimer's disease (AD) precede clinical symptoms by years, indicating a period of cognitive resilience before the onset of dementia. Here, we report that activation of cyclic GMP-AMP synthase (cGAS) diminishes cognitive resilience by decreasing the neuronal transcriptional network of myocyte enhancer factor 2c (MEF2C) through type I interferon (IFN-I) signaling. Pathogenic tau activates cGAS and IFN-I responses in microglia, in part mediated by cytosolic leakage of mitochondrial DNA. Genetic ablation of Cgas in mice with tauopathy diminished the microglial IFN-I response, preserved synapse integrity and plasticity and protected against cognitive impairment without affecting the pathogenic tau load. cGAS ablation increased, while activation of IFN-I decreased, the neuronal MEF2C expression network linked to cognitive resilience in AD. Pharmacological inhibition of cGAS in mice with tauopathy enhanced the neuronal MEF2C transcriptional network and restored synaptic integrity, plasticity and memory, supporting the therapeutic potential of targeting the cGAS-IFN-MEF2C axis to improve resilience against AD-related pathological insults.


Conflict of interest statement

L.G. is founder and equity holder of Aeton Therapeutics, Inc. S.C.S. is an equity holder and a consultant of Aeton Therapeutics, Inc. R.R.R. is a stakeholder and Chair of the Scientific Advisory Board for Neuronasal, which develops treatments for concussion. R.R.R. is on the Scientific Advisory Board for Elevian Therapeutics, which develops antiaging therapies for stroke. All other authors declare that they have no competing interests.

Figures

Fig. 1
Fig. 1. The cGAS–STING pathway is activated in the hippocampi of mice with tauopathy and in human AD brains.
a, Volcano plot of RNA-seq data from bulk hippocampal tissue from 8- to 9-month-old P301S transgenic and non-transgenic mice (Wald test). Red and blue dots represent genes with a log2 FC (fold change) of > 0.5 and < −0.5, respectively. All other genes are colored gray. Selected upregulated IFN genes are labeled; n = 7 non-transgenic mice and n = 6 P301S transgenic mice; FDR, false discovery rate; Ntg, non-transgenic; FC, fold change. b, Gene set enrichment analysis showing hallmark pathways associated with the top 500 DEGs upregulated in P301S transgenic samples compared to in non-transgenic samples. c, Gene set enrichment analysis showing the top TFs associated with the top 500 DEGs upregulated in P301S transgenic samples compared to in non-transgenic samples. d, IPA prediction of cGAS as an upstream regulator of upregulated DEGs identified using an activation z score of >1 and a P value overlap of <0.05. e, Western blots for pTBK1, total TBK1 and GAPDH using hippocampal tissue lysates. Lanes 1–7: Ntg. Lanes 8–14: P301S transgenic. f, Ratio of pTBK1 to TBK1 from e showing significantly higher pTBK1 in P301S transgenic hippocampi than in non-transgenic hippocampi. Data are reported as mean ± s.e.m.; n = 7 animals per genotype; **P = 0.0015 two-tailed unpaired t-test. g, Representative immunofluorescence images of non-transgenic and P301S trasgenic hippocampi labeled with anti-IBA1 (green) and anti-STING (red); scale bar, 50 µm. h, Quantification of IBA1 and STING immunofluorescence intensities, showing increased IBA1 coverage and IBA1–STING overlap in P301S transgenic hippocampi. Results are presented as average intensity measurements from three to four sections per animal. Data are reported as mean ± s.e.m.; Ntg, n = 5; P301S, n = 5. IBA1: *P = 0.0498; IBA1–STING overlap: *P = 0.0497. Data were analyzed by two-tailed unpaired t-test. i, Representative western blots for pTBK1 and GAPDH using human frontal cortex brain lysates. Lanes 1–3: non-AD (Braak stage 0). Lanes 4–6: AD (Braak stage 6). j, Ratio of pTBK1 to GAPDH from i showing significantly higher pTBK1 in AD brains than in non-AD brains. Data are reported as mean ± s.e.m.; n = 10 non-AD brains and n = 8 AD brains; **P = 0.0054. Data were analyzed by two-tailed unpaired t-test. Source data
Fig. 2
Fig. 2. Tau stimulation induces a cGAS-dependent IFN response that partially depends on mitochondrial DNA leakage.
a, Quantification of IFNβ expression by ELISA and CXCL10 and CCL5 expression by MAGPIX multiplex assay in culture medium supernatants from untreated (Ctrl) and tau-treated (Tau) primary mouse microglia. Data are reported as mean ± s.e.m. IFNβ: n = 7 independent primary microglial culture preparations treated with tau, **P = 0.0016; CXCL10 and CCL5: n = 5 independent primary microglial culture preparations treated with tau, ***P = 0.0004 and **P = 0.0031. Data were analyzed by two-tailed unpaired t-test. b, Representative western blots for pTBK1, total TBK1 and GAPDH using mouse primary microglial cell lysates (lane 1: untreated; lane 2: treated with tau fibrils). c, Ratio of pTBK1 to TBK1 from b showing significantly higher pTBK1 in tau fibril-treated primary microglia than in untreated microglia. Data are reported as mean ± s.e.m.; n = 3 independent primary microglial culture preparations treated with tau, *P = 0.0027. Data were analyzed by two-tailed unpaired t-test. d, Heat map showing the normalized levels of tau-induced cytokines in Cgas+/+ and Cgas−/− primary cultured microglia. e, Bulk RNA-seq analysis for Cgas+/+ and Cgas−/− primary cultured microglia treated or not treated with tau fibrils or HT-DNA; n = 3 per condition. Venn diagram showing the overlap of genes upregulated by HT-DNA and tau treatment in Cgas+/+ microglia; log2 FC > 1 and FDR < 0.05. f, Top five Reactome pathways represented in upregulated DEGs common to HT-DNA (dsDNA) and tau-treated Cgas+/+ microglia; FDR < 0.05. g, Heat map summary of IFN-stimulated genes that are lower in Cgas−/− than in Cgas+/+ microglia stimulated with HT-DNA or tau. h, Electron micrograph of primary mouse microglia treated with tau fibrils and immunogold labeled with an antibody to tau; L, lysosome; M, mitochondria. The experiment was performed once, and tau particles were detected in multiple mitochondria from different fields (arrows). i, Left, western blot showing the absence of mitochondrial and nuclear markers in the cytosolic fraction. Right, quantification of cytosolic mtDNA by quantitative PCR (qPCR; Dloop1/Tert and Nd2/Tert) in cytosolic extracts of BV2 IFNβ–luciferase reporter cells treated with tau fibrils or untreated. Data are reported as mean ± s.e.m.; n = 4 biologically independent experiments; *P = 0.0286. Data were analyzed by two-tailed Mann–Whitney test. j, Ratio of mtDNA (Dloop1) to genomic DNA (Tert) measured by RT–qPCR on DNA extracts of BV2 IFNβ–luciferase reporter cells treated for 7 d with ddC (40 or 80 μg ml–1) or EtBr (50 or 100 ng ml–1) to generate mtDNA-depleted cells. The values are normalized to the untreated sample. Data are reported as mean ± s.e.m.; n = 4; ****P < 0.0001. Data were analyzed by one-way analysis of variance (ANOVA) followed by Dunnett’s multiple comparison test. Groups are color coded as in k. k, Control and mtDNA-depleted IFNβ–luciferase reporter BV2 cells were stimulated with and without tau fibrils. IFNβ signal and viability were measured 16 h later. IFNβ–luciferase signal is normalized to CellTiter-Glo signal to correct for viability/cell count. Data are reported as mean ± s.e.m.; n = 3 biologically independent samples; ****P < 0.0001. Data were analyzed by two-way ANOVA followed by a Sidak multiple comparison test. l, Electron micrograph of human iPSC-derived microglia treated with tau fibrils and immunogold labeled with an antibody to tau; M, mitochondria. The experiment was performed once, and tau particles were detected in multiple mitochondria from different fields (arrow). m, Immunostaining for phosphorylated STING (pSTING; Ser 366) and IBA1 in human iPSC-derived microglia treated with tau fibrils for 6 h or untreated. n, Quantification of the percentage of pSTING+ cells in human iPSC-derived microglia treated with tau fibrils and DMSO, 20 µM TDI-8246 and 2 µM H-151 for 18 h; n = 3. Data are reported as mean ± s.e.m.; n = 3 biologically independent samples. DMSO versus Tau + DMSO, **P = 0.0044; Tau + DMSO versus Tau + TDI-8256, **P = 0.0012; Tau + DMSO versus Tau + H-151, ***P = 0.0007. Data were analyzed by one-way ANOVA followed by a Tukey multiple comparison test. o, Quantification of CXCL10 and CCL5 protein expression by MAGPIX multiplex assay in culture medium supernatants from human iPSC-derived microglia treated with tau fibrils and DMSO, 20 µM TDI-8246 and 5 µM H-151; n = 3; **P < 0.01, ***P < 0.001, ****P < 0.0001. Data were analyzed by one-way ANOVA followed by a Tukey multiple comparison test. p, Heat map showing the expression of tau-inducible genes reversed by treatment with 20 µM TDI-8246 (a cGAS inhibitor); log2 FC > 0.5 or < 0.5 and FDR < 0.05. q, Gene set enrichment analysis showing Reactome pathways associated with tau-induced genes that were reversed by treatment with 20 µM TDI-8246; log2 FC > 0.5 and FDR < 0.05. Source data
Fig. 3
Fig. 3. cGAS promotes a tauopathy-associated microglial IFN signature distinct from DAMs.
a, Dot plot of normalized cell-type expression of Cgas and Sting1 (Tmem173) in snRNA-seq samples; OPCs, oligodendrocyte progenitor cells. b, Uniform manifold approximation and projection (UMAP) plots showing strong expression of marker genes P2ry12, Siglech, Sall1 and Csf1r in snRNA-seq microglial populations (n = 6 per genotype except for n = 5 for Cgas+/+). c, UMAP plots colored according to microglial subclusters and split by genotype. d, Gene set enrichment analysis showing that hallmark pathways associated with significantly downregulated genes (log2 FC < −0.1 and FDR < 0.05) in P301S Cgas−/− versus P301S are IFN pathways. e, Dot plot showing IFN-stimulated genes that are significantly lower in P301S Cgas+/ and P301S Cgas−/− microglia than in P301S Cgas+/+ microglia. f, Representative ×63 confocal images of immunostaining of pSTAT1 in the CA1 stratum radiatum of the mouse hippocampus; scale bar, 10 μm. g, Mean intensity of pSTAT1 measured in IBA1+ microglia in the CA1 striatum radiatum. Each circle represents the average intensity measurement of three images per animal. Data are reported as mean ± s.e.m.; n = 6 Cgas+/+, n = 8 Cgas+/−, n = 7 Cgas−/−, n = 6 P301S Cgas+/+, n = 9 P301S Cgas+/−, n = 5 P301S Cgas−/−. Cgas+/+ versus P301S Cgas+/+: ***P = 0.0002, P301S Cgas+/+ versus P301S Cgas+/−: ***P = 0.0002, P301S Cgas+/+ versus P301S Cgas−/−: *P = 0.0415. Data were analyzed by two-way ANOVA followed by a Tukey multiple comparison test. h, UMAP plots showing gene expression modules associated with microglial transformation; ND, non-disease. i, Heat map showing the association of gene modules with genotype. j, Analysis of D1 and D2 markers compared to DAM, early-response microglia (ERM) signatures and late-response microglia (LRM) signatures.
Fig. 4
Fig. 4. Loss of cGAS rescues tauopathy-induced hippocampal synapse loss, synaptic plasticity and memory deficits without affecting tau load.
a, Representative immunofluorescence images of MC1 immunostaining in the hippocampi and entorhinal cortexes of 8- to 9-month-old mice; scale bar, 50 µm. b, Percentage of MC1+ area in the hippocampus or entorhinal cortex of P301S Cgas+/+, P301S Cgas+/− and P301S Cgas−/− mice. Data were analyzed by two-way ANOVA. c, Cumulative search distance to target platform during hidden trials (sessions 112) in a Morris water maze assessment of spatial learning and memory in 7- to 8-month-old P301S Cgas+/+, P301S Cgas+/− and P301S Cgas−/− mice and their non-transgenic littermates. Males and females were tested on separate days. Data represent both sexes combined; n = 12 Cgas+/+, n = 11 Cgas+/, n = 11 Cgas−/−, n = 8 P301S Cgas+/+, n = 17 P301S Cgas+/−, n = 6 P301S Cgas−/−. Cgas+/+ versus P301S Cgas+/+: ****P < 0.0001; P301S Cgas+/+ versus P301S Cgas−/−: ****P < 0.0001; P301S Cgas+/+ versus P301S Cgas+/−: ***P = 0.0002. Data were analyzed by two-way ANOVA with a Tukey multiple comparisons test; NS, not significant. d, Percentage of time spent in the target (T) or the average time spent in the nontarget (others; O) quadrants during the 24-h probe in the W Morris water maze. assessment; n = 12 Cgas+/+, *P = 0.0293; n = 11 Cgas+/−, ** P = 0.0035; n = 11 Cgas−/−, *P = 0.0370; n = 8 P301S Cgas+/+; n = 17 P301S Cgas+/−; n = 6 P301S Cgas−/−, *P = 0.0209. Data were analyzed by one-tailed paired t-test. e, Field excitatory postsynaptic potentials (fEPSPs) were recorded in the dentate gyrus molecular layer, and a TBS protocol was applied (arrow) to the perforant pathway to induce LTP. Representative traces show fEPSPs before and after LTP induction (top); scale bars, 0.4 mV and 5 ms. The fEPSP slope measurements made up to 60 min after TBS were normalized to the mean baseline fEPSP slope before LTP induction (bottom, 8–11 slices from three to four mice: n = 3 Cgas+/+, n = 4 P301S Cgas+/+, n = 3 P301S Cgas−/−). f, The LTP magnitude was calculated from the normalized mean fEPSP slope 55–60 min after TBS was applied. Data are reported as mean ± s.e.m. (8–11 slices from three to four mice per group; n = 3 Cgas+/+, n = 4 P301S Cgas+/+, n = 3 P301S Cgas−/−. Cgas+/+ versus P301S Cgas+/+: *P = 0.0191; P301S Cgas+/+ versus P301S Cgas−/−: *P = 0.0477. Data were analyzed by one-way ANOVA followed by a Tukey multiple comparisons test. g, Representative confocal images of the hippocampal CA1 striatum radiatum labeled with PSD-95 antibody; scale bar, 10 μm. h, Mean intensity of PSD-95 puncta measured in the CA1 striatum radiatum. Each circle represents the average intensity measurement of three to five images per animal. Data are presented as normalized to control. Error bars represent mean ± s.e.m. (n = 7 Cgas+/+, n = 10 Cgas+/−, n = 10 Cgas−/−, n = 8 P301S Cgas+/+, n = 10 P301S Cgas+/−, n = 8 P301S Cgas−/−; Cgas+/+ versus P301S Cgas+/+: *P = 0.0275; P301S Cgas+/− versus P301S Cgas−/−: *P = 0.0111; P301S Cgas+/+ versus P301S Cgas−/−: ***P = 0.0004). Data were analyzed by two-way ANOVA followed by a Tukey multiple comparisons test.
Fig. 5
Fig. 5. The MEF2C transcription network is enhanced by Cgas deletion and inversely correlates with the microglial IFN response in mice and humans.
a, Volcano plot showing representative DEGs that are upregulated in P301S Cgas−/− compared to in P301S Cgas+/+ ENs; log2 FC of >0.1 or <−0.1, FDR < 0.05. b, Volcano plot showing representative DEGs that are upregulated in P301S Cgas−/− compared to in P301S Cgas+/+ INs; log2 FC of >0.1 or <−0.1, FDR < 0.05. c, Representative confocal images of immunostaining of NRG1 in the CA1 stratum radiatum of the mouse hippocampus; scale bar, 10 μm. d, Mean intensity of NRG1 measured in the CA1 striatum radiatum. Each circle represents the average intensity measurement of three images per animal. Data are reported as mean ± s.e.m.; n = 11 Cgas+/+, n = 6 P301S Cgas+/+, n = 8 P301S Cgas+/−, n = 6 P301S Cgas−/−. Cgas+/+ versus P301S Cgas+/+: **P = 0.0016, P301S Cgas+/+ versus P301S Cgas−/−: *P = 0.0203. Data were analyzed by two-way ANOVA followed by a Tukey multiple comparisons test. e, Representative ×40 confocal images of immunostaining of MEF2C and NeuN in the CA1 pyramidal layer of the mouse hippocampus; scale bar, 50 μm. f, Mean intensity of MEF2C in MEF2C+NeuN+ neurons in the CA1 pyramidal layer. Each circle represents the average intensity measurement of three images per animal. Data are presented as normalized to control. Data are reported as mean ± s.e.m.; n = 4 P301S Cgas+/+, n = 5 P301S Cgas−/−; *P = 0.0178. Data were analyzed by two-tailed unpaired t-test g, Venn diagram of the overlaps among EN DEGs, IN DEGs and MEF2C target genes. h, Heatmap showing the overlap between EN/IN DEGs and lists of TF target genes (MEF2A, MEF2C, FOSL2 and JUNB) and activity-induced DEGs (ARG and scARG). Numbers in each box represent the overlapping odds ratio. Overlapping P values were calculated with a Fisher’s exact test. i, Dot plot showing the expression of DEGs significantly upregulated by Cgas deletion (FDR < 0.05, log2 FC ≥ 0.1) that are positively correlated with human cognitive resilience in EN clusters. j, Dot plot showing the expression of significantly upregulated DEGs by Cgas deletion (FDR < 0.05, log2 FC ≥ 0.1) that are positively correlated with human cognitive resilience in IN clusters. k, Simple linear regression analysis with standard error showing negative correlations between the expression of MEF2C in ENs and RNF213 (r = −0.31, P = 0.005) and IRF3 (r = −0.27, P = 0.014) in microglia and MEF2C in INs and RNF213 (r = −0.22, P = 0.035) and IRF3 (r = −0.29, P = 0.008) in microglia in 70 individuals with AD.
Fig. 6
Fig. 6. STING activation elevates microglial IFN-I and diminishes the neuronal MEF2C transcription network.
a, Volcano plot showing representative DEGs in microglia of DMXAA-treated versus control WT mouse hippocampi; log2 FC of >0.1 or <−0.1 and FDR < 0.05. b, Ingenuity Pathway Upstream Regulator Analysis using DEGs from a. c, Volcano plot showing representative DEGs in ENs of DMXAA-treated versus control WT mouse hippocampi; log2 FC of >0.1 or <−0.1 and FDR < 0.05. d, Venn diagram showing the overlap of MEF2C target genes in DMXAA-treated versus control ENs and those in P301S Cgas–/– versus P301S ENs in the hippocampus. e, Heat map of log2 FC of overlapping differentially expressed MEF2C target genes in DMXAA-treated versus control WT and in P301S Cgas–/– versus P301S ENs in the hippocampus; scale, log2 FC. f, Dot plot showing microglial IFN gene expression in DMXAA-treated and control WT and Ifnar1−/− mouse hippocampi. g, Downregulation of MEF2C target genes in WT neurons treated with DMXAA was rescued in Ifnar1−/− neurons; scale, average gene expression. h, Representative ×25 confocal images of immunostaining of MEF2C and NeuN in the CA1 pyramidal layer of the mouse hippocampus in control and DMXAA-injected WT and Ifnar1−/− mice; scale bar, 50 μm. i, Mean intensity of MEF2C in MEF2C+NeuN+ neurons in the CA1 pyramidal layer. Each circle represents the average intensity measurement of three images per animal. Data are reported as mean ± s.e.m. WT: n = 10 control and n = 7 DMXAA; Ifnar1−/−: n = 4 control and n = 5 DMAXX; *P = 0.0367. Data were analyzed by two-tailed unpaired t-test.
Fig. 7
Fig. 7. A brain-permeable cGAS inhibitor enhances the MEF2C network and protects against synapse loss and cognitive deficits in mice with tauopathy.
a, Venn diagram of the overlaps in DEGs between P301S transgenic mice treated with TDI-6570 (P301S-TDI) and P301S transgenic mice treated with vehicle control (P301S-Veh) in ENs, INs and MEF2C target genes. b, Heat map showing the overlap between EN/IN DEGs and lists of TF target genes (MEF2A, MEF2C, FOSL2 and JUNB) and activity-induced DEGs (ARG and scARG). Numbers in each box represent the overlapping odds ratio. c, Dot plot showing the expression of significantly upregulated DEGs (FDR < 0.05, log2 FC ≥ 0.1) that are MEF2C targets in non-transgenic control (Ntg Ctrl), non-transgenic TDI-6570 (Ntg TDI), P301S transgenic control (P301S Ctrl) and P301S transgenic TDI-6570 (P301S TDI) EN clusters. d, Dot plot showing the expression of significantly upregulated DEGs (FDR < 0.05, log2 FC ≥ 0.1) that are MEF2C targets in non-transgenic control, non-transgenic TDI-6570, P301S transgenic control and P301S transgenic TDI-6570 IN clusters. e, Novel object recognition test for non-transgenic and P301S transgenic male mice fed 150 mg per kg (body weight) TDI-6570 or control diet for 3 months; F, familiar object; N, novel object. Data are reported as mean ± s.e.m.; n = 9 non-transgenic control, n = 6 non-transgenic TDI-6570, n = 5 P301S trasgenic control, n = 12 P301S transgenic TDI-6570. Non-transgenic control: **P = 0.00181; non-transgenic TDI-6570: *P = 0.0422; P301S transgenic TDI-6570: **P = 0.00167. Data were analyzed by two-tailed paired t-test for each condition. f, fEPSPs were recorded in the CA1 region, and a TBS protocol was applied (arrow) to the CA3 pathway to induce LTP. Data are reported as mean ± s.e.m. One to three slices per mouse were used; control, n = 13; TDI-6570, n = 9. g, LTP magnitude was calculated from the normalized mean fEPSP slope 50–60 min after TBS was applied. Data are reported as mean ± s.e.m.; one to three slices per mouse were used; n = 13 control; n = 9 TDI-6570; **P = 0.0058. Data were analyzed by two-tailed unpaired t-test. h, Representative confocal images of the hippocampal CA1 striatum radiatum labeled with PSD-95 antibody; scale bar, 10 μm. i, Mean intensity of PSD-95 puncta measured in the CA1 striatum radiatum. The center line is the median, box limits are the 25th to 75th percentiles, and whiskers are the minimum to maximum. Three to five images were taken per animal; n = 13 non-transgenic control, n = 12 non-transgenic, n = 9 TDI-6570, n = 12 P301S TDI-6570. Non-transgenic control versus P301S control: *P = 0.03, P301S control versus P301S TDI-6570: *P = 0.043. Data were analyzed by a two-way ANOVA mixed model. j, Representative confocal images of the hippocampal CA1 striatum radiatum labeled with vGAT antibody (scale bar = 10 μm). k, Mean intensity of vGAT puncta measured in the CA1 striatum radiatum. The center line is the median, box limits are the 25th to 75th percentiles, and whiskers are the minimum to maximum. Three to five images were taken per animal; n = 12 non-transgenic control, n = 11 non-transgenic TDI-6570, n = 8 P301S control, n = 13 P301S TDI-6570. Non-transgenic control versus P301S control: *P = 0.045, P301S control versus P301S TDI-6570: *P = 0.032. Data were analyzed by a two-way ANOVA mixed model. l, Working model illustrating the cGAS–IFN–MEF2C axis in tauopathy. In disease/vulnerable conditions, pathogenic tau activates the cGAS-dependent IFN response via mtDNA leakage in microglia and a reduction of the MEF2C transcriptional network in ENs and INs, resulting in cognitive dysfunction. Loss of cGAS reduces the IFN response in microglia and enhances the MEF2C transcriptional network, resulting in cognitive resilience.
Extended Data Fig. 1
Extended Data Fig. 1. Temporal analysis of interferon gene signature in P301S mice (Related to Fig. 1).
a. Hierarchical clustering of Non-transgenic (Ntg) and P301S hippocampal RNA counts. b. PCA plot showing distribution on Ntg and P301S samples according to variance driven by principal component 1 (PC1) and principal component 2 (PC2). c. Predicted upstream regulators associated with upregulated DEGs in P301S samples, from Ingenuity Pathway Analysis. P-value overlap < 0.01. Right-tailed Fisher’s Exact Test. d. Enrichment of interferon-sensitive response elements (ISREs) and interferon regulator factors (IRFs) among DEGs in 3-, 6-, 9-, and 12-month-old P301S hippocampi. e. Heatmap showing expression patterns of interferon DEGs from (d). f. Module-trait relationship heatmap derived from weighted gene correlation analyses showing correlation of gene expression modules with genotype and age. g. Top 10 Gene Ontology pathways overrepresented in midnight-blue module. h. Top 10 Gene Ontology pathways overrepresented in lime-green module. i. Cytosolic nucleotide-sensing genes, Cgas and Mavs, are components of the lime-green module.
Extended Data Fig. 2
Extended Data Fig. 2. cGAS promotes IFN and proinflammatory cytokine signaling in tau-stimulated microglia (Related to Fig. 2).
a. Summary of DEGs identified using DESeq2 (|log fold-change| > 1 and FDR < 0.05), grouped by genotype and treatment. b. Bar plots showing normalized counts of diminished Ifnb1 and Cxcl10 induction in HT-DNA-treated Cgas−/− microglia. Data are reported as mean ± SD. n = 3 biologically independent samples. **** p < 0.0001. One-way ANOVA for each gene. c. Representative proinflammatory cytokine genes, Cxcl11, Il1b and Il6, that are significantly reduced in tau-stimulated Cgas-/-, compared to Cgas+/+ microglia. Data are reported as mean ± SEM. n = 3 biologically independent samples. Cxcl11: Cgas +/+ vs P301S Cgas +/+ ** p = 0.0018, P301S Cgas +/+ vs P301S Cgas−/− *** p = 0.0009,,. Il1b: Cgas +/+ vs P301S Cgas +/+ **** p < 0.0001, P301S Cgas +/+ vs P301S Cgas−/− ** p = 0.0016, Cgas−/− vs P301S Cgas−/− * p = 0.0241. Il6: Cgas +/+ vs P301S Cgas +/+ *** p = 0.0006, P301S Cgas +/+ vs P301S Cgas−/− ** p = 0.0028. One-way ANOVA followed by Tukey’s multiple comparisons test for each gene. d. Heatmap summary of genes with lower induction in tau-treated Cgas−/−, compared Cgas+/+ microglia. e. BV2 cells stably expressing IfnB-responsive luciferase reporter construct show dose-dependent increase of secreted luciferase activity in response to cGAMP. Data are reported as mean ± SEM. n = 4 biologically independent samples. Adjusted p-value <0.0001 for 0 vs 2.5, 0 vs 5, 0 vs 10, 0 vs 20. One-way ANOVA followed by Dunnett multiple comparison test. f. Quantification of luminescence intensity in BV2 IfnB luciferase reporter cells treated or not with HT-DNA or tau fibrils. Data are reported as mean ± SEM. n = 3 biologically independent samples. **** p < 0.0001. Two-tailed unpaired t-test. g. Control and mtDNA-depleted (ρ ͦ) IfnB luciferase-reporter BV2 cells were stimulated or not with ABT-737 + QVD (10 μm each). IfnB signal and viability were measured 18 h later. IfnB-luciferase signal is shown normalized to Cell TiterGlo signal to correct for viability/cell count. Data are reported as mean ± SEM. n = 3 biologically independent samples. *** p = 0.0004, **** p < 0.0001. Two-way ANOVA. h. Immunostaining for γH2A.X in primary cultured mouse microglia treated with tau fibrils. i. Quantification of the percentage of γH2A.X + cells in (h). Data are reported as mean ± SEM. n = 4 biologically independent samples. ** p < 0.0029. Two-tailed unpaired t-test. j. Visualization of extranuclear DNA foci indicated by arrows using DAPI staining. k. Quantification of the percentage of cells with extranuclear DNA foci in (j). Data are reported as mean ± SEM. n = 4 biologically independent samples. ns: not significant. Two-tailed unpaired t-test.
Extended Data Fig. 3
Extended Data Fig. 3. Activity and specificity of a human cGAS inhibitor TDI-8246 (Related to Fig. 2).
a. Inhibitory effects of TDI-8246 (0.01–100 µM concentration) on human cGAS/HT-DNA-catalyzed conversion of ATP and GTP to produce cGAMP measured by remaining ATP concentrations in the reactions using ATP Glo assay. b. Dose-dependent inhibition of cGAS activity (as measured in a) in response to HT-DNA. IC50 = 8.123 × 10−8 M. Data are reported as mean ± SD. n = 3 biologically independent samples per condition. c. Quantification of IRF-Lucia luciferase luminescence intensity and NF-κB-SEAP absorbance of WT and Cgas−/− THP-1 dual cells treated with HT-DNA and TDI-8246 as indicated. Data are reported as mean ± SEM. n = 4 biologically independent samples. **** p < 0.0001. Two-way ANOVA followed by Tukey’s multiple comparisons test (n = 4). d. Predicted upstream regulators associated with DEGs in DMSO + tau vs TDI-8246+tau from ingenuity pathway analysis. P-value overlap < 0.05, Activation Z score > 2 or < -2. Right-tailed Fisher’s exact test.
Extended Data Fig. 4
Extended Data Fig. 4. snRNA-seq analyses of microglia, astrocytes, and oligodendrocytes (Related to Fig. 3).
a. Violin plots showing expression level of homeostatic (P2ry12, Siglech), disease-associated (Apoe, Itgax) and interferon (Parp14, Stat1, Trim30a, Rnf213) genes in microglia clusters. b. Microglial trajectory plots colored by cell state trajectory scores identified using Monocle 3 and split by genotype. c. Top gene ontology terms enriched in disease module 1 markers. d. Top gene ontology terms enriched in disease module 2 markers. e. String interaction plot of disease module 1 markers. f. String interaction plot of disease module 2 markers. g. Volcano plot showing representative DEGs in P301S Cgas−/−, compared to P301S Cgas+/+ astrocytes. (logFC > =0.1 or < =-0.1, FDR < 0.05). h. Volcano plot showing representative DEGs in P301S Cgas−/−, compared to P301S Cgas+/+ oligodendrocytes. (logFC > = 0.1 or <=−0.1, FDR < 0.05). i. Predicted upstream regulators associated with DEGs in P301S Cgas−/−, compared to P301S Cgas+/+ astrocytes, from Ingenuity Pathway Analysis. P-value overlap < 0.05, Activation Z score > 2 or < -2. Right-tailed Fisher’s exact test. j. Dot plot showing interferon-stimulated genes that are significantly lower in P301S Cgas+/− and P301S Cgas−/− astrocytes than in P301S Cgas+/+ astrocytes.
Extended Data Fig. 5
Extended Data Fig. 5. Loss of Cgas does not affect swim speed, overall activity, or anxiety in tauopathy mice (Related to Fig. 4).
a. Average swim speeds measured during each date of hidden platform trials (days 1–6). Data are reported as mean ± SEM. n = 12 Cgas +/+, n = 11 Cgas +/−, n = 11 Cgas−/−, n = 8 P301S Cgas +/+, n = 17 P301S Cgas +/−, n = 6 P301S Cgas−/−. b. Cued platform probes (days 8–9) showing lack of visual impairment in all mice tested. Data are reported as mean ± SEM. n = 12 Cgas +/+, n = 11 Cgas +/−, n = 11 Cgas−/−, n = 8 P301S Cgas +/+, n = 17 P301S Cgas +/−, n = 6 P301S Cgas−/−. ce. Elevated plus maze assessment of anxiety levels by measuring total distance traveled, open arm entries and closed-arm entries. Data are reported as mean ± SEM. n = 13 Cgas +/+, n = 11 Cgas +/−, n = 12 Cgas−/−, n = 9 P301S Cgas +/+, n = 14 P301S Cgas +/−, n = 8 P301S Cgas−/−. No genotype effects observed for all groups. Two-way ANOVA. fh. Open-field assessment of total, fine and ambulatory movement showed no genotype effects of overall activity in 8–9-month-old mice. Data are reported as mean ± SEM. n = 12 Cgas +/+, n = 11 Cgas +/−, n = 12 Cgas−/−, n = 9 P301S Cgas +/+, n = 14 P301S Cgas +/−, n = 8 P301S Cgas−/−. Two-way ANOVA.
Extended Data Fig. 6
Extended Data Fig. 6. Cellular markers of excitatory and inhibitory neurons identified in snRNA-seq analyses of hippocampi of P301S mice with or without cGAS (Related to Fig. 5).
a. UMAP projection showing 12 distinct hippocampal excitatory neuron populations identified using unsupervised clustering of snRNA-seq data. b. Dot plot showing classification of excitatory neuron clusters by expression of granule, CA1, CA2, and CA3 markers. c. Dot plot of top shared DEGs from excitatory neuron clusters showing their enrichment in the different excitatory neuron clusters categorized according to granule, CA1, and CA2/3 markers. d. Pie chart summarizing the proportion of DEGs from clusters pertaining to dentate gyrus (DG), CA1, and CA2/3 clusters. e. UMAP projection showing 11 distinct hippocampal inhibitory neuron populations identified using unsupervised clustering of snRNA-seq data.
Extended Data Fig. 7
Extended Data Fig. 7. Effects of Cgas deletion on MEF2C transcriptional network in different cell types (Related to Fig. 5).
a. Heatmap of the expression of significant DEGs (FDR < 0.05, logFC > =0.1 or < =-0.1) that are MEF2C targets in WT, P301S, and P301S Cgas−/− excitatory neuron clusters. b. Heatmap of the expression of significant DEGs (FDR < 0.05, logFC > =0.1 or < =-0.1) that are MEF2C targets in WT, P301S, and P301S Cgas−/− inhibitory neuron clusters. c. Dot plot showing normalized cell-type expression of Mef2c RNA in snRNA-Seq samples. d. Heatmap showing the overlap between DEGs and lists of MEF2 transcription factor target genes (MEF2A and MEF2C) across different cell types. Numbers in each box represents the overlapping odds ratio. P value calculated with Fisher’s exact test.
Extended Data Fig. 8
Extended Data Fig. 8. Downregulation of neuronal MEF2C transcriptional network in RNaseT2−/− interferonopathy (Related to Fig. 5).
a. Heatmap of scaled log fold-change of microglia interferon genes and neuronal MEF2C targets in RNaseT2−/− vs Ntg and P301S Cgas−/− vs P301S. b. Statistical enrichment analysis of overlap between RNaseT2−/− neuronal DEGs and MEF2C, MEF2A, JUNB, FOSL2, activity-regulated genes, and single-cell activity regulated genes (scARG). Numbers in the heatmap refers to odds ratios, color refers to -log(overlapping_p_val) via Fisher’s exact test.
Extended Data Fig. 9
Extended Data Fig. 9. Microglial gene expression changes in response to DMXAA treatment in WT and Ifnar1−/− mice (Related to Fig. 6).
a. Dot plot showing expression of interferon-stimulated genes across cell types. b. Volcano plot showing representative DEGs in microglia of DMXAA treated vs control Ifnar1−/− mouse hippocampi. (log2FC > 0.1, FDR < 0.05).
Extended Data Fig. 10
Extended Data Fig. 10. TDI-6570 is a non-toxic specific brain permeable cGAS inhibitor (Related to Fig. 7).
a. Inhibitory effects of TDI-6570 (10–0.1 µM concentration) on mouse cGAS/HT-DNA-catalyzed conversion of ATP and GTP to produce cGAMP measured by remaining ATP concentrations in the reactions using ATP Glo assay. Data are reported as mean ± SD. n = 3; **** p < 0.0001. One-way ANOVA. b. Dose-dependent inhibition of cGAS activity in BV2 IfnB reporter line in response to HT-DNA. IC50 = 1.64 µM. Data are reported as mean ± SD. n = 4 per condition. c. Quantification of CXCL10 and CCL2 proteins by MagPix multiplex ELISA in culture medium supernatants of WT and Cgas−/− primary mouse microglia treated with HT-DNA and TDI-6570 as indicated. n = 2 biologically independent samples. d. Cellular viability of mouse primary neurons (n = 3), microglia (n = 4) and astrocytes (n = 4) cultured in presence of TDI-6570 (0.3–100 µM concentration) for 24 h. Data are reported as mean ± SEM. e. Concentrations (in log10) of TDI-6570 in brain and plasma of C57BL/6 mice after a single dose (50 mg/kg) IP administration (n = 3) as determined by LC-MS/MS analysis. f. Bar plots of normalized counts show downregulation of interferon-inducible genes in the hippocampi of Ntg or P301S mice treated with 600 mg/kg TDI-6570 or Ctrl diets. Data are reported as mean ± SEM. n = 5 per condition. Ifi44: Ntg-Ctrl vs P301S-Ctrl * p = 0.0198; Ifi202b: Ntg-Ctrl vs P301S-Ctrl * p = 0.0125, P301S-Ctrl vs P301S-TDI-6570 ** p = 0.0091; Ifi203: Ntg-Ctrl vs P301S-Ctrl * p = 0.0480, P301S-Ctrl vs P301S-TDI-6570 ** p = 0.0011; Irf7: Ntg-Ctrl vs P301S-Ctrl * p = 0.0097. One-way ANOVA followed with Tukey’s multiple comparisons test for each gene.

Comment in

  • Resilient brains run out of (c)GAS.
    Salvador AFM, Kipnis J. Salvador AFM, et al. Nat Immunol. 2023 May;24(5):741-742. doi: 10.1038/s41590-023-01485-2. Nat Immunol. 2023. PMID: 37095376 No abstract available.

References

    1. DeTure MA, Dickson DW. The neuropathological diagnosis of Alzheimer’s disease. Mol. Neurodegener. 2019;14:32. doi: 10.1186/s13024-019-0333-5. - DOI - PMC - PubMed
    1. Jack CR, Jr., et al. NIA-AA Research Framework: toward a biological definition of Alzheimer’s disease. Alzheimers Dement. 2018;14:535–562. doi: 10.1016/j.jalz.2018.02.018. - DOI - PMC - PubMed
    1. Aisen PS, et al. On the path to 2025: understanding the Alzheimer’s disease continuum. Alzheimers Res. Ther. 2017;9:60. doi: 10.1186/s13195-017-0283-5. - DOI - PMC - PubMed
    1. Kunkle BW, et al. Genetic meta-analysis of diagnosed Alzheimer’s disease identifies new risk loci and implicates Aβ, tau, immunity and lipid processing. Nat. Genet. 2019;51:414–430. doi: 10.1038/s41588-019-0358-2. - DOI - PMC - PubMed
    1. Sims R, Hill M, Williams J. The multiplex model of the genetics of Alzheimer’s disease. Nat. Neurosci. 2020;23:311–322. doi: 10.1038/s41593-020-0599-5. - DOI - PubMed

Publication types