. 2023 Apr 24;21(1):277.
doi: 10.1186/s12967-023-04137-z.

Anti-Alzheimers molecular mechanism of icariin: insights from gut microbiota, metabolomics, and network pharmacology

Affiliations

Anti-Alzheimers molecular mechanism of icariin: insights from gut microbiota, metabolomics, and network pharmacology

Yuqing Liu et al. J Transl Med. .

Abstract

Background: Icariin (ICA), an active ingredient extracted from Epimedium species, has shown promising results in the treatment of Alzheimer's disease (AD), although its potential therapeutic mechanism remains largely unknown. This study aimed to investigate the therapeutic effects and the underlying mechanisms of ICA on AD by an integrated analysis of gut microbiota, metabolomics, and network pharmacology (NP).

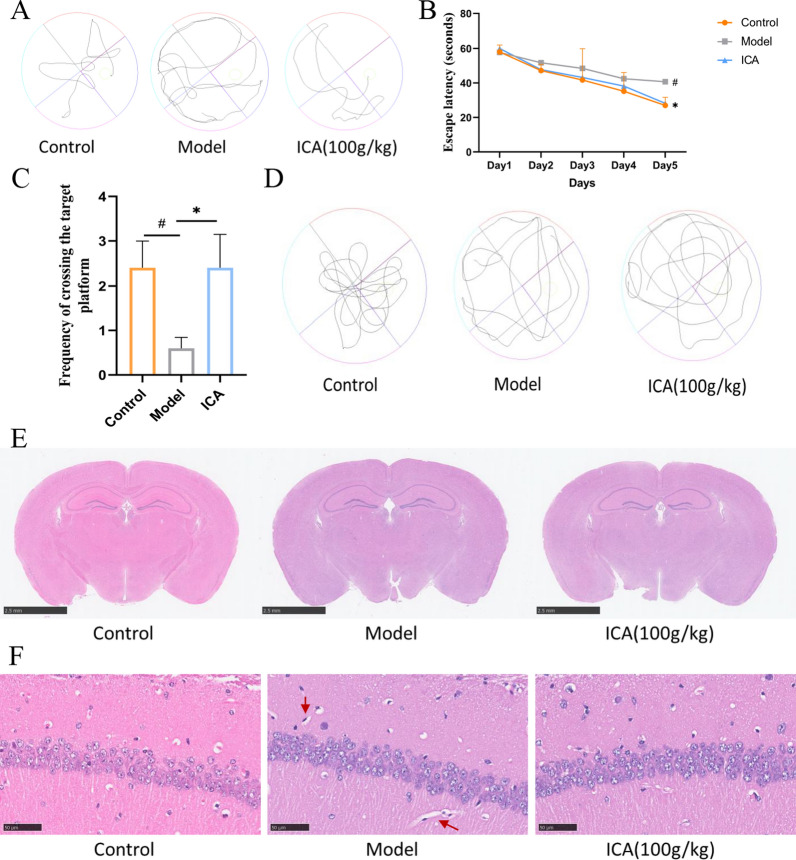
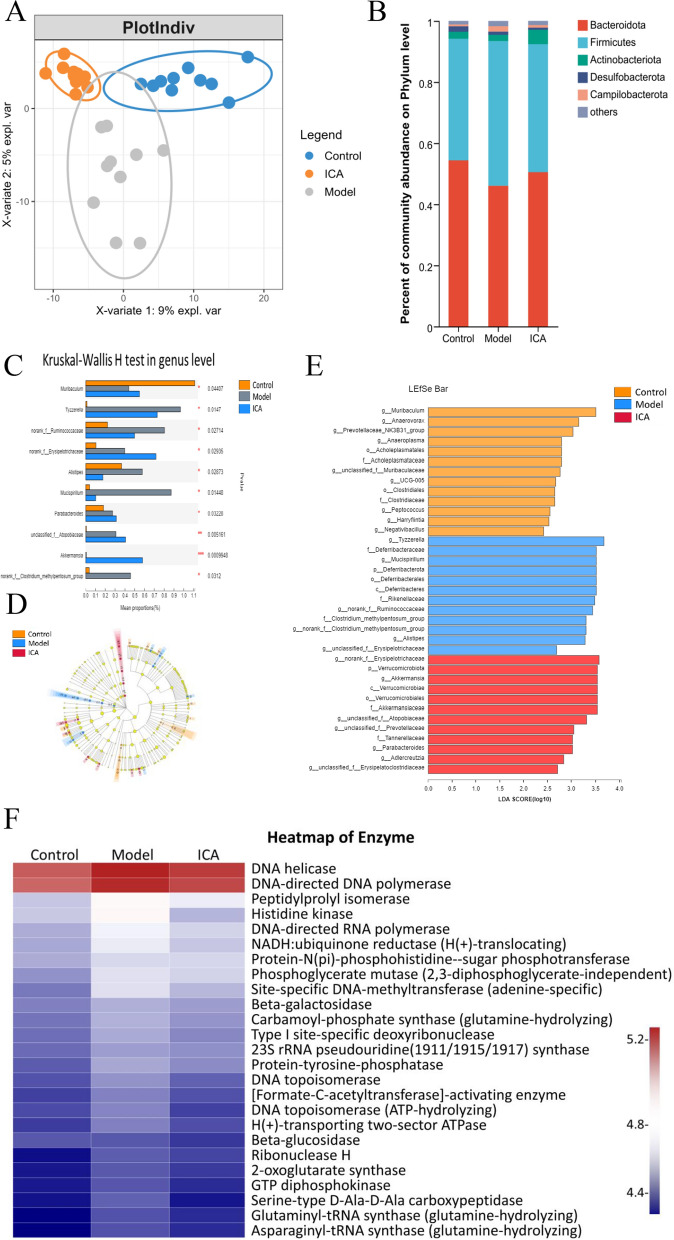
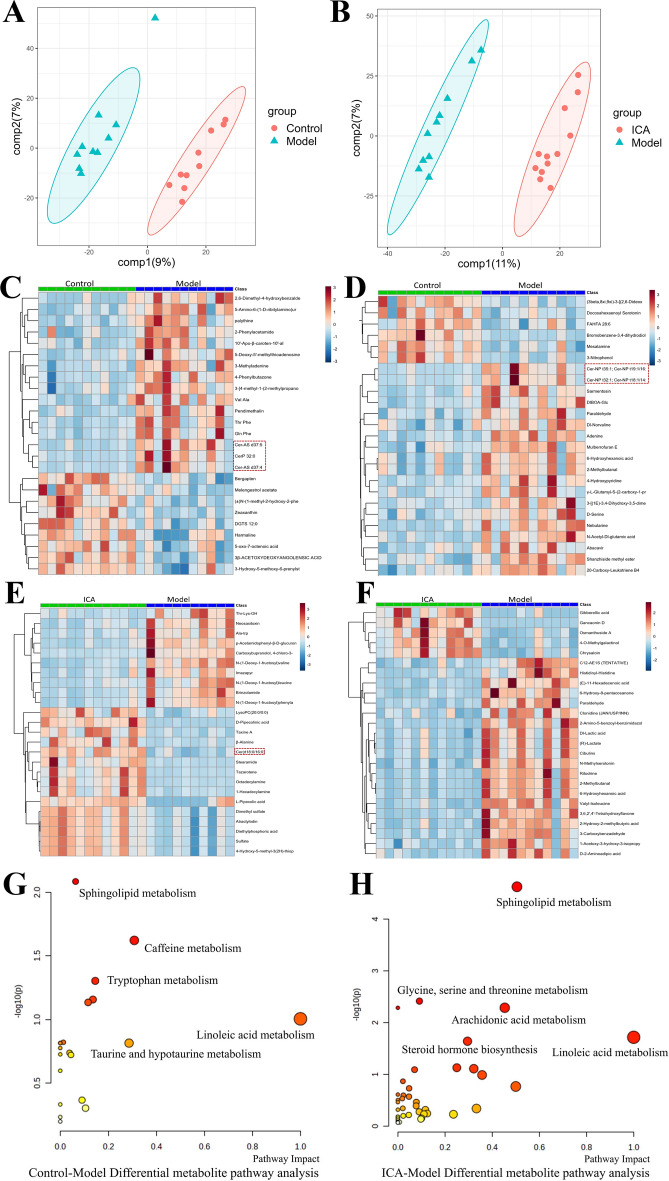
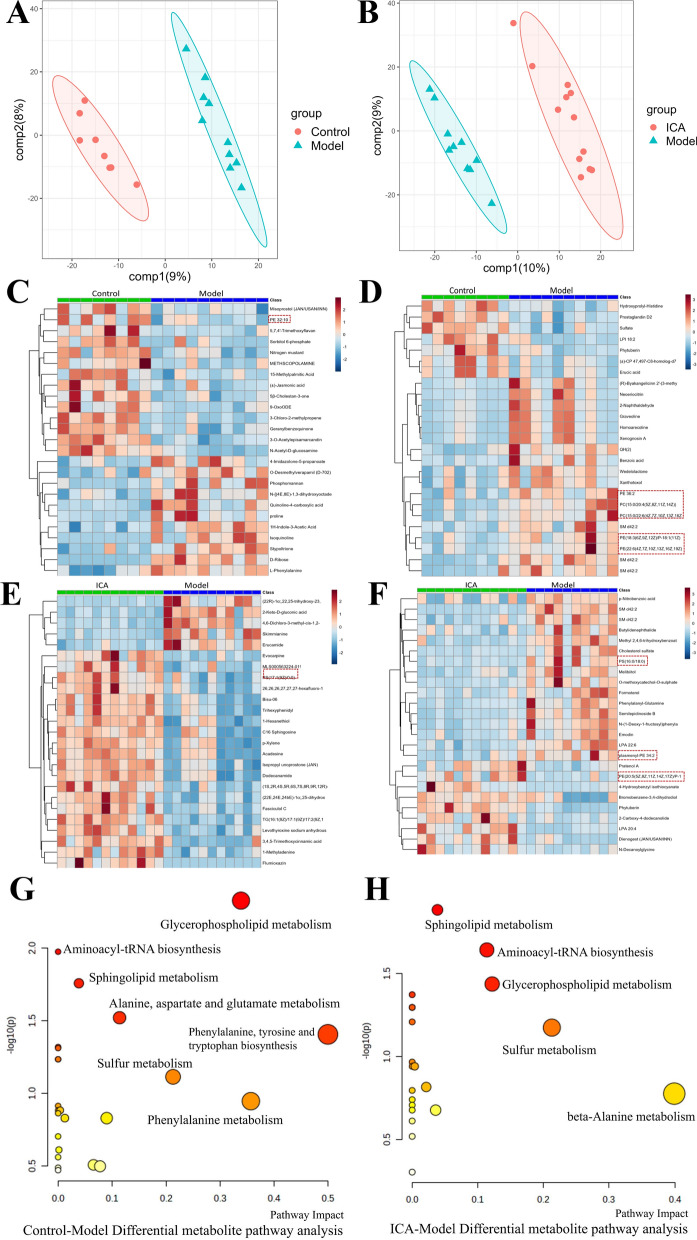
Methods: The cognitive impairment of mice was measured using the Morris Water Maze test and the pathological changes were assessed using hematoxylin and eosin staining. 16S rRNA sequencing and multi-metabolomics were performed to analyze the alterations in the gut microbiota and fecal/serum metabolism. Meanwhile, NP was used to determine the putative molecular regulation mechanism of ICA in AD treatment.

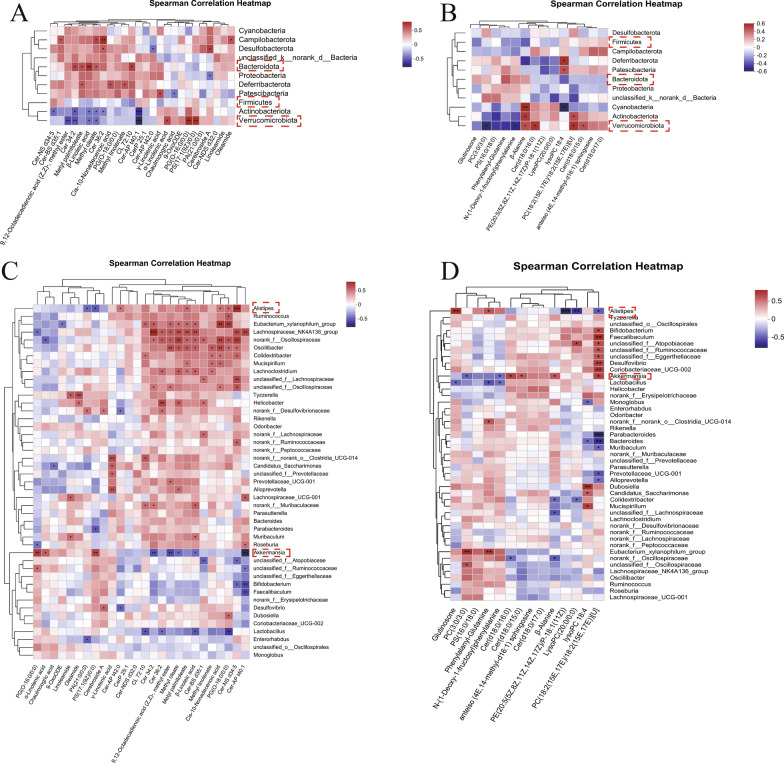
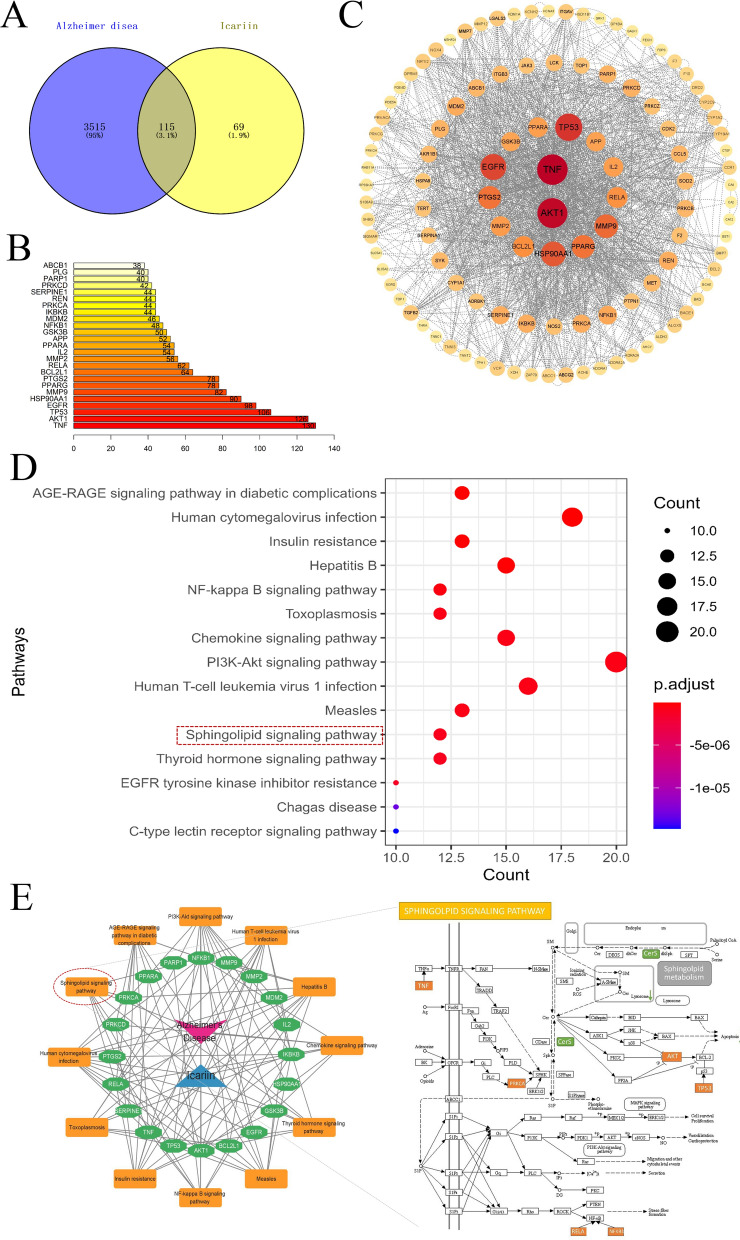
Results: Our results revealed that ICA intervention significantly improved cognitive dysfunction in APP/PS1 mice and typical AD pathologies in the hippocampus of the APP/PS1 mice. Moreover, the gut microbiota analysis showed that ICA administration reversed AD-induced gut microbiota dysbiosis in APP/PS1 mice by elevating the abundance of Akkermansia and reducing the abundance of Alistipe. Furthermore, the metabolomic analysis revealed that ICA reversed the AD-induced metabolic disorder via regulating the glycerophospholipid and sphingolipid metabolism, and correlation analysis revealed that glycerophospholipid and sphingolipid were closely related to Alistipe and Akkermansia. Moreover, NP indicated that ICA might regulate the sphingolipid signaling pathway via the PRKCA/TNF/TP53/AKT1/RELA/NFKB1 axis for the treatment of AD.

Conclusion: These findings indicated that ICA may serve as a promising therapeutic approach for AD and that the ICA-mediated protective effects were associated with the amelioration of microbiota disturbance and metabolic disorder.

Keywords: APP/PS1 mice; Akkermansia; Alistipe; Alzheimer’s disease (AD); Icariin (ICA); Network pharmacology (NP); Sphingolipid metabolism.


Conflict of interest statement

The authors declare that they have no known competing financial interests or personal relationships that could have appeared to influence the work.

Figures

Fig. 1
Fig. 1
MWM test and HE staining of the control, model, and ICA groups. A, B Representative photos of the swim pathways A and escape latency B to locate the concealed platform during days 1–5. C, D The number of platform crossings C and the representative photos of target platform crossing frequency D on day 6, after removing the platform. Data are expressed as mean ± SEM (n = 6/group). *P < 0.05 and **P < 0.01 vs. the control group and #P < 0.05 vs. the model group. E, F HE-stained brain sections from each group. The red arrows indicate distorted nerve cells. MWM test, Morris Water Maze test, ICA, icariin; HE, hematoxylin and eosin
Fig. 2
Fig. 2
Analysis of the gut microbiota of the control, model, and ICA groups. A PLS-DA analyses of the three groups. B Percent of community abundance at the phylum level. C Bar plot of the Kruskal–Wallis test score of different species at the genus level. The Y-axis indicates the species name at the taxonomic level, X-axis indicates the average relative abundance in distinct groups of species, and the columns of varying hues represent the different groups. [The rightmost is the P value, * means P > 0.01 &lt; P ≤ 0.05, ** means P > 0.001 &lt; P ≤ 0.01, *** means P ≤ 0.001.] Cladogram of the phylogenetic distribution. The diameter of each circle is proportionate to the abundance of each taxon. E Histogram of the LDA scores of differentially abundant taxa between the control and model groups. F Heatmap of the functional analysis of enzymes. ICA, icariin; PLS-DA, partial least squares discrimination analysis; LEfSe, Linear discriminant analysis (LDA) effect size
Fig. 3
Fig. 3
Fecal metabolomics of the control, model, and ICA groups. A, B PLS-DA analyses between the model A and ICA B groups. C, D Heatmaps of the differential metabolites in the control C and model D groups in the ESI + and ESI- modes. E, F Heatmaps of the differential metabolites in the ICA E and model F groups in the ESI + and ESI- modes. G, H Analysis of the pathways associated with the differential metabolites in the model G and ICA H groups. ICA, icariin; PLS-DA, partial least squares discrimination analysis; ESI, electrospray ionization
Fig. 4
Fig. 4
Serum metabolomics of the control, model, and ICA groups. A, B OPLS-DA analyses between the control A and model B groups. C, D Heatmaps of the differential metabolites between the control C and model D groups in the ESI + and ESI- modes. E, F Heatmaps of the differential metabolites between the ICA E and model F groups in the ESI + and ESI- modes. G, H Analysis of the pathways associated with the differential metabolites in the model G and ICA H groups. ICA, icariin; OPLS-DA, orthogonal partial least squares discrimination analysis; ESI, electrospray ionization
Fig. 5
Fig. 5
A, C Spearman correlation heatmaps of the gut microbiota and differential fecal metabolites, at the phylum A and genus B levels. B, D Spearman correlation heatmaps of the gut microbiota and differential serum metabolites, at the phylum C and genus D levels
Fig. 6
Fig. 6
NP analysis for ICA in AD treatment. A Venn diagram of the ICA and AD target genes. B Analysis of the ICA and AD hub genes. C PPI network for ICA in AD treatment. The nodes represent functional proteins, the edges represent the interactions between the proteins, and the size and hue of the circles indicate the significance of the proteins. D KEGG enrichment analysis of the potential AD-associated ICA targets. The size of the dots represents the number of genes engaged in the pathway and the color represents the adjusted p-value. E Network of interactions between AD, icariin, targets, and pathways, in which red represents AD, blue represents icariin, green represents putative protein targets, and yellow represents the pathway. NP, network pharmacology; ICA, icariin; AD, Alzheimer's disease; PPI, protein–protein interaction; KEGG, Kyoto Encyclopedia of Genes and Genomes

References

    1. Andronie-Cioara FL, et al. Molecular mechanisms of neuroinflammation in aging and Alzheimer's disease progression. Int J Mol Sci. 2023 doi: 10.3390/ijms24031869. - DOI - PMC - PubMed
    1. Szabó R, Rácz CP, Dulf FV. Bioavailability improvement strategies for icariin and its derivates: a review. Int J Mol Sci. 2022 doi: 10.3390/ijms23147519. - DOI - PMC - PubMed
    1. Wang N, et al. The combination of β-asarone and icariin inhibits amyloid-β and reverses cognitive deficits by promoting mitophagy in models of Alzheimer's disease. Oxid Med Cell Longev. 2021;2021:7158444. doi: 10.1155/2021/7158444. - DOI - PMC - PubMed
    1. Jin F, et al. Icariin, a phosphodiesterase-5 inhibitor, improves learning and memory in APP/PS1 transgenic mice by stimulation of NO/cGMP signalling. Int J Neuropsychopharmacol. 2014;17(6):871–881. doi: 10.1017/S1461145713001533. - DOI - PubMed
    1. Zeng KW, et al. Icariin attenuates lipopolysaccharide-induced microglial activation and resultant death of neurons by inhibiting TAK1/IKK/NF-kappaB and JNK/p38 MAPK pathways. Int Immunopharmacol. 2010;10(6):668–678. doi: 10.1016/j.intimp.2010.03.010. - DOI - PubMed

Publication types