. 2023 Apr 24;18(1):20.
doi: 10.1186/s13062-023-00378-6.

A myeloid leukemia factor homolog is involved in tolerance to stresses and stress-induced protein metabolism in Giardia lamblia

Affiliations

A myeloid leukemia factor homolog is involved in tolerance to stresses and stress-induced protein metabolism in Giardia lamblia

Jui-Hsuan Wu et al. Biol Direct. .

Abstract

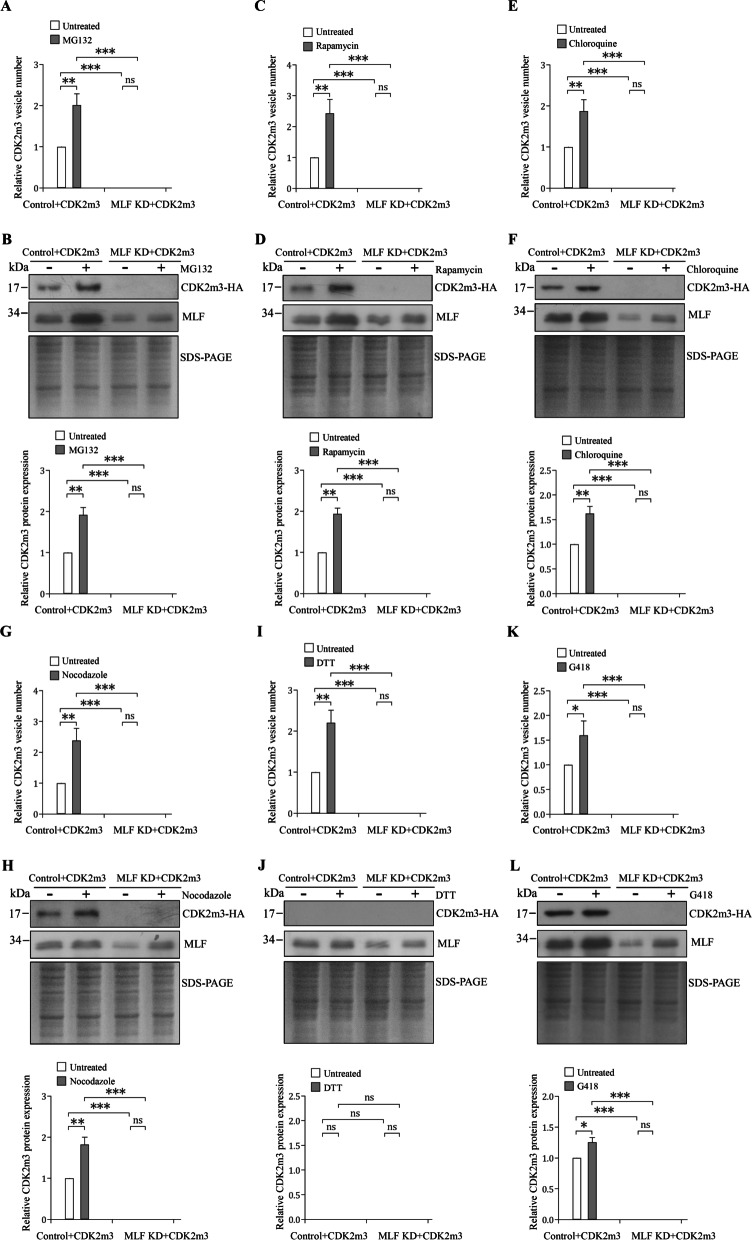
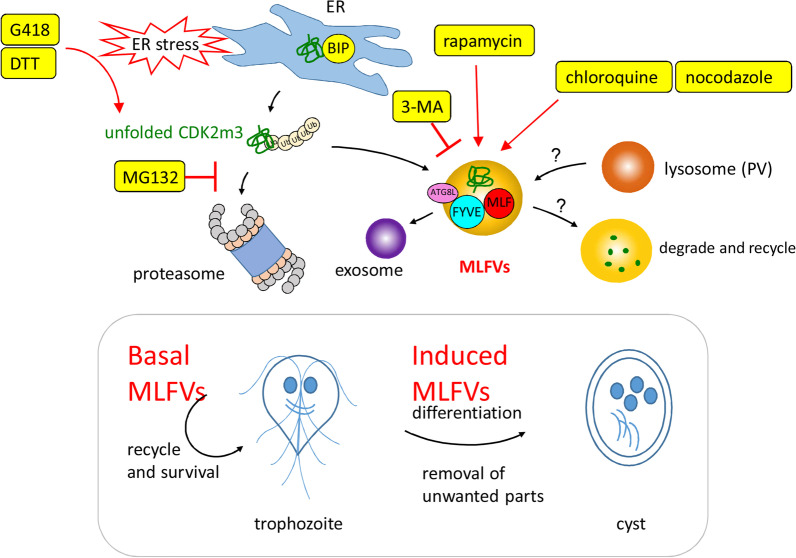
Background: The eukaryotic membrane vesicles contain specific sets of proteins that determine vesicle function and shuttle with specific destination. Giardia lamblia contains unknown cytosolic vesicles that are related to the identification of a homolog of human myeloid leukemia factor (MLF) named MLF vesicles (MLFVs). Previous studies suggest that MLF also colocalized with two autophagy machineries, FYVE and ATG8-like protein, and that MLFVs are stress-induced compartments for substrates of the proteasome or autophagy in response to rapamycin, MG132, and chloroquine treatment. A mutant protein of cyclin-dependent kinase 2, CDK2m3, was used to understand whether the aberrant proteins are targeted to degradative compratments. Interestingly, MLF was upregulated by CDK2m3 and they both colocalized within the same vesicles. Autophagy is a self-digestion process that is activated to remove damaged proteins for preventing cell death in response to various stresses. Because of the absence of some autophagy machineries, the mechanism of autophagy is unclear in G. lamblia.

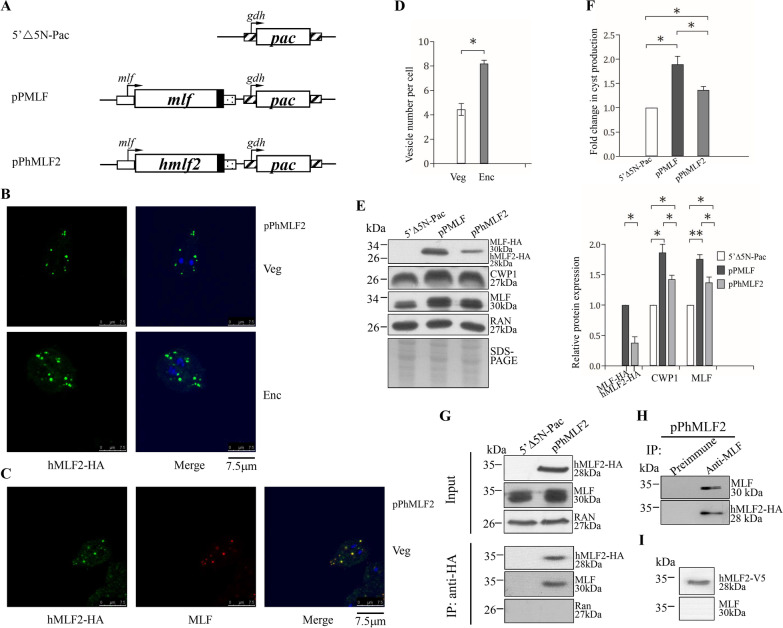
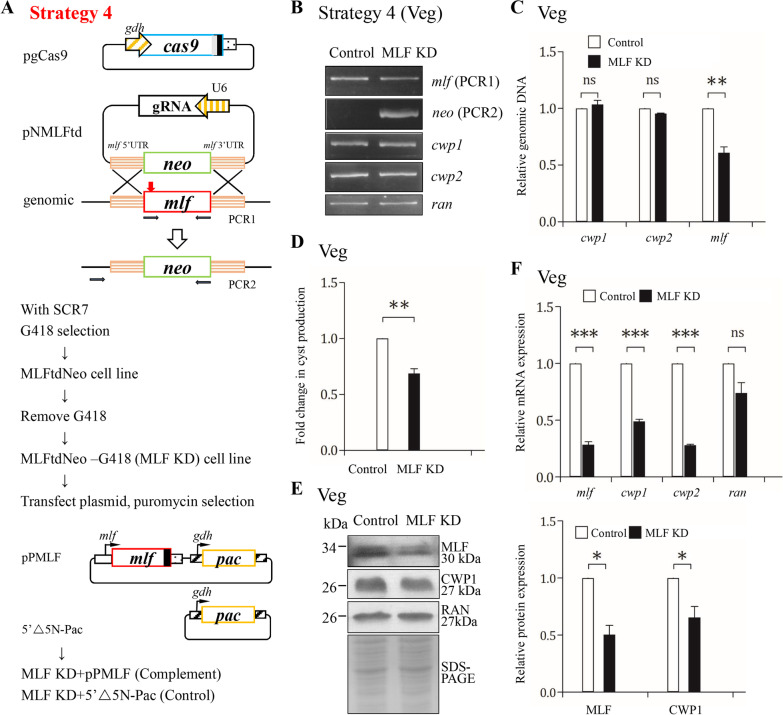
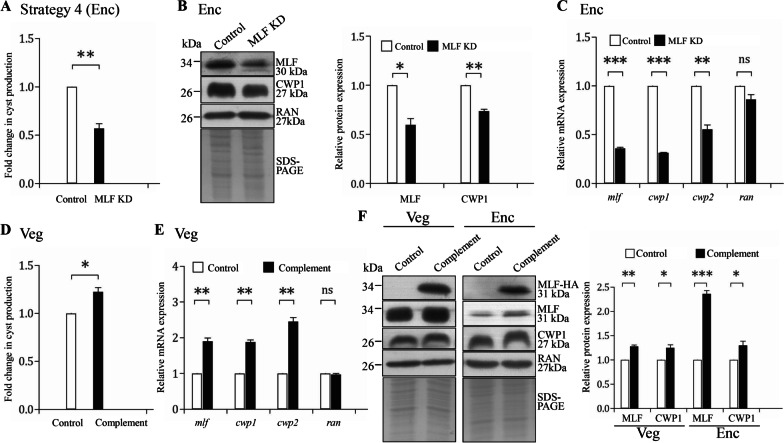
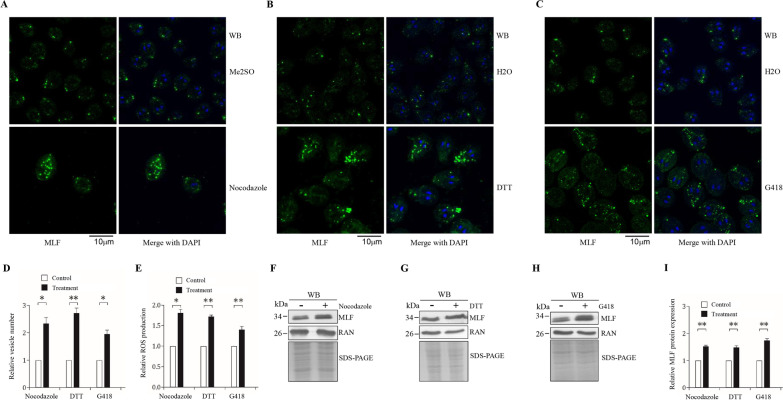
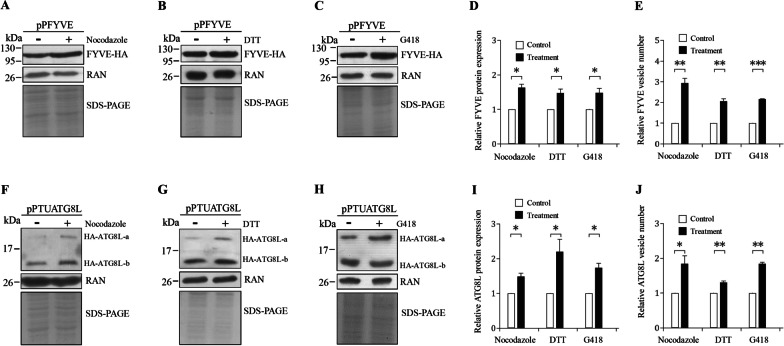
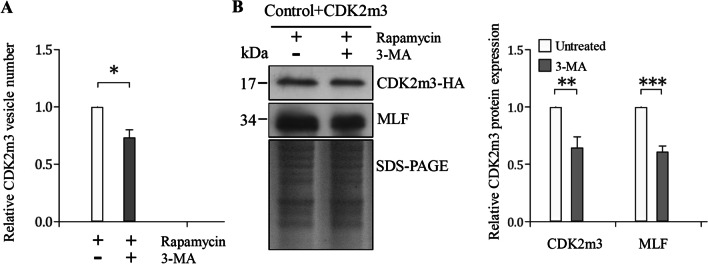
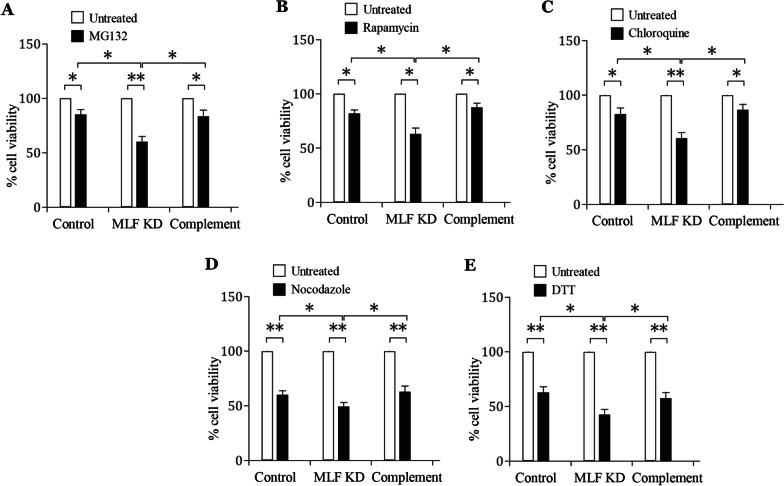
Results: In this study, we tested the six autophagosome and stress inducers in mammalian cells, including MG132, rapamycin, chloroquine, nocodazole, DTT, and G418, and found that their treatment increased reactive oxygen species production and vesicle number and level of MLF, FYVE, and ATG8-like protein in G. lamblia. Five stress inducers also increased the CDK2m3 protein levels and vesicles. Using stress inducers and knockdown system for MLF, we identified that stress induction of CDK2m3 was positively regulated by MLF. An autophagosome-reducing agent, 3-methyl adenine, can reduce MLF and CDK2m3 vesicles and proteins. In addition, knockdown of MLF with CRISPR/Cas9 system reduced cell survival upon treatment with stress inducers. Our newly developed complementation system for CRISPR/Cas9 indicated that complementation of MLF restored cell survival in response to stress inducers. Furthermore, human MLF2, like Giardia MLF, can increase cyst wall protein expression and cyst formation in G. lamblia, and it can colocalize with MLFVs and interact with MLF.

Conclusions: Our results suggest that MLF family proteins are functionally conserved in evolution. Our results also suggest an important role of MLF in survival in stress conditions and that MLFVs share similar stress-induced characteristics with autophagy compartments.

Keywords: ATG8-like; CDK2 mutant; Cyst; DTT; Differentiation; FYVE; G418; Giardia; MLF; Nocodazole.


Conflict of interest statement

The authors declare that they have no competing interests.

Figures

Fig. 1
Fig. 1
Colocalization and interaction of Giardia MLF and hMLF2. A Diagrams of the 5′5N-Pac, pPMLF and pPhMLF2 plasmids. The pac gene (open box) is under the control of the 5′- and 3′ -flanking regions of the gdh gene (striated box). In constructs pPMLF and pPhMLF2, the mlf and hmlf2 genes are under the control of the 5′ -flanking region of the mlf gene (open box) and the 3′ -flanking region of the ran gene (dotted box). The filled black box indicates the coding sequence of the HA epitope tag. B Immunofluorescence analysis of hMLF2 distribution. The pPhMLF2 stable transfectants were cultured in growth (Veg, vegetative growth, upper panels) or encystation medium for 24 h (Enc, encystation, lower panels) and then subjected to immunofluorescence analysis using anti-HA antibody for detection. C Colocalization of MLF and hMLF2. The pPhMLF2 stable transfectants were cultured in growth (Veg, vegetative growth) and then subjected to immunofluorescence assay. The endogenous Giardia MLF protein and vector expressed HA-tagged hMLF2 protein were detected by anti-MLF and anti-HA antibodies, respectively. D Quantification of hMLF2 vesicles in pPhMLF2 cell line during vegetative and encysting stages using Imaris software. *, p < 0.05 (n = 200–300 cells/condition). E Expression of hMLF2 increased the CWP1 protein level. The 5’Δ5N-Pac, pPMLF, and pPhMLF2 stable transfectants were cultured in growth medium and then subjected to SDS-PAGE and Western blot analysis. The blot was probed with anti-HA, anti-CWP1, anti-MLF, and anti-RAN antibodies, respectively. Equal amounts of protein loading were confirmed by SDS-PAGE with Coomassie Blue staining. A similar level of the RAN protein was detected. The intensity of bands from three Western blot assays was quantified using Image J. The ratio of each target protein over the loading control RAN is calculated. Fold change is calculated as the ratio of the difference between pPMLF/pPhMLF2 cell line and the control cell line, to which a value of 1 was assigned. Results are expressed as mean ± 95% confidence intervals. *, p < 0.05. **, p < 0.01. F hMLF2 expression increased cyst formation. The 5’Δ5N-Pac, pPMLF, and pPhMLF2 stable transfectants were cultured in growth medium and then subjected to cyst count. The sum of total cysts is expressed as relative expression level over control. Values are shown as means ± 95% confidence intervals. *, p < 0.05. G Interaction between Giardia MLF and hMLF2. Expression of HA-tagged hMLF2 and MLF proteins was detected in whole cell extracts for co-immunoprecipitation assays (Input, upper panel). The 5’Δ5N-Pac and pPhMLF2 stable transfectants were cultured in growth medium and then subjected to SDS-PAGE and Western blot. The blot was probed with anti-HA, anti-MLF, and anti- RAN antibodies, respectively. Interaction between hMLF2 and MLF was detected by co-immunoprecipitation assays (bottom panel). The 5’Δ5N-Pac and pPhMLF2 stable transfectants were cultured in growth medium. Proteins from cell lysates were immunoprecipitated using anti-HA antibody conjugated to beads. The precipitates were analyzed by Western blotting with anti-HA, anti-MLF, and anti-RAN antibodies, respectively, as indicated. H Confirmation of interaction between hMLF2 and MLF. The pPhMLF2 stable transfectants were cultured in growth medium. Proteins from cell lysates were immunoprecipitated using anti-MLF antibody to assess binding of MLF to hMLF2. Preimmune serum was used as a negative control. The precipitates were analyzed by Western blotting with anti-MLF, and anti-HA antibodies, respectively, as indicated. I hMLF2 protein was not recognize by anti-MLF antibody. Purified V5-tagged hMLF2 protein was analyzed by Western blotting with anti-V5 and anti-MLF, respectively, as indicated
Fig. 2
Fig. 2
A MLF mutant with mutation residues 128–145 (enriched in basic amino acids, MLFm) showed decreased levels of the CWP1 protein and cwp1-3 and myb2 gene expression. A Diagrams of the MLF and MLFm proteins. The gray box indicates the Myelodysplasia-myeloid leukemia factor 1-interacting protein (MLF1IP) domain identified in pfam. MLFm contains mutations (underlined) of two stretches of sequences containing basic amino acids (bold) located in residues 128–145. The mlf gene was mutated and subcloned to replace the wild type mlf gene in the backbone of pPMLF (Fig. 1A), and the resulting plasmid pPMLFm was transfected into G. lamblia. B MLFm expression decreased the CWP1 level. The pPMLF and pPMLFm stable transfectants cultured in growth medium were subjected to Western blot analysis using anti-HA, anti-CWP1, and anti-Ran antibodies, respectively. The band intensity from triplicate Western blots was quantified using Image J as described in Fig. 1E. *, p < 0.05. **, p < 0.01. C Quantitative real-time PCR assays of transcript levels in the MLF and MLFm- expressing cell lines during vegetative growth. Real-time RT-PCR analysis was performed using primers specific for mlf, cwp1, cwp2, cwp3, myb2, and 18S ribosomal RNA genes, respectively. Similar levels of the 18S ribosomal RNA were detected. The mRNA levels were normalized to the 18S ribosomal RNA levels. The ratio of mRNA levels in the pPMLFm cell line to levels in the pPMLF cell line is shown and expressed as the mean ± 95% confidence intervals of at least three separate experiments. *, p < 0.05. **, p < 0.01
Fig. 3
Fig. 3
Targeted disruption of the mlf gene resulted in decreased expression of the cwp1 and cwp2 genes during vegetative growth using strategy 4. A Schematic presentation of the pgCas9 and pNMLFtd plasmids. In construct pgCas9, the cas9 gene is flanked by gdh promoter (striated box) and 3′ untranslated region of the ran gene (dotted box). The nuclear localization signal (filled gray box) and an HA tag (filled black box) are fused to the C terminus. In construct pNMLFtd, a single gRNA is under the control of the Giardia U6 promoter. pNMLFtd also has the HR template cassette composed of the neo selectable marker and the 5′ and 3′ flanking region of the mlf gene as homologous arms. The Cas9/gRNA cutting site in the genomic mlf gene is indicated by a red arrow. Replacement of the genomic mlf gene with the neo gene will occur by HR, after introducing a double-stranded DNA break in the mlf gene. The pgCas9 and pNMLFtd constructs were transfected into trophozoites. The MLFtdNeo stable transfectants were established under G418 selection. G418 was removed from the MLFtdNeo cell line to obtain the MLFtdNeo –G418 (MLF KD) cell line. The control cell line is wild-type nontransfected WB trophozoites. To complement the targeted disruption of the mlf gene, a pPMLF expression vector was transfected to the MLF KD cell line. pPMLF is also described in Fig. 1A. The MLF KD + MLF (Complement) cell line was established under puromycin selection to maintain the MLF expression cassette. The control cell line is MLF KD cell line transfected with 5’∆5N-Pac plasmid and selected with puromycin. B PCR confirmed partial replacement of the mlf gene with the neo gene in the MLF KD cell line. Genomic DNA was isolated from MLF KD and control cell lines cultured in growth medium (vegetative growth, Veg). PCR was performed using primers specific for mlf (PCR1 in panel A), neo (PCR2 in panel A), cwp1, cwp2, and ran genes, respectively. Products from the cwp1, cwp2, and ran genes are internal controls. C Real-time PCR confirmed partial disruption of the mlf gene in the MLF KD cell line. Real-time PCR was performed using primers specific for mlf, cwp1, cwp2, and ran genes, respectively. The mlf, cwp1, and cwp2 DNA levels were normalized to the ran DNA level. The ratio of DNA levels in MLF KD cell line to levels in control cell line is shown and expressed as the means ± 95% confidence intervals of at least three separate experiments. **, p < 0.01. ns, p > 0.05, not significant. D Targeted disruption of the mlf gene in the MLF KD cell line resulted in decreased cyst generation during vegetative growth. Cyst number was counted from the control and MLF KD cell lines cultured in growth medium. Fold changes in cyst generation are shown as the ratio of the sum of total cysts in the MLF KD cell line relative to the control cell line. Values are shown as mean ± 95% confidence intervals. **, p < 0.01. E The CWP1 protein level decreased by targeted disruption of the mlf gene in the MLF KD cell line during vegetative growth. The control and MLF KD cell lines cultured in growth medium were subjected to SDS-PAGE and Western blot analysis using anti-MLF, anti-CWP1, and anti-RAN antibodies, respectively. SDS-PAGE with Coomassie Blue staining is included as a control for equal protein loading. The band intensity from triplicate Western blots was quantified using Image J as described in Fig. 1E. *, p < 0.05. F Targeted disruption of the mlf gene in the MLF KD cell line resulted in decreased expression of cwp1 and cwp2 during vegetative growth. The control and MLF KD cell lines cultured in growth medium were subjected to quantitative real-time RT-PCR analysis using primers specific for mlf, cwp1, cwp2, ran, and 18S ribosomal RNA genes, respectively, as described in Fig. 2C. ***, p < 0.001. ns, p > 0.05, not significant
Fig. 4
Fig. 4
Targeted disruption and complementation of the mlf gene using strategy 4. A Targeted disruption of the mlf gene in the MLF KD cell line resulted in decreased cyst generation during encystation. Cyst number was counted from the control and MLF KD cell lines cultured in encystation medium for 24 h (Enc). **, p < 0.01. B The CWP1 protein level decreased by targeted disruption of the mlf gene in the MLF KD cell line during encystation. The control and MLF KD cell lines cultured in encystation medium for 24 h (Enc) were subjected to SDS-PAGE and Western blot analysis. The blot was probed with anti-MLF, anti-CWP1, and anti-RAN antibodies, respectively. SDS-PAGE with Coomassie Blue staining is included as a control for equal protein loading. The band intensity from triplicate Western blots was quantified using Image J as described in Fig. 1E. *, p < 0.05. **, p < 0.01. C Targeted disruption of the mlf gene in the MLF KD cell line resulted in decreased expression of cwp1 and cwp2 during encystation. The control and MLF KD cell lines cultured in encystation medium for 24 h (Enc) were subjected to quantitative real-time RT-PCR analysis using primers specific for mlf, cwp1, cwp2, ran, and 18S ribosomal RNA genes, respectively, as described in Fig. 2C. **, p < 0.01. ***, p < 0.001. ns, p > 0.05, not significant. D Complementation of the disrupted mlf gene by transfection of mlf expression plasmid increased cyst formation during vegetation growth. Cyst number was counted from the control and complement cell lines cultured in growth medium. *, p < 0.05. E Complementation of the disrupted mlf gene by transfection of mlf expression plasmid increased cwp1 and cwp2 gene expression during vegetation growth. The control and Complement cell lines cultured in growth medium were subjected to quantitative real-time RT-PCR analysis using primers specific for mlf, cwp1, cwp2, ran, and 18S ribosomal RNA genes, respectively, as described in Fig. 2C. **, p < 0.01. ns, p > 0.05, not significant. F Complementation of the disrupted mlf gene by transfection of mlf expression plasmid increased the CWP1 protein level during vegetative growth and encystation. The control and Complement cell lines were cultured in growth (Veg) or encystation medium for 24 h (Enc) and then subjected to SDS-PAGE and Western blot analysis. The blot was probed with anti-HA, anti-MLF, anti-CWP1, and anti-RAN antibodies, respectively. SDS-PAGE with Coomassie Blue staining is included as a control for equal protein loading. The band intensity from triplicate Western blots was quantified using Image J as described in Fig. 1E. *, p < 0.05. **, p < 0.01. ***, p < 0.001
Fig. 5
Fig. 5
Increased numbers of MLF vesicles and levels of MLF protein and ROS production by nocodazole, DTT, and G418 treatment. A, B, C MLFVs can be induced by nocodazole, DTT, and G418 treatment. The wild-type non-transfected WB cells were cultured in growth medium with (A) 5 μM nocodazole, (B) 5 mM DTT, and (C) 217 μM G418, or the same volume of solvent (H2O or Me2SO) for 24 h and then subjected to immunofluorescence assay using anti-MLF antibody for detection. D Quantification of MLFVs in nocodazole, DTT, and G418 treated cells during vegetative stage was performed using Imaris software. *, p < 0.05. **, p < 0.01 (n = 200–300 cells/condition). E Nocodazole, DTT, and G418 treatment increased ROS production. The wild-type non-transfected WB cells were cultured in growth medium with 5 μM nocodazole, 5 mM DTT, and 217 μM G418, or the same volume of solvent (H2O or Me2SO) for 24 h and then subjected to ROS measurement. Fold change is calculated as the ratio of the difference between the treatment group and control group, to which a value of 1 was assigned. F, G, H Nocodazole, DTT, and G418 treatment increased the levels of MLF protein. The wild-type non-transfected WB were cultured in growth medium containing (F) 5 μM nocodazole, (G) 5 mM DTT, and (H) 217 μM G418, or the same volume of solvent (H2O or Me2SO) for 24 h and then subjected to SDS-PAGE and Western blot analysis. The blot was probed with anti-MLF and anti-RAN antibodies, respectively. SDS-PAGE with Coomassie Blue staining is included as a control for equal protein loading. I The band intensity from triplicate Western blots was quantified using Image J as described in Fig. 1E. **, p < 0.01
Fig. 6
Fig. 6
Increased levels of FYVE and ATG8L proteins and numbers of their vesicles by nocodazole, DTT, and G418 treatment. A, B, C Nocodazole, DTT, and G418 treatment increased the level of FYVE protein. The pPFYVE stable transfectants were cultured in growth medium containing (A) 5 μM nocodazole, (B) 5 mM DTT, and (C) 217 μM G418, or the same volume of solvent (H2O or Me2SO) for 24 h and then subjected to SDS-PAGE and Western blot analysis. The blot was probed with anti-HA and anti-RAN antibodies, respectively. SDS-PAGE with Coomassie Blue staining is included as a control for equal protein loading. D The band intensity from triplicate Western blots of FYVE experiments was quantified using Image J as described in Fig. 1E. *, p < 0.05. E FYVE-localized vesicles can be induced by nocodazole, DTT, and G418 treatment. The pPFYVE stable transfectants were cultured in growth medium with 5 μM nocodazole, 5 mM DTT, and 217 μM G418, or the same volume of solvent (H2O or Me2SO) for 24 h and then subjected to immunofluorescence assay using anti-HA antibody for detection. Quantification of FYVE-localized vesicles in nocodazole, DTT, and G418 treated cells during vegetative stage was performed using Imaris software. **, p < 0.01 (n = 200–300 cells/condition). F, G, H Nocodazole, DTT, and G418 treatment increased the level of ATG8L protein. The pPTUATG8L stable transfectants were treated with (F) nocodazole, (G) DTT, and (H) G418 and then subjected to SDS-PAGE and Western blot analysis. The blot was probed with anti-HA and anti-RAN antibodies, respectively. SDS-PAGE with Coomassie Blue staining is included as a control for equal protein loading. I The band intensity from triplicate Western blots of ATG8L experiments was quantified using Image J as described in Fig. 1E. *, p < 0.05. J ATG8L-localized vesicles can be induced by nocodazole, DTT, and G418 treatment. The pPTUATG8L stable transfectants were treated with nocodazole, DTT, and G418 and then subjected to immunofluorescence assay using anti-HA antibody for detection. Quantification of ATG8L-localized vesicles in nocodazole, DTT, and G418 treated cells during vegetative stage was performed using Imaris software. *, p < 0.05. **, p < 0.01 (n = 200–300 cells/condition)
Fig. 7
Fig. 7
The levels of CDK2m3 mutant protein and vesicles decreased in the MLF knockdown trophozoites. A, C, E, G, I, K Quantification of Cdk2m3 vesicles in the MLF knockdown trophozoites. A pPCdk2m3 expression vector was transfected to the MLF KD and control cell lines (trophozoites stably transfected with pRANneo vector with further removal of G418). The stable transfectants were cultured in growth medium containing (A) 80 μM MG132, (C) 36 μM rapamycin, (E) 100 μM chloroquine, (G) 5 μM nocodazole, (I) 5 mM DTT, and (K) 217 μM G418 for 24 h and then subjected to immunofluorescence analysis using anti-HA antibody for detection. Quantification of CDK2m3-localized vesicles in the treated cells during vegetative stage was performed using Imaris software. **, p < 0.01. ***, p < 0.001 (n = 200–300 cells/condition). ns, p > 0.05, not significant. B, D, F, H, J, L The level of Cdk2m3 protein decreased in the MLF knockdown trophozoites. The MLF KD and control cell lines were used to transfect pPCdk2m3. The stable transfectants were subcultured in growth medium containing (B) 80 μM MG132, (D) 36 μM rapamycin, (F) 100 μM chloroquine, (H) 5 μM nocodazole, (J) 5 mM DTT, and (L) 217 μM G418 for 24 h and then subjected to SDS-PAGE and Western blot analysis. The blot was probed with anti-HA and anti-MLF antibodies, respectively. SDS-PAGE with Coomassie Blue staining is included as a control for equal protein loading. The band intensity from triplicate Western blots was quantified using Image J. The CDK2m3 protein levels were normalized to the loading control (Coomassie Blue-stained proteins). The ratio of CDK2m3 protein levels in drug-treated sample to levels in untreated sample is shown and expressed as mean ± 95% confidence intervals. *, p < 0.05. **, p < 0.01. ***, p < 0.001. ns, p > 0.05, not significant
Fig. 8
Fig. 8
The levels of CDK2m3 mutant protein and vesicles decreased in response to 3-MA treatment. A Quantification of Cdk2m3 vesicles in the 3-MA treatment. The pPCdk2m3 stable transfectants were treated with 36 μM rapamycin in the absence or presence of 5.6 mM 3-MA for 24 h and then subjected to immunofluorescence analysis using anti-HA antibody for detection. Quantitation of vesicles was performed using Imaris software. *, p < 0.05. (n = 200–300 cells/condition). B The level of Cdk2m3 protein decreased in response to 3-MA treatment. The pPCdk2m3 stable transfectants were treated with 36 μM rapamycin in the absence or presence of 5.6 mM 3-MA for 24 h and then subjected to SDS-PAGE and Western blot analysis. The blot was probed with anti-HA, anti-MLF, and anti-RAN antibodies, respectively. SDS-PAGE with Coomassie Blue staining is included as a control for equal protein loading. The band intensity from triplicate Western blots was quantified using Image J. The CDK2m3 and MLF protein levels were normalized to the loading control (Coomassie Blue-stained proteins). The ratio of CDK2m3/MLF protein levels in 3-MA-treated sample to levels in untreated sample is shown and expressed as mean ± 95% confidence intervals. **, p < 0.01. ***, p < 0.001
Fig. 9
Fig. 9
Complementation of the disrupted mlf gene by transfection of MLF expression plasmid recovered cell growth after stress. A, B, C, D, E To complement the disrupted mlf gene, a pPMLF expression vector was transfected to the MLF KD and control cell lines. The complement and control cell lines were subcultured in growth medium containing (A) 80 μM MG132, (B) 36 μM rapamycin, (C) 100 μM chloroquine, (D) 5 μM nocodazole, and (E) 5 mM DTT for 24 h and then subjected to cell count. An equal volume of solvent (H2O or Me2SO) was added to cultures as an untreated control. Fold changes in cell number are shown as the ratio of cell number in the treatment relative to the control group. Values are shown as mean ± 95% confidence intervals of three independent experiments. *, p < 0.05. **, p < 0.01
Fig. 10
Fig. 10
MLFV compartments are induced by six autophagosome-inducing agents, but decreased by 3-MA, an autophagosome-reducing agent. MLF interacts with FVYE and ATG8L in their compartments. MLFVs are maintained at a basal level in vegetative trophozoites but increases during encystation. During encystation, unwanted trophozoite specific proteins are accumulated. Accumulation of toxic undegraded proteins may induce protein clearance pathway to promote cell survival during encystation. Therefore, MLF, FVYE, and ATG8L, are induced for cooperation in protein clearance during encystation. BIP, as a chaperone, binds to unfolded proteins and helps refold the proteins to a soluble form. Unfolded proteins can also be degraded by ubiquitin–proteasome systems. In the presence of stress inducers, excess of misfolded proteins may overwhelm the capacity of chaperone and proteasome systems and lead to toxicity to cells. The aberrant protein, CDK2m3, may be degraded by specific clearance pathway through entering MLFV compartments. The compartments may fuse with lysosomes (peripheral vesicles, PV) to recycle materials and control energy balance. Treatment with chloroquine or nocodazole, an inhibitor of fusion of the compartments and lysosome, may impair the process and lead to accumulation of aberrant proteins, such as CDK2m3. Treatment with MG132, a proteasome inhibitor, may impair protein quality control, leading to unfolded protein response (UPR). Treatment with rapamycin, an autophagy inducer, may activate UPR. Treatment with DTT, an ER stress inducer, may activate UPR. Treatment with G418, an aminoglycoside antibiotic that interferes folding of proteins, may generate UPR. UPR causes accumulation of aberrant proteins, such as CDK2m3. All the six agents that promote autophagosome accumulation in higher eukaryotes, can induce MLF protein and vesicles in G. lamblia. Five can induce CDK2m3 protein and vesicles. 3-MA, an autophagosome-reducing agent in higher eukaryotes, can reduce CDK2m3 and MLF proteins and vesicles in G. lamblia. Our findings suggest that MLFVs involve in the clearance of CDK2m3 during stresses and share similar characteristics with autophagosomes

Similar articles

Cited by

References

    1. Adam RD. Biology of Giardia lamblia. Clin Microbiol Rev. 2001;14:447–475. doi: 10.1128/CMR.14.3.447-475.2001. - DOI - PMC - PubMed
    1. Einarsson E, Ma'ayeh S, Svard SG. An up-date on Giardia and giardiasis. Curr Opin Microbiol. 2016;34:47–52. doi: 10.1016/j.mib.2016.07.019. - DOI - PubMed
    1. Hanevik K, Dizdar V, Langeland N, Hausken T. Development of functional gastrointestinal disorders after Giardia lamblia infection. BMC Gastroenterol. 2009;9:27. doi: 10.1186/1471-230X-9-27. - DOI - PMC - PubMed
    1. Adam RD. The biology of Giardia spp. Microbiol Rev. 1991;55(4):706–732. doi: 10.1128/mr.55.4.706-732.1991. - DOI - PMC - PubMed
    1. Hanevik K, Wensaas KA, Rortveit G, Eide GE, Morch K, Langeland N. Irritable bowel syndrome and chronic fatigue 6 years after giardia infection: a controlled prospective cohort study. Clin Infect Dis. 2014;59:1394–1400. doi: 10.1093/cid/ciu629. - DOI - PMC - PubMed

Publication types

Substances

LinkOut - more resources