

Imaging biomarkers of cerebral edema automatically extracted from routine CT scans of large vessel occlusion strokes
- PMID: 37095592
- PMCID: PMC10524672
- DOI: 10.1111/jon.13109
Imaging biomarkers of cerebral edema automatically extracted from routine CT scans of large vessel occlusion strokes
Abstract
Background and purpose: Volumetric and densitometric biomarkers have been proposed to better quantify cerebral edema after stroke, but their relative performance has not been rigorously evaluated.
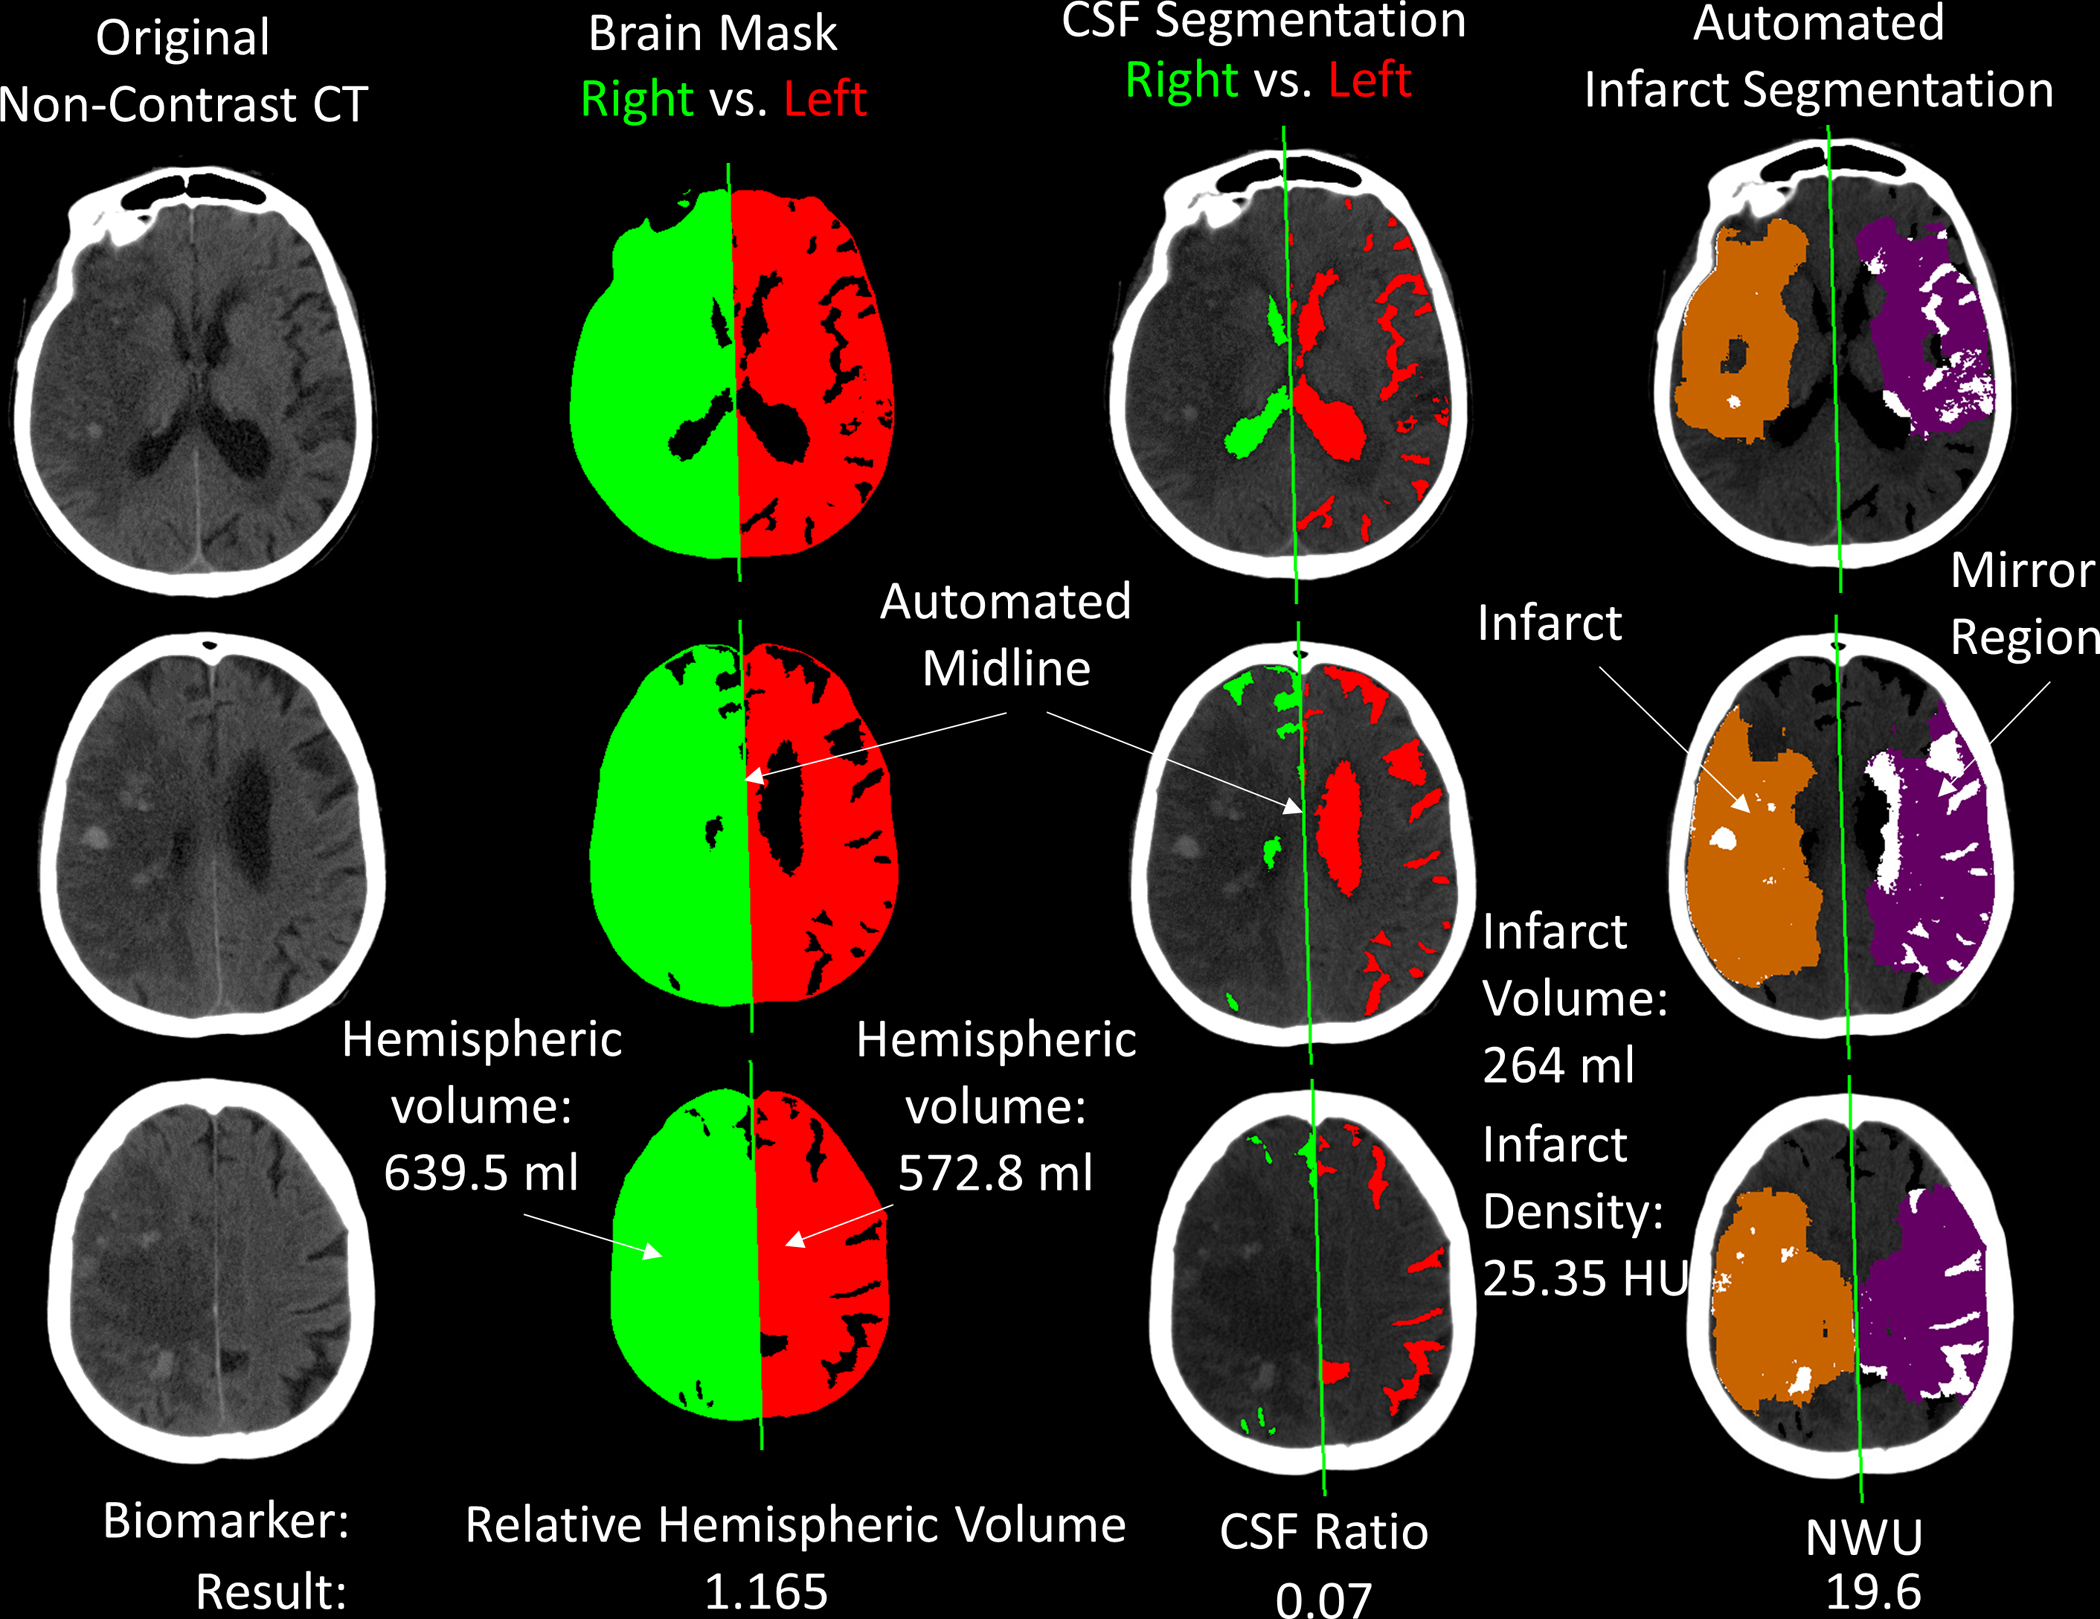
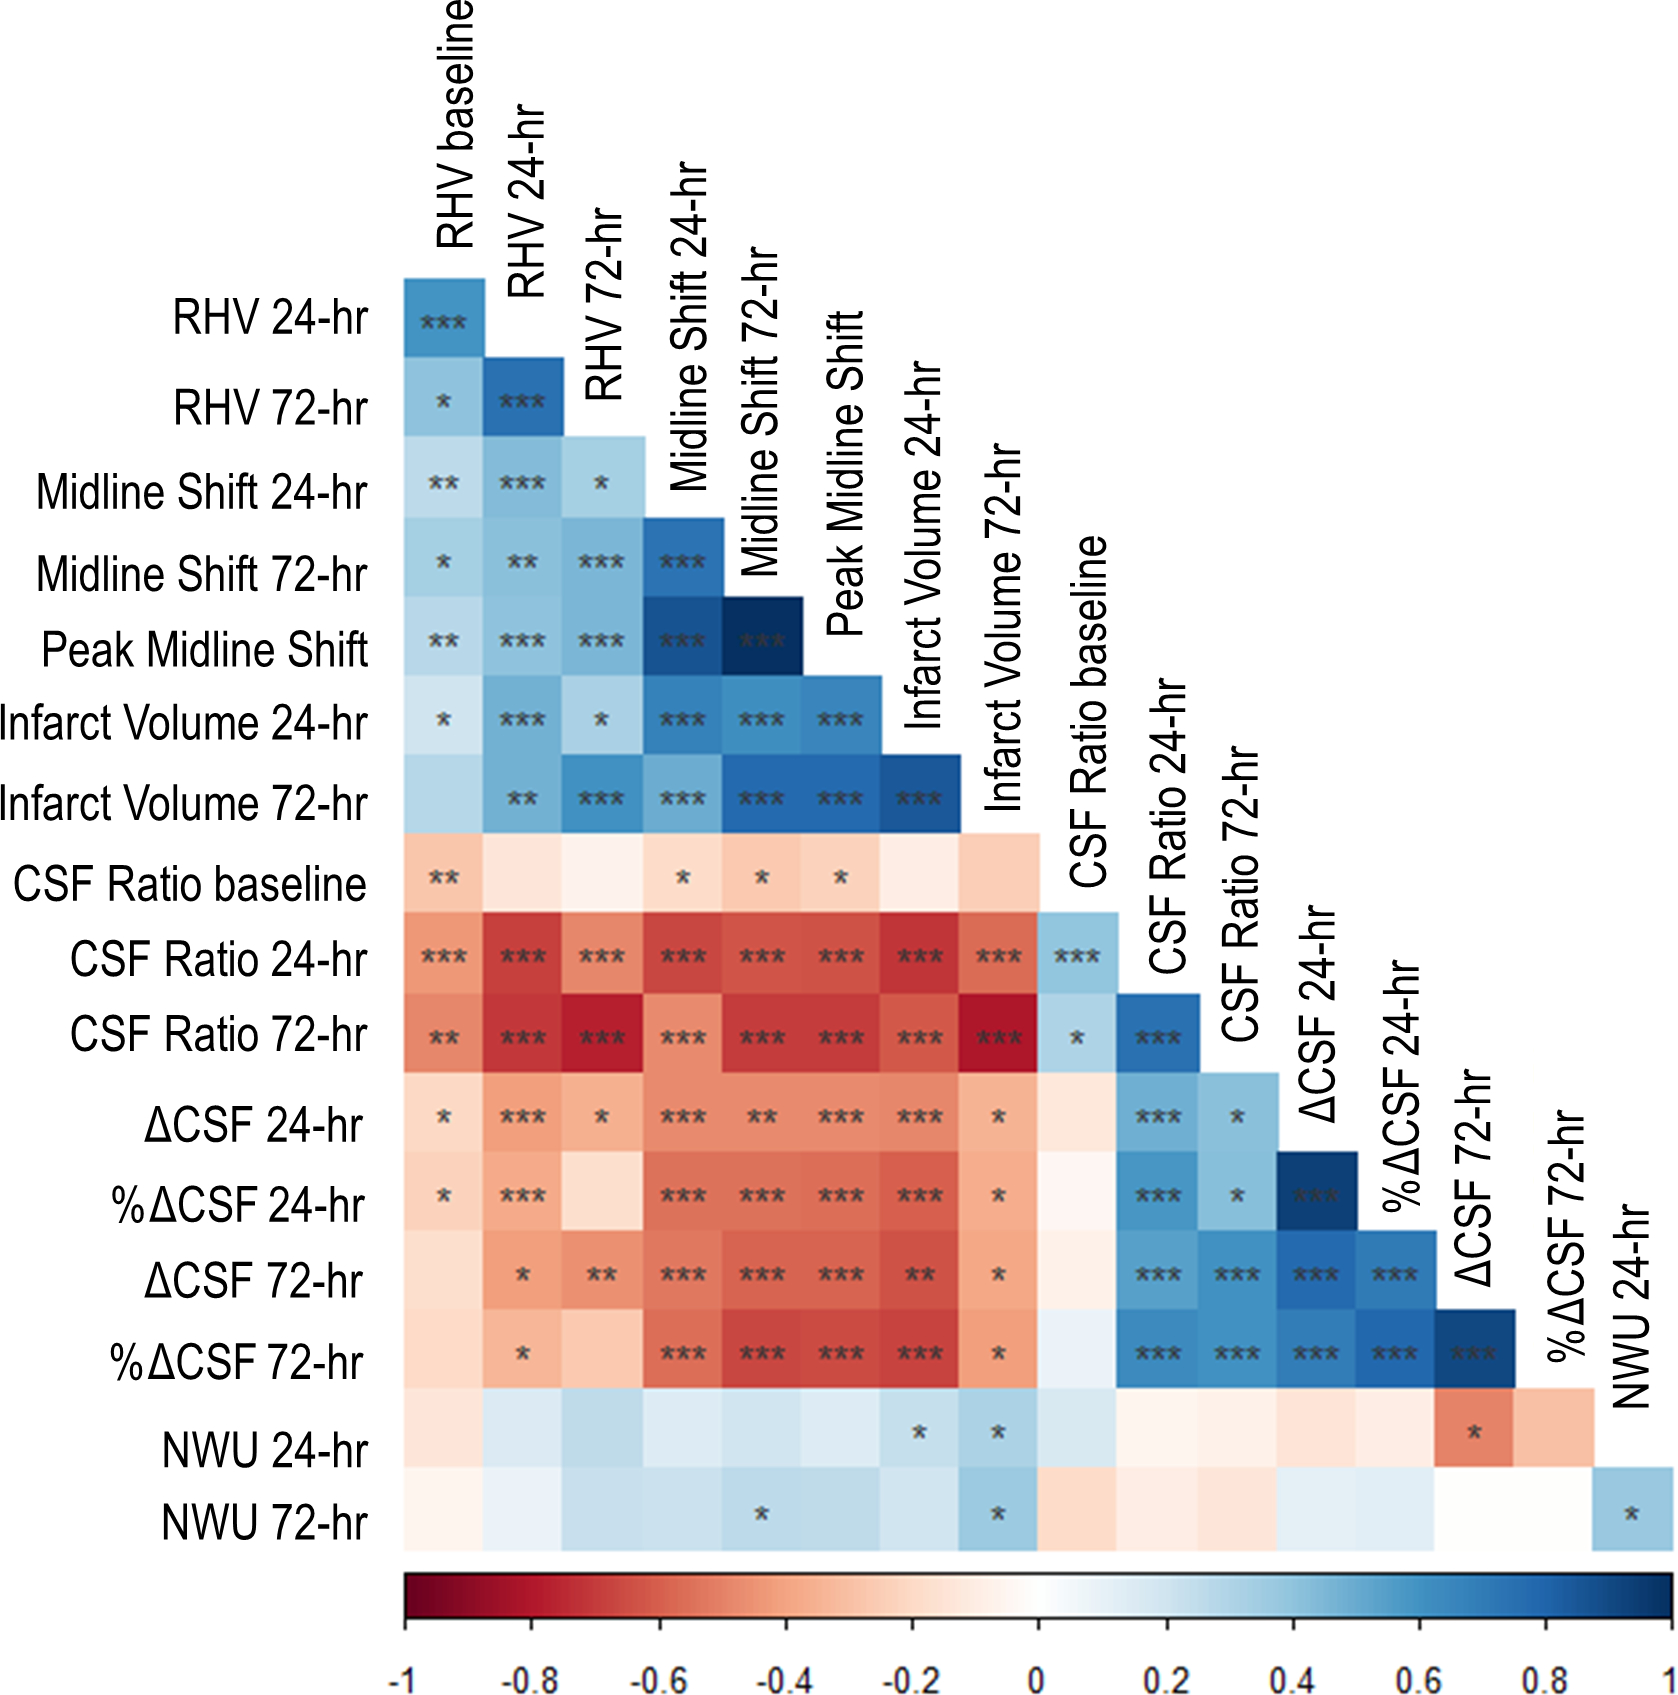
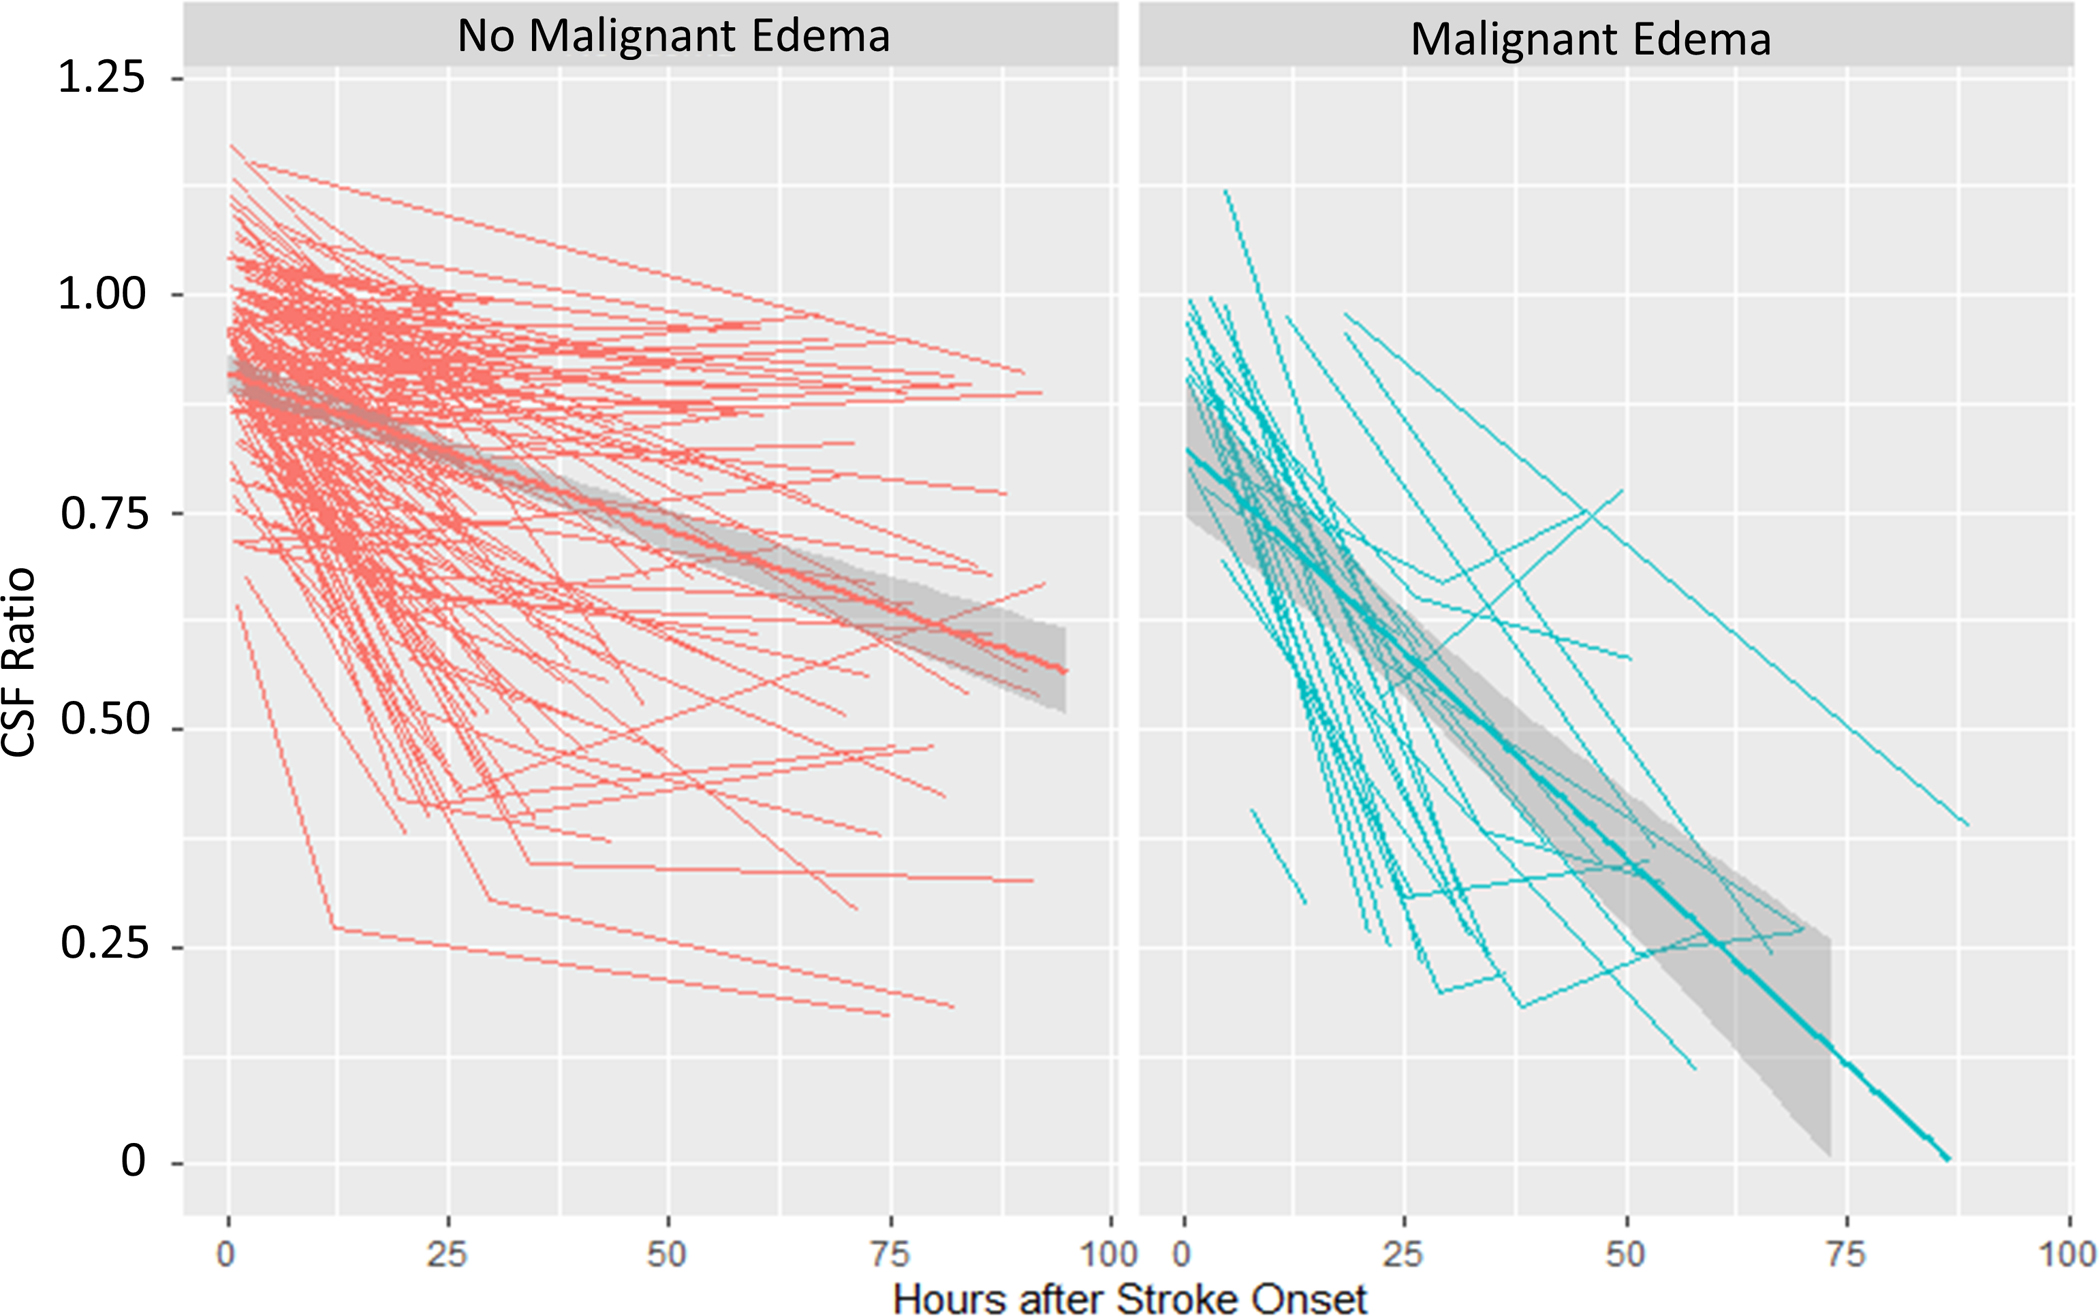
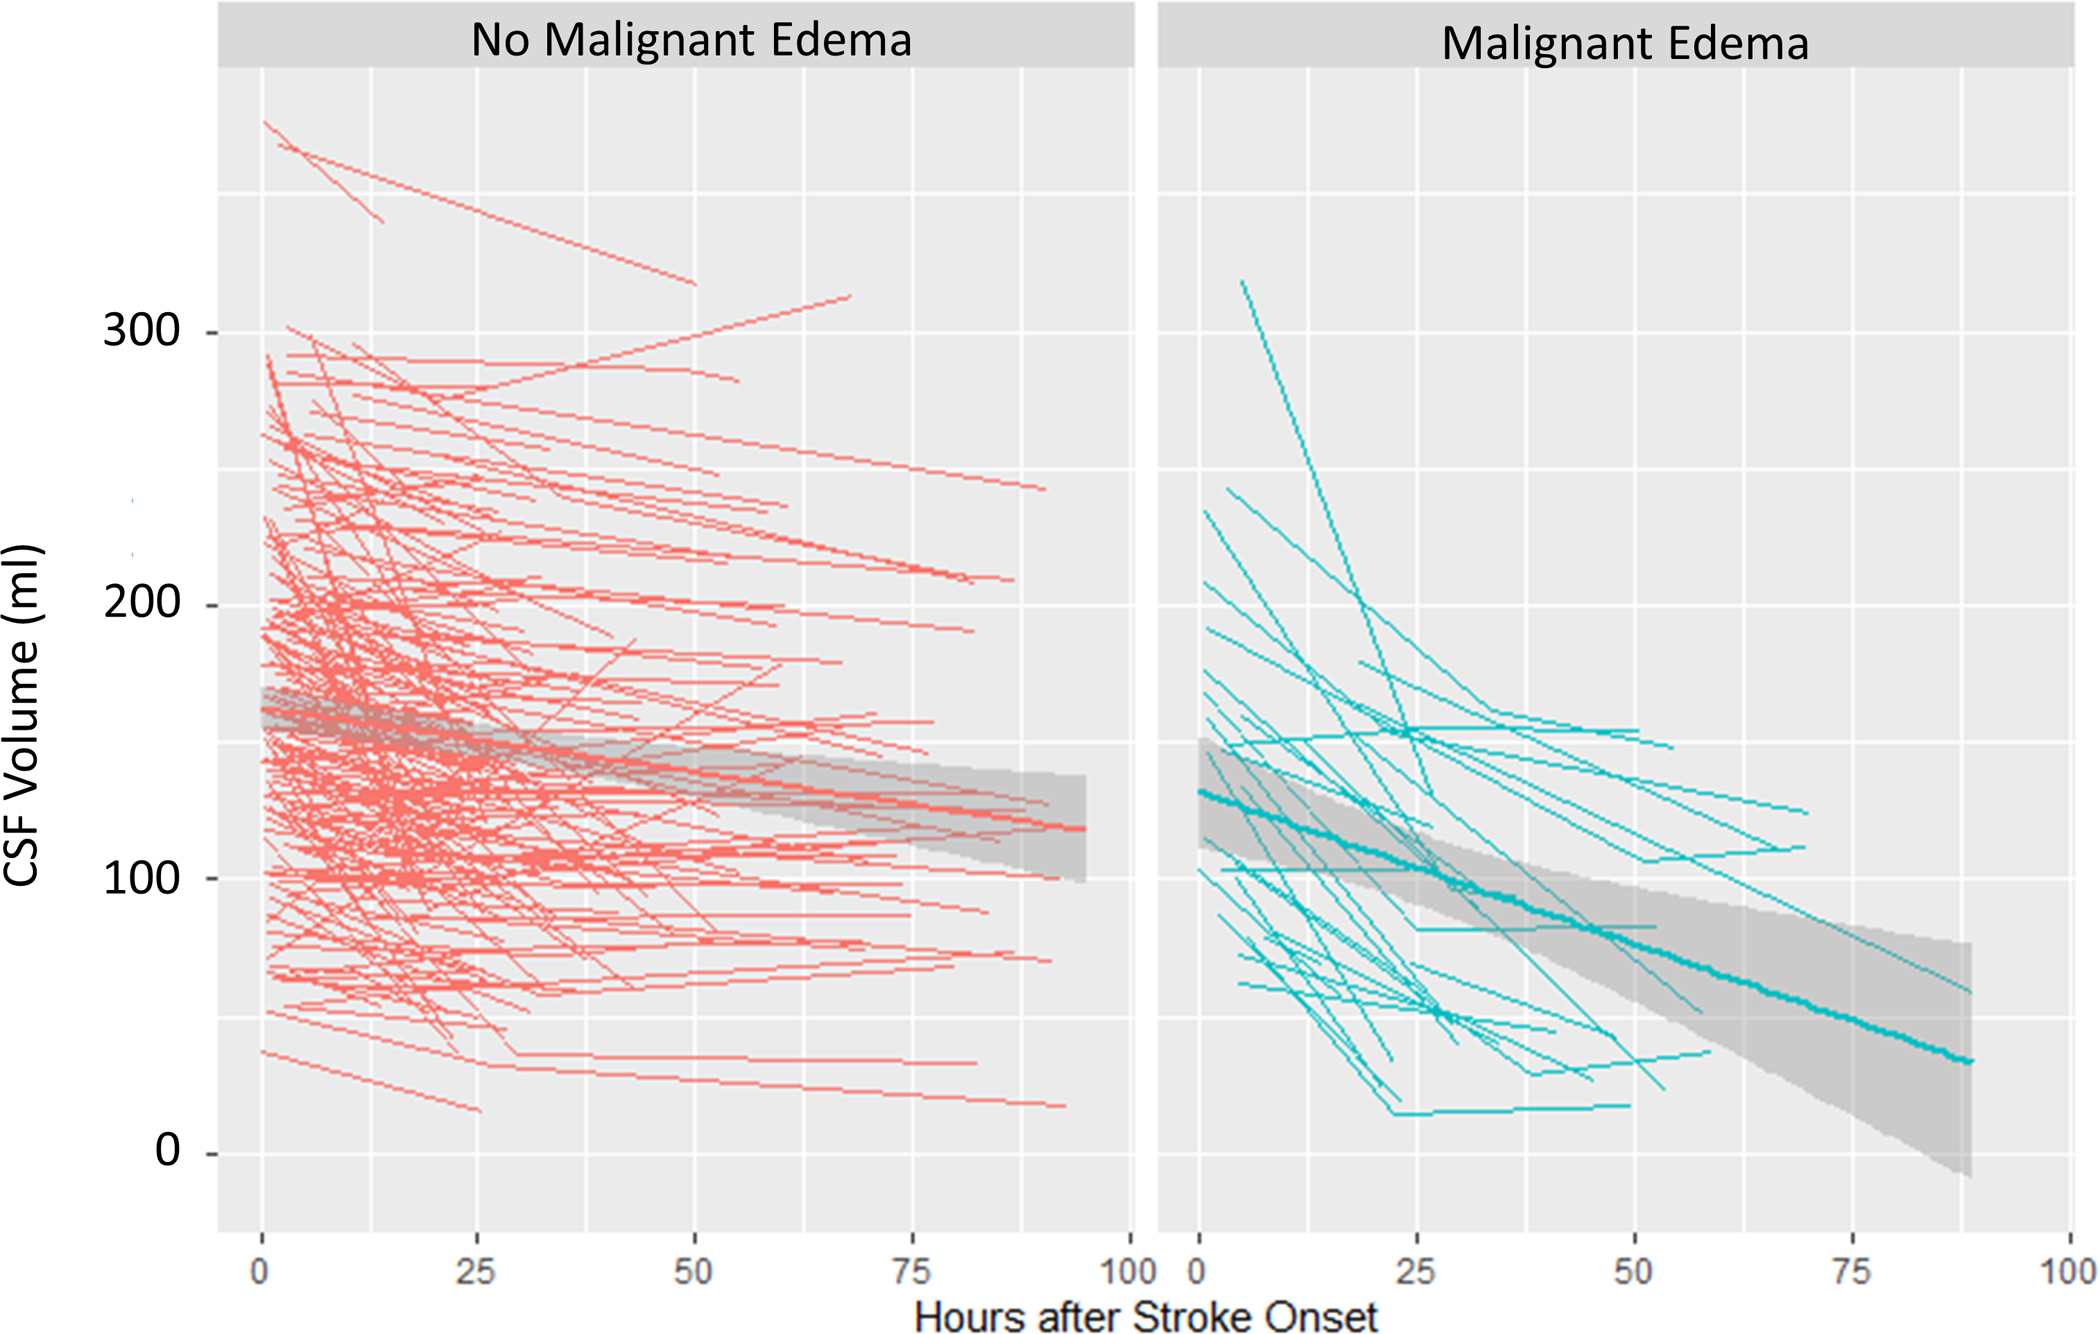
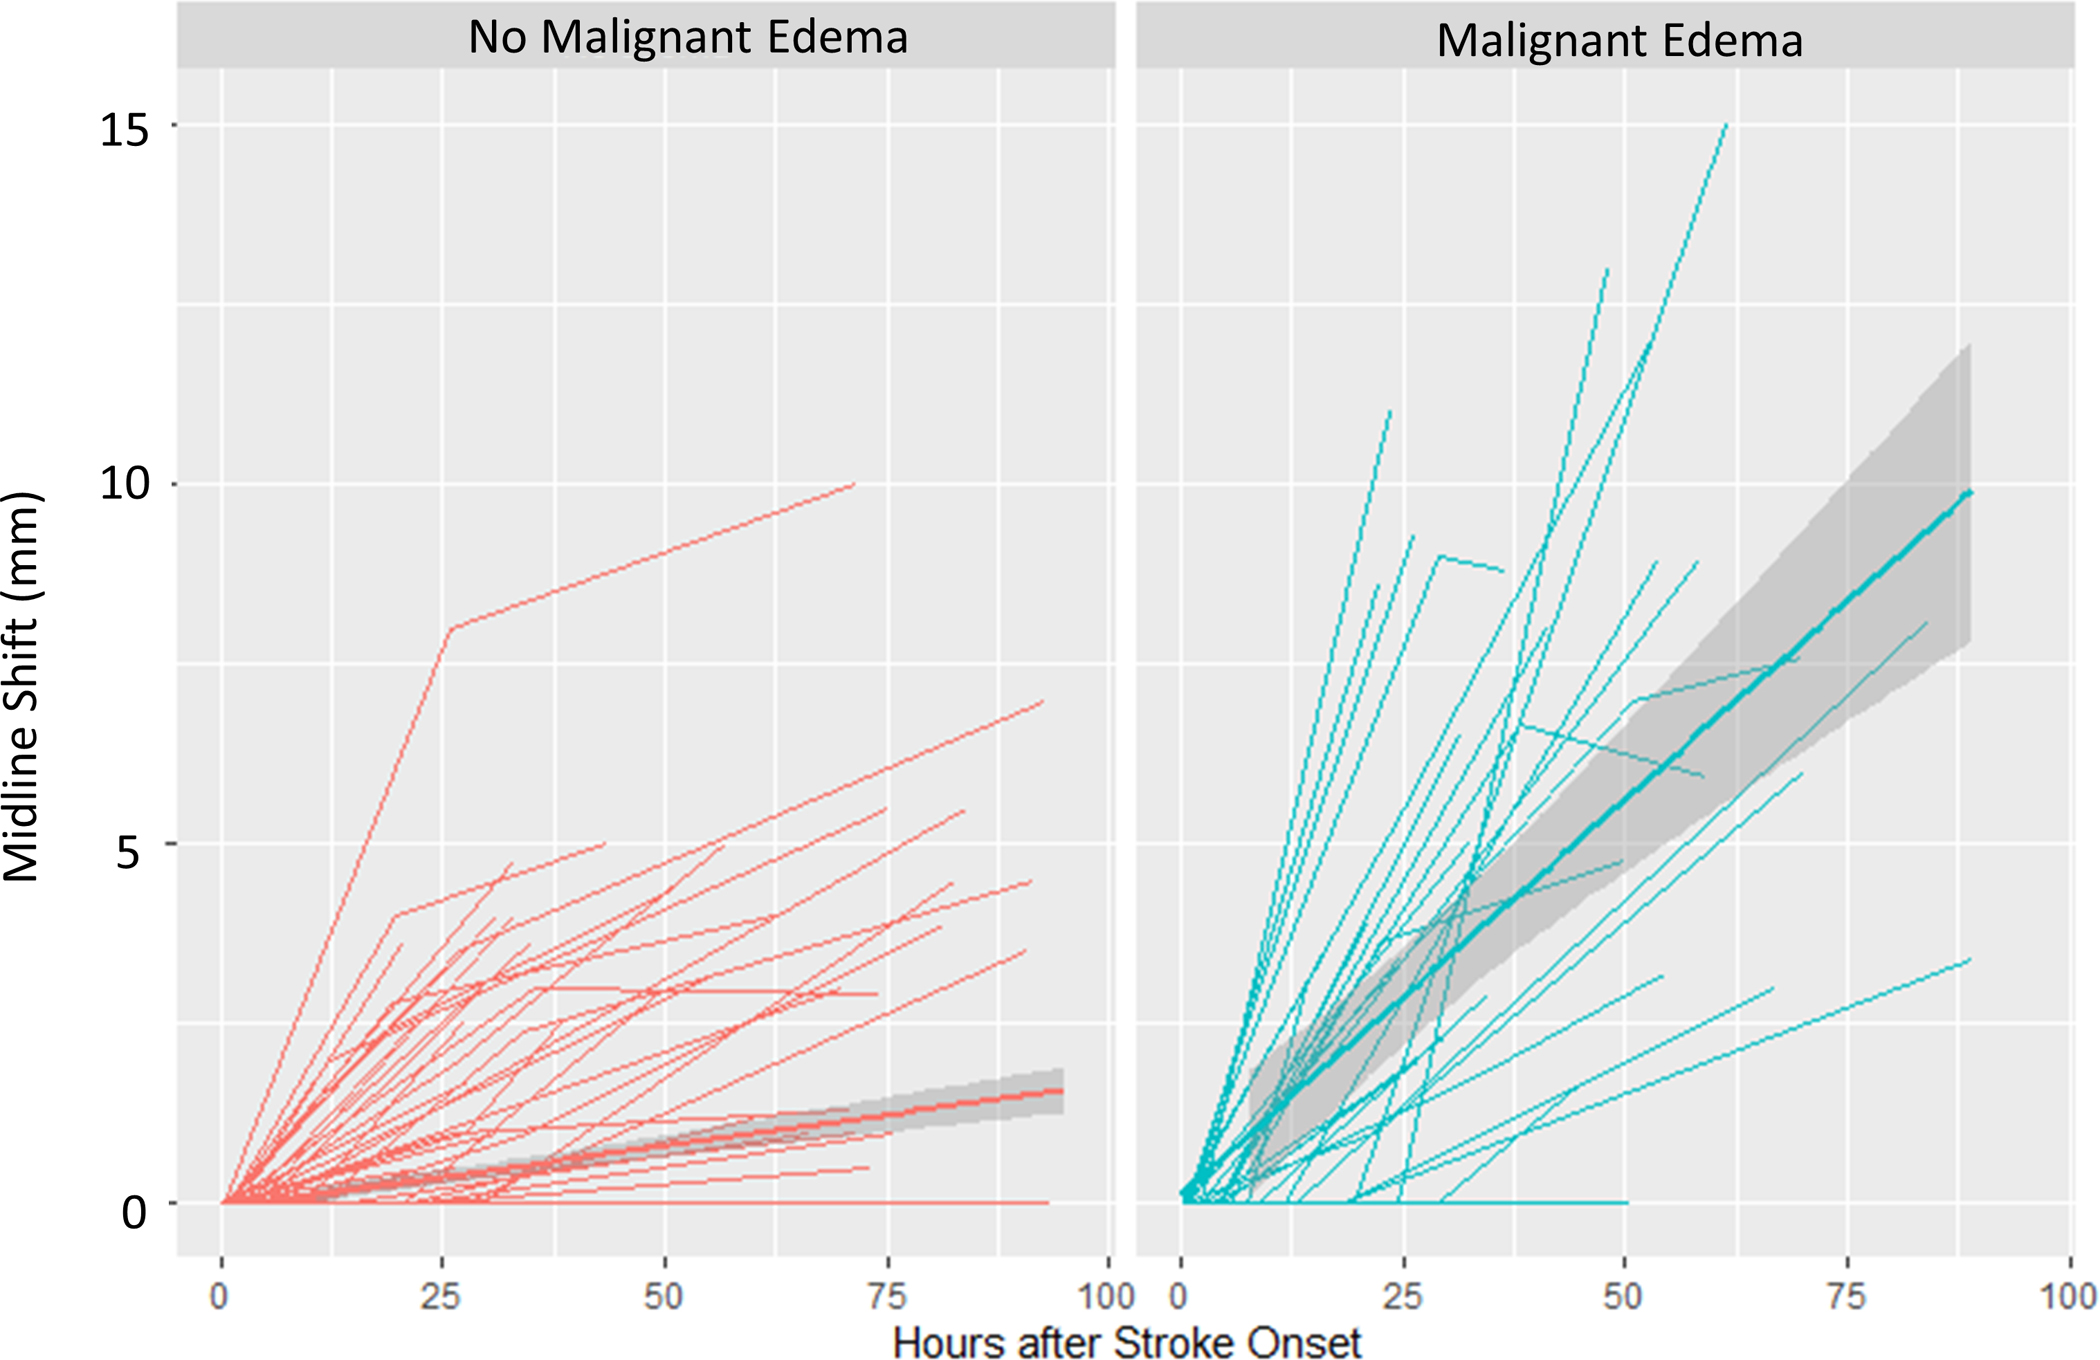
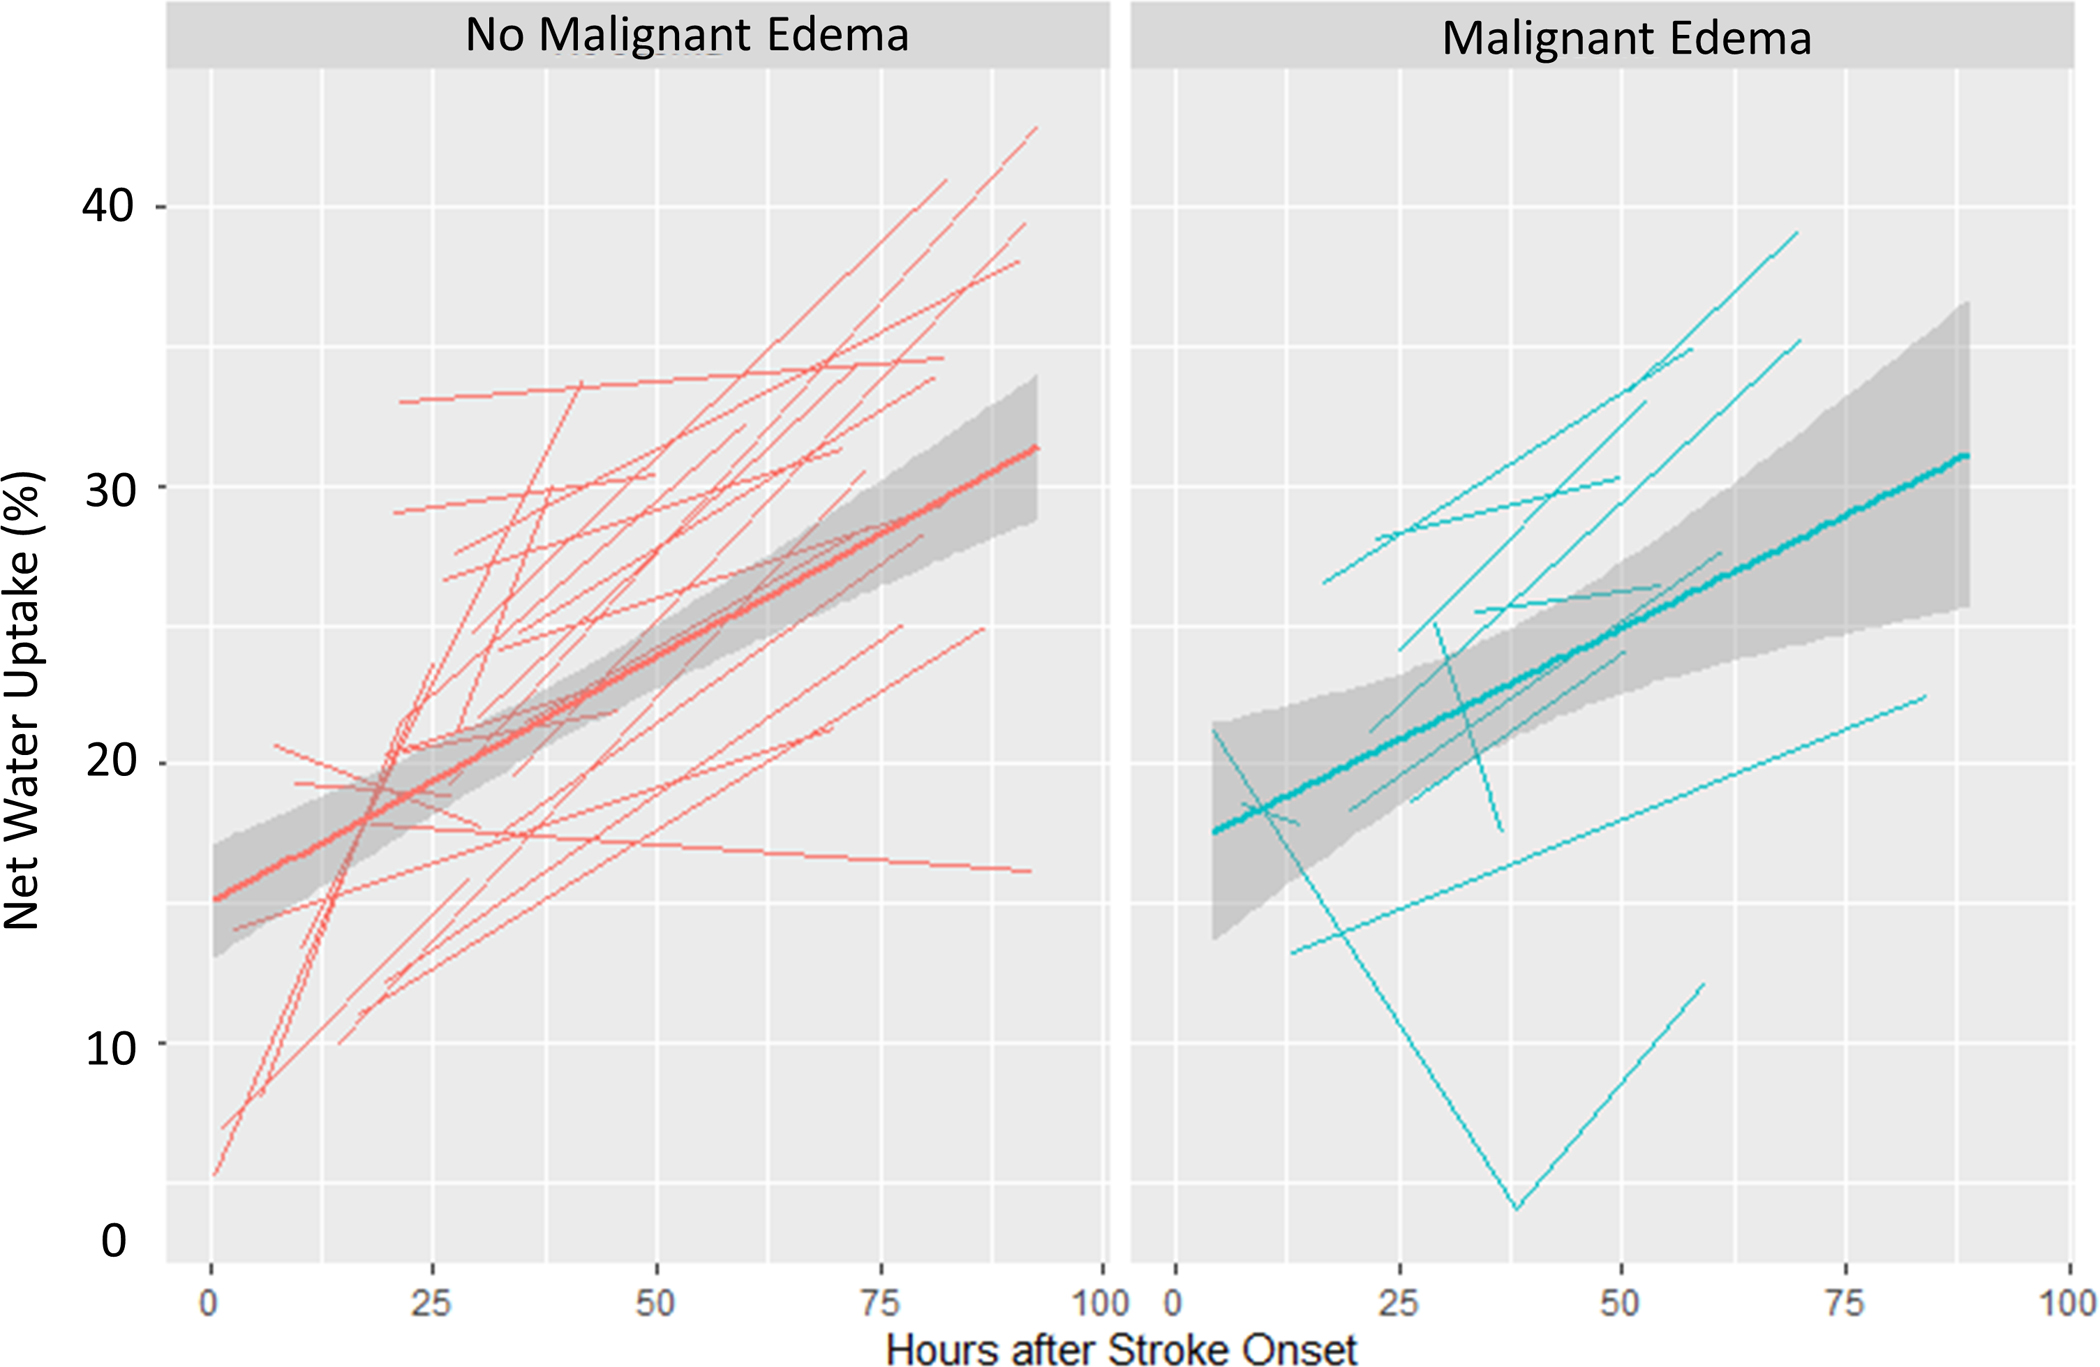
Methods: Patients with large vessel occlusion stroke from three institutions were analyzed. An automated pipeline extracted brain, cerebrospinal fluid (CSF), and infarct volumes from serial CTs. Several biomarkers were measured: change in global CSF volume from baseline (ΔCSF); ratio of CSF volumes between hemispheres (CSF ratio); and relative density of infarct region compared with mirrored contralateral region (net water uptake [NWU]). These were compared to radiographic standards, midline shift and relative hemispheric volume (RHV) and malignant edema, defined as deterioration resulting in need for osmotic therapy, decompressive surgery, or death.
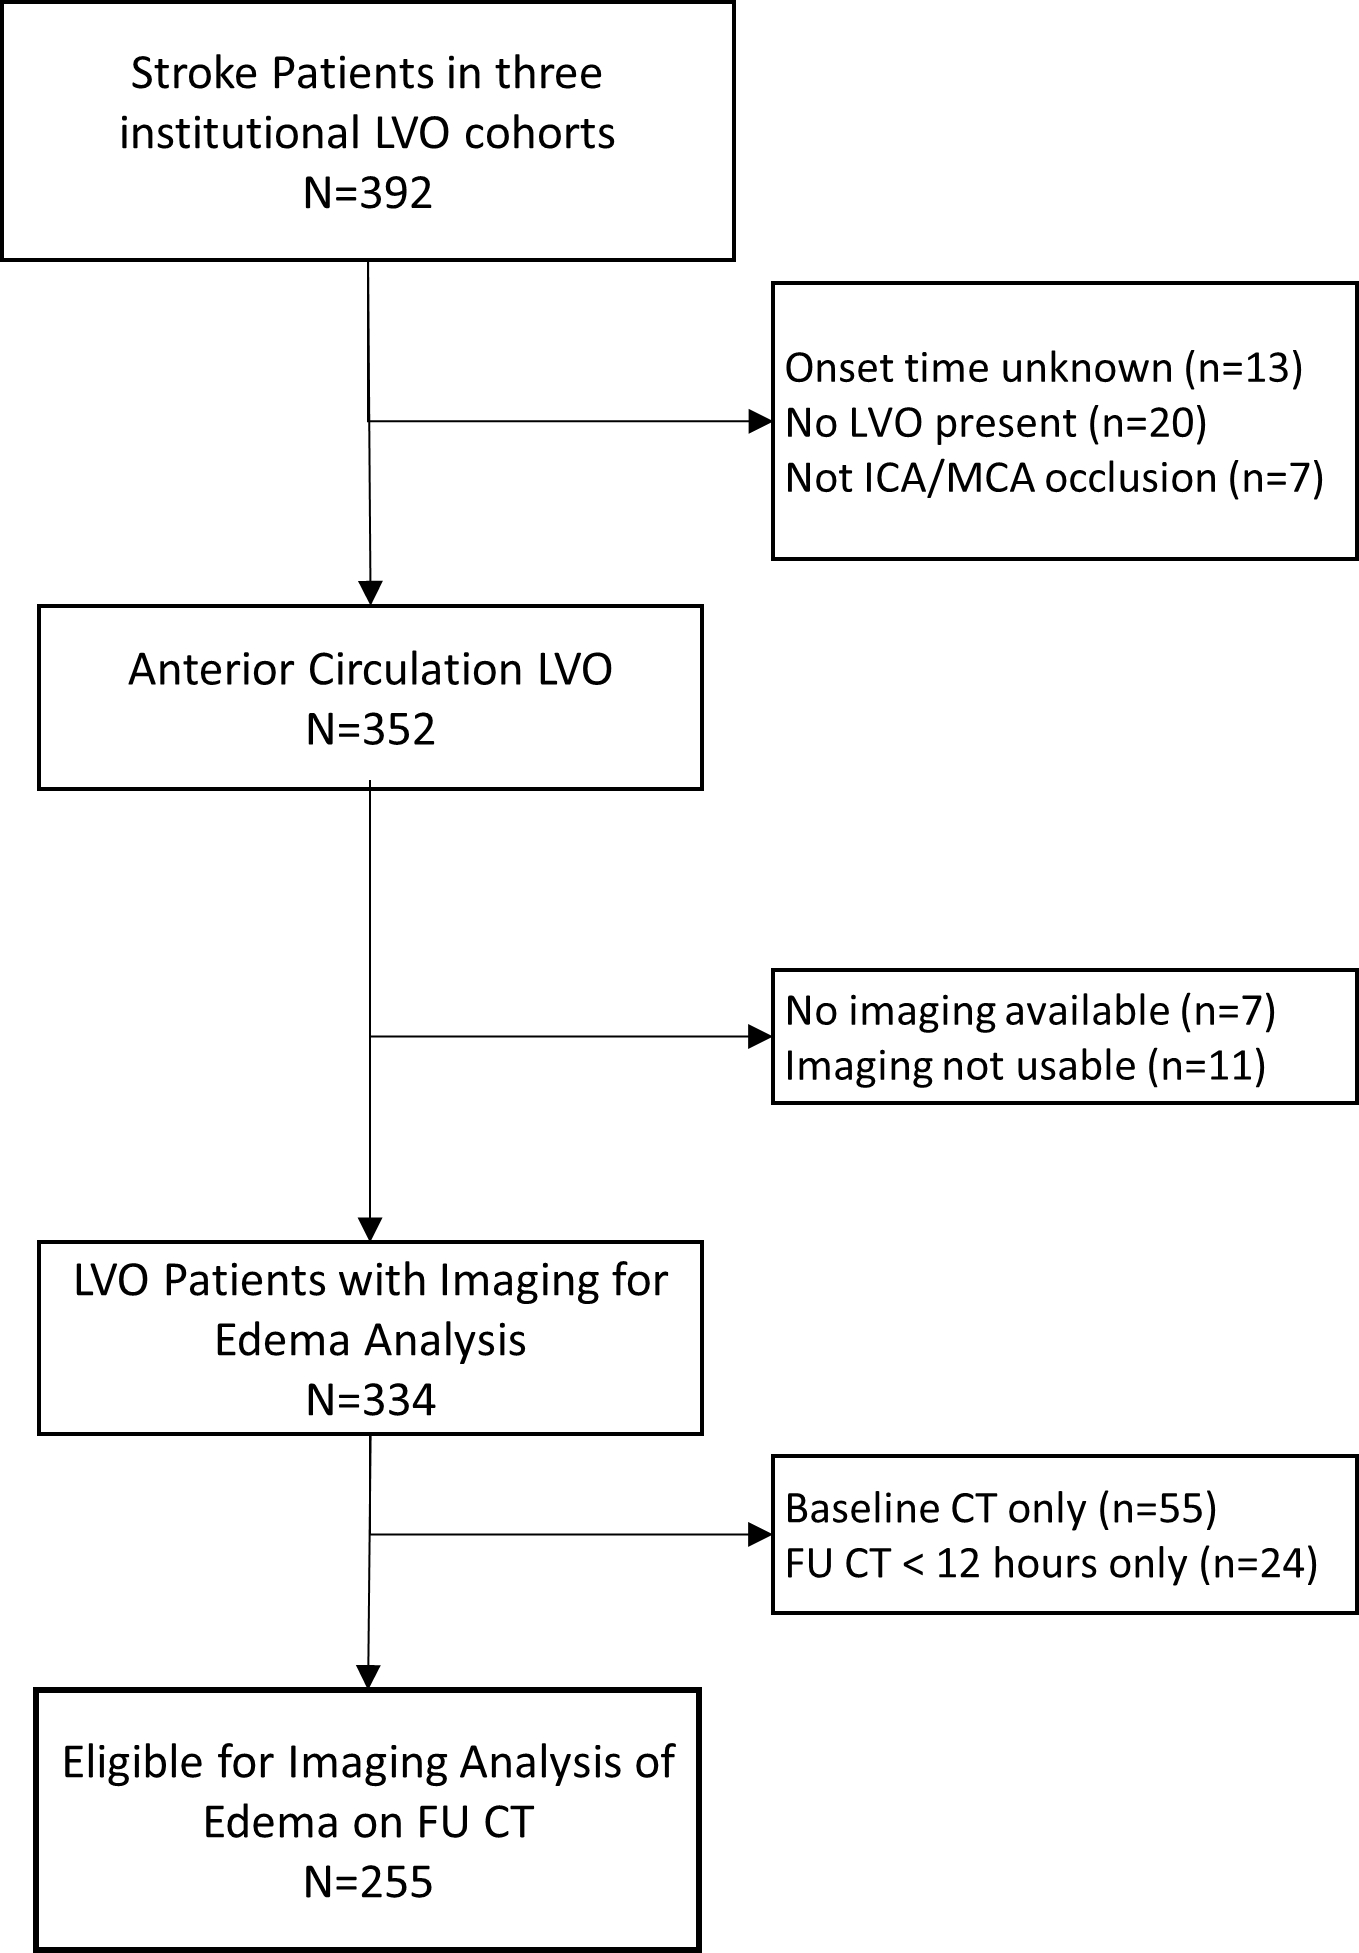
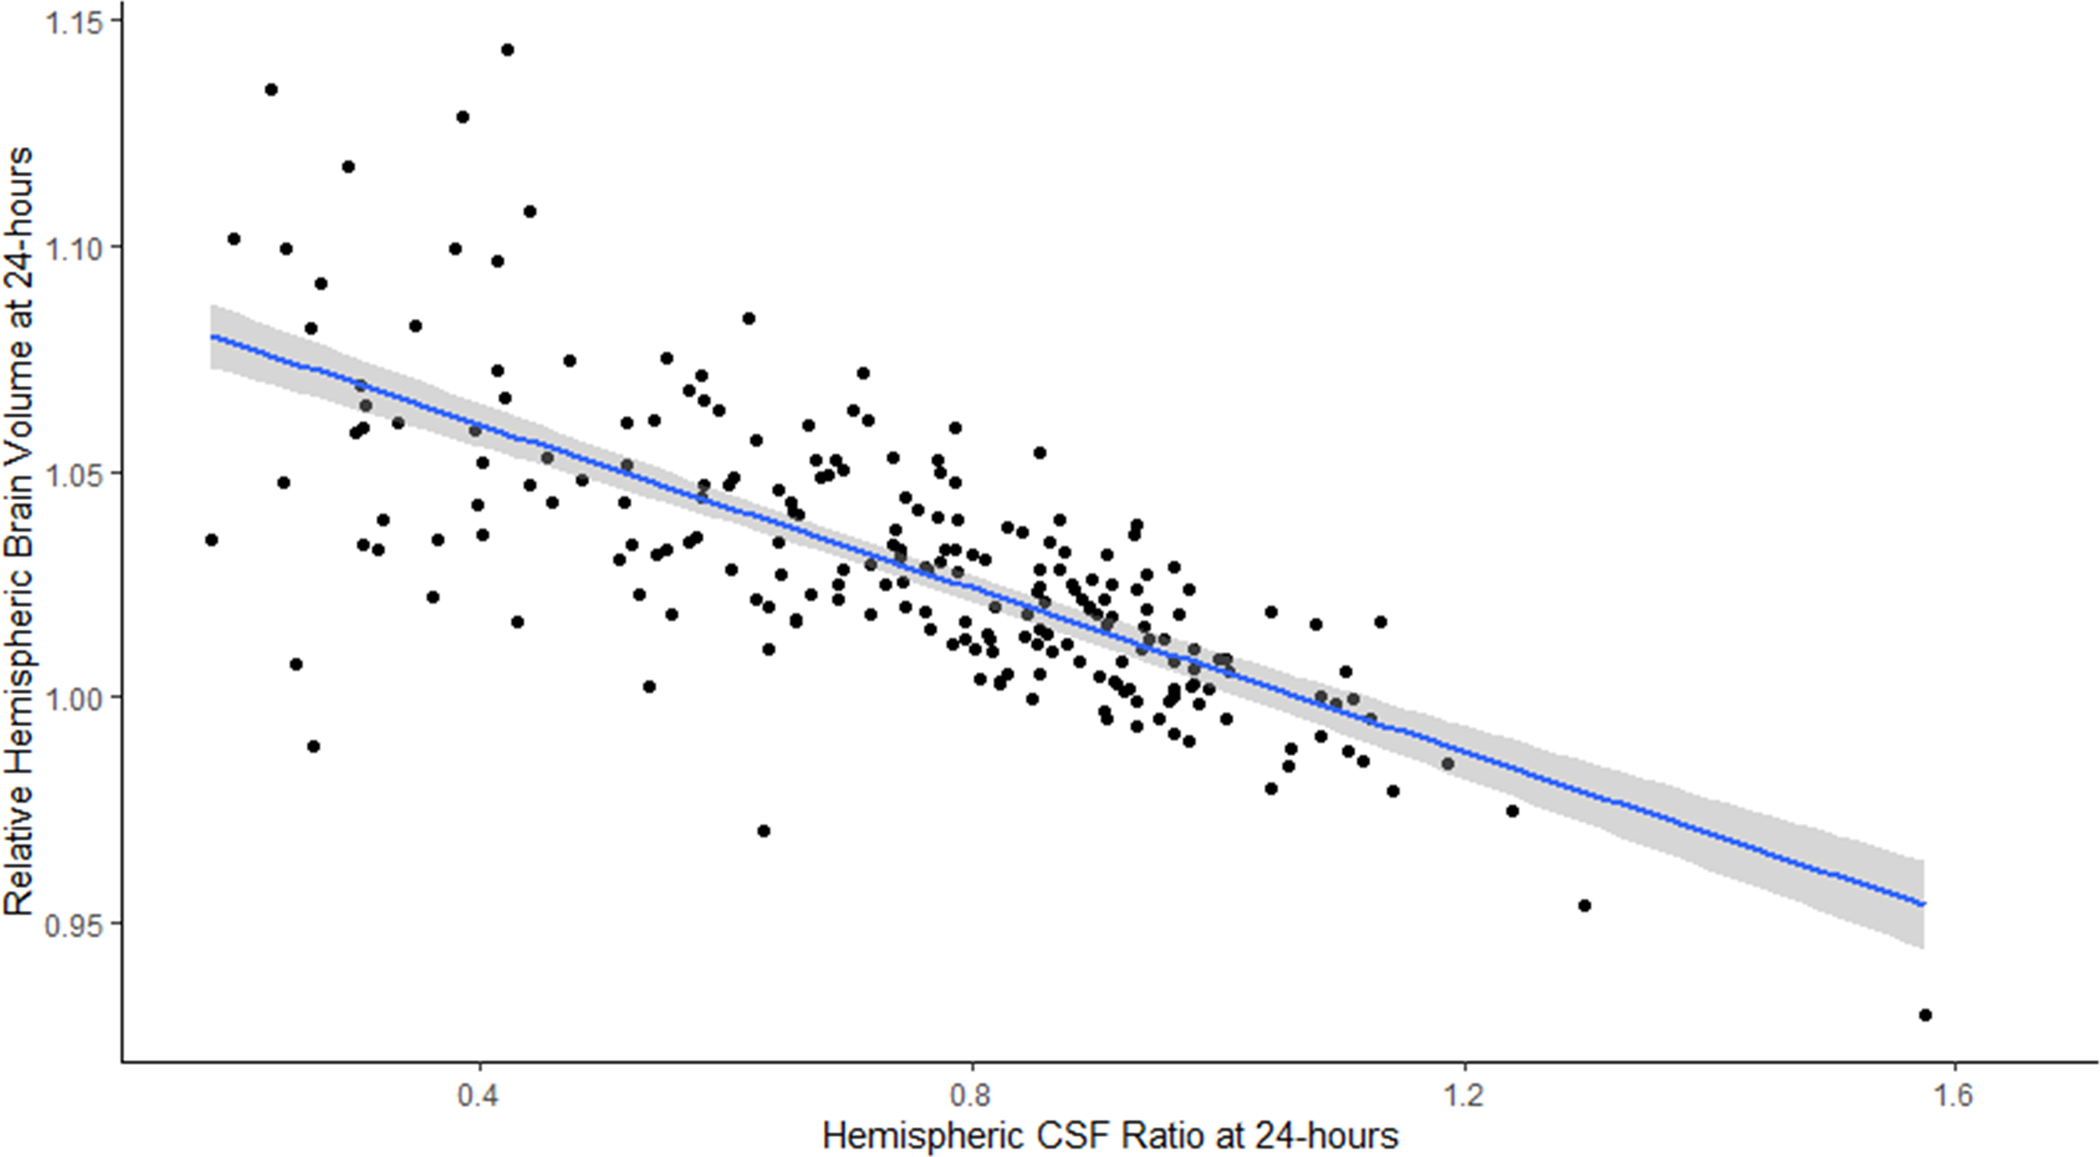
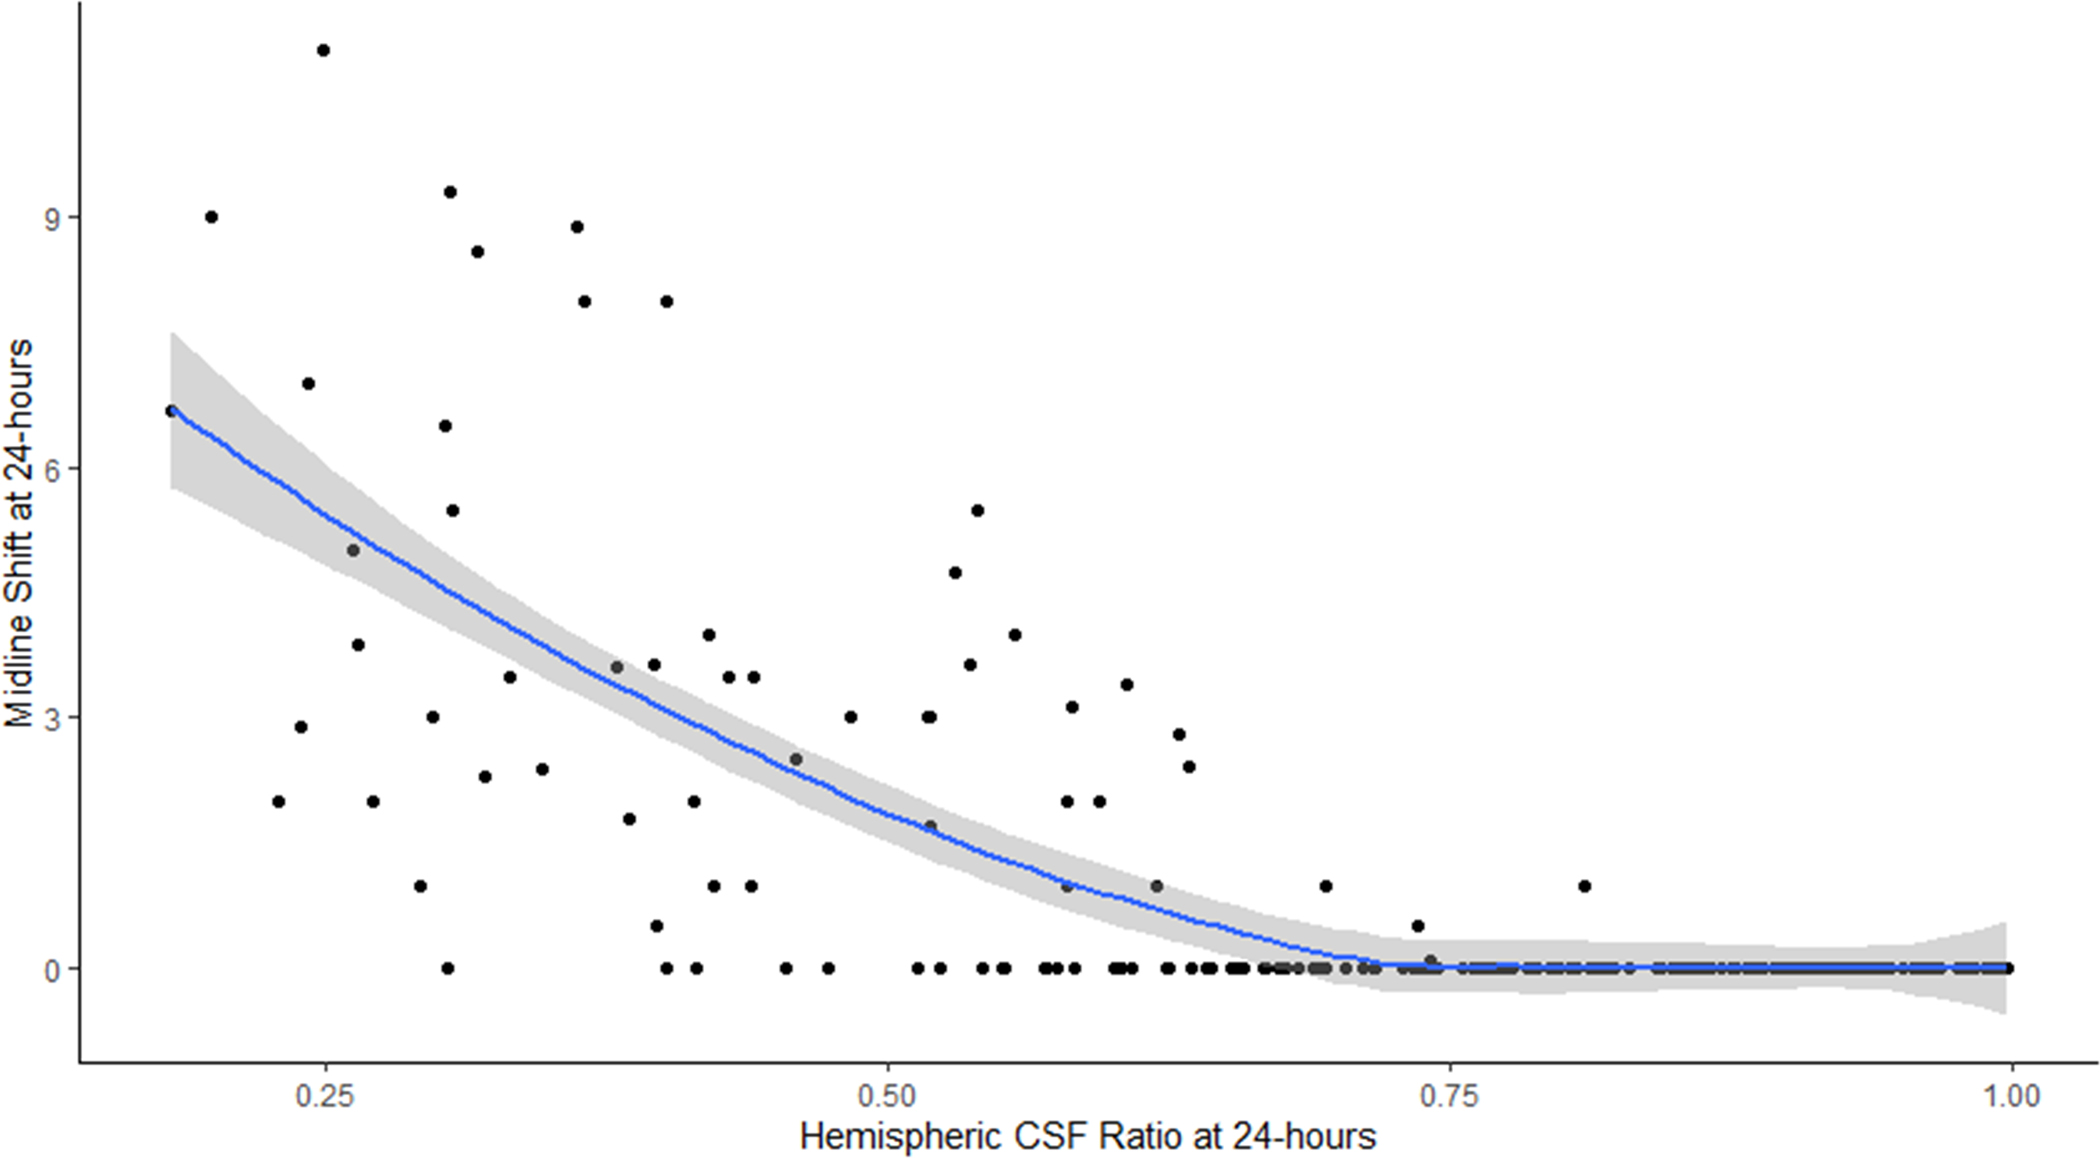
Results: We analyzed 255 patients with 210 baseline CTs, 255 24-hour CTs, and 81 72-hour CTs. Of these, 35 (14%) developed malignant edema and 63 (27%) midline shift. CSF metrics could be calculated for 310 (92%), while NWU could only be obtained from 193 (57%). Peak midline shift was correlated with baseline CSF ratio (ρ = -.22) and with CSF ratio and ΔCSF at 24 hours (ρ = -.55/.63) and 72 hours (ρ = -.66/.69), but not with NWU (ρ = .15/.25). Similarly, CSF ratio was correlated with RHV (ρ = -.69/-.78), while NWU was not. Adjusting for age, National Institutes of Health Stroke Scale, tissue plasminogen activator treatment, and Alberta Stroke Program Early CT Score, CSF ratio (odds ratio [OR]: 1.95 per 0.1, 95% confidence interval [CI]: 1.52-2.59) and ΔCSF at 24 hours (OR: 1.87 per 10%, 95% CI: 1.47-2.49) were associated with malignant edema.
Conclusion: CSF volumetric biomarkers can be automatically measured from almost all routine CTs and correlate better with standard edema endpoints than net water uptake.
Keywords: biomarkers; brain water; cerebral edema; cerebrospinal fluid; computed tomography; midline shift; stroke.
© 2023 American Society of Neuroimaging.
Conflict of interest statement
Disclosure:
The authors have no relevant conflicts of interest to disclose.
Figures
Similar articles
-
CSF-Based Volumetric Imaging Biomarkers Highlight Incidence and Risk Factors for Cerebral Edema After Ischemic Stroke.Neurocrit Care. 2024 Feb;40(1):303-313. doi: 10.1007/s12028-023-01742-0. Epub 2023 May 15. Neurocrit Care. 2024. PMID: 37188885 Free PMC article.
-
Correlation Between Computed Tomography-Based Tissue Net Water Uptake and Volumetric Measures of Cerebral Edema After Reperfusion Therapy.Stroke. 2022 Aug;53(8):2628-2636. doi: 10.1161/STROKEAHA.121.037073. Epub 2022 Apr 22. Stroke. 2022. PMID: 35450438
-
Reduction in Cerebrospinal Fluid Volume as an Early Quantitative Biomarker of Cerebral Edema After Ischemic Stroke.Stroke. 2020 Feb;51(2):462-467. doi: 10.1161/STROKEAHA.119.027895. Epub 2019 Dec 10. Stroke. 2020. PMID: 31818229 Free PMC article.
-
Automated quantitative assessment of cerebral edema after ischemic stroke using CSF volumetrics.Neurosci Lett. 2020 Apr 17;724:134879. doi: 10.1016/j.neulet.2020.134879. Epub 2020 Feb 29. Neurosci Lett. 2020. PMID: 32126249 Free PMC article. Review.
-
Review of net water uptake in the management of acute ischemic stroke.Eur Radiol. 2022 Aug;32(8):5517-5524. doi: 10.1007/s00330-022-08658-x. Epub 2022 Mar 12. Eur Radiol. 2022. PMID: 35278122 Review.
Cited by
-
Early automated cerebral edema assessment following endovascular therapy: impact on stroke outcome.J Neurointerv Surg. 2025 Mar 17;17(4):354-359. doi: 10.1136/jnis-2024-021641. J Neurointerv Surg. 2025. PMID: 38637151
-
Transcutaneous Auricular Vagus Nerve Stimulation Reduces Inflammatory Biomarkers and May Improve Outcomes after Large Vessel Occlusion Strokes: Results of the Randomized Clinical Trial NUVISTA.medRxiv [Preprint]. 2025 Mar 7:2025.03.06.25323500. doi: 10.1101/2025.03.06.25323500. medRxiv. 2025. PMID: 40093228 Free PMC article. Preprint.
-
Global collaboration and innovation in malignant cerebral edema research: a bibliometric perspective.Front Neurol. 2025 Jul 23;16:1624101. doi: 10.3389/fneur.2025.1624101. eCollection 2025. Front Neurol. 2025. PMID: 40771971 Free PMC article.
-
Updates in Management of Large Hemispheric Infarct.Semin Neurol. 2024 Jun;44(3):281-297. doi: 10.1055/s-0044-1787046. Epub 2024 May 17. Semin Neurol. 2024. PMID: 38759959 Free PMC article. Review.
References
Publication types
MeSH terms
Substances
Grants and funding
LinkOut - more resources
Full Text Sources
Medical
Research Materials
