. 2023 Jan;20(1):186-197.
doi: 10.1080/15476286.2023.2204586.

Prior metabolite extraction fully preserves RNAseq quality and enables integrative multi-'omics analysis of the liver metabolic response to viral infection

Affiliations

Prior metabolite extraction fully preserves RNAseq quality and enables integrative multi-'omics analysis of the liver metabolic response to viral infection

Zachary B Madaj et al. RNA Biol. 2023 Jan.

Abstract

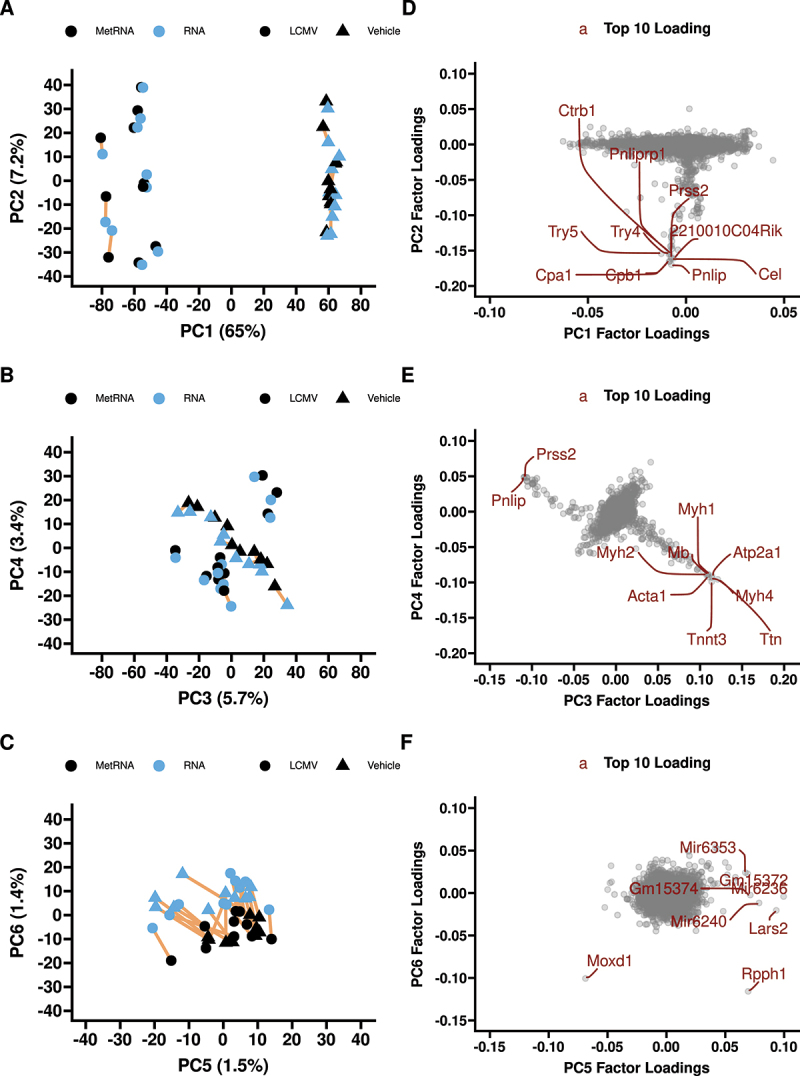
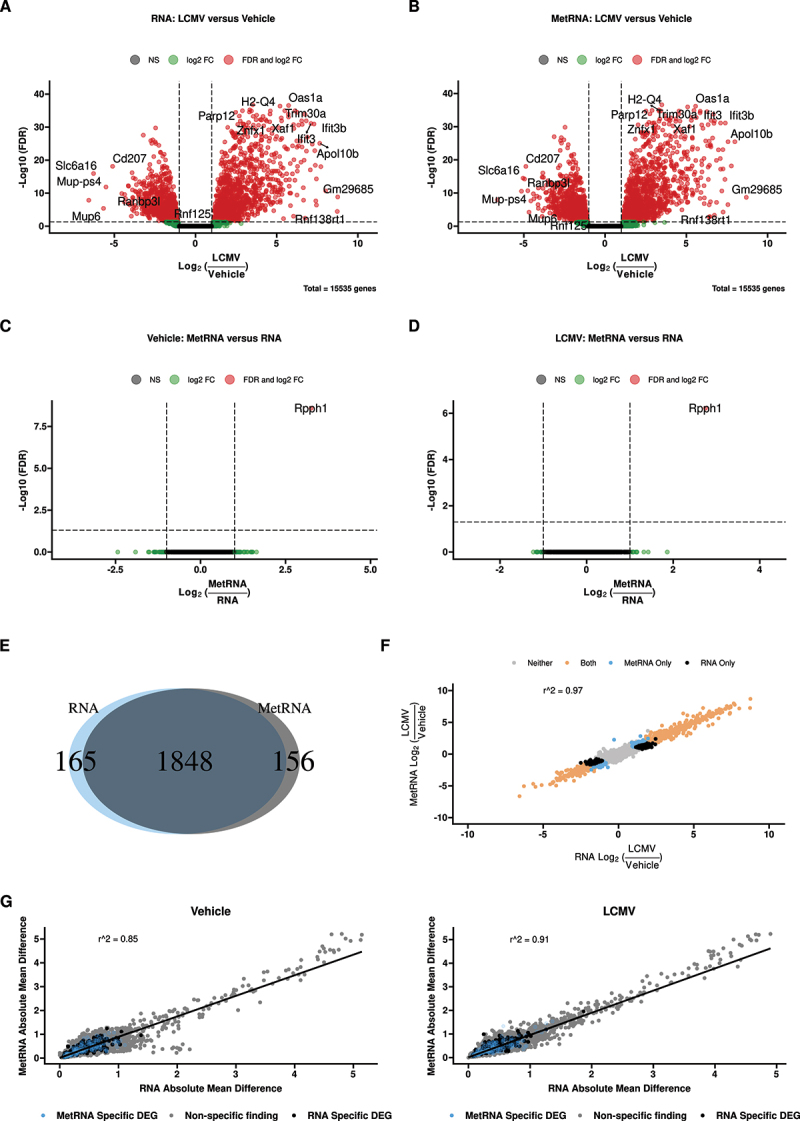
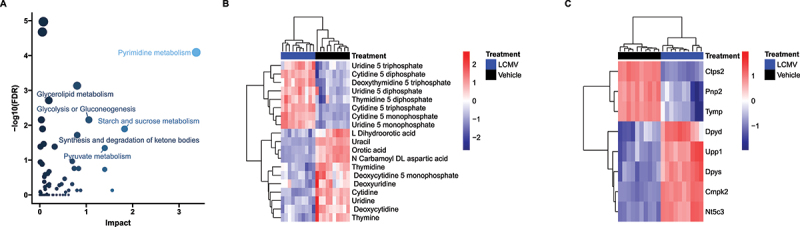
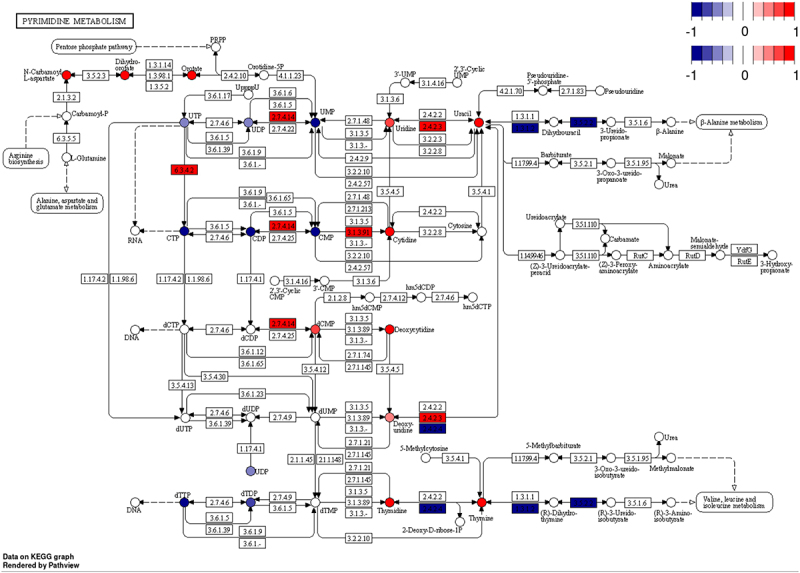
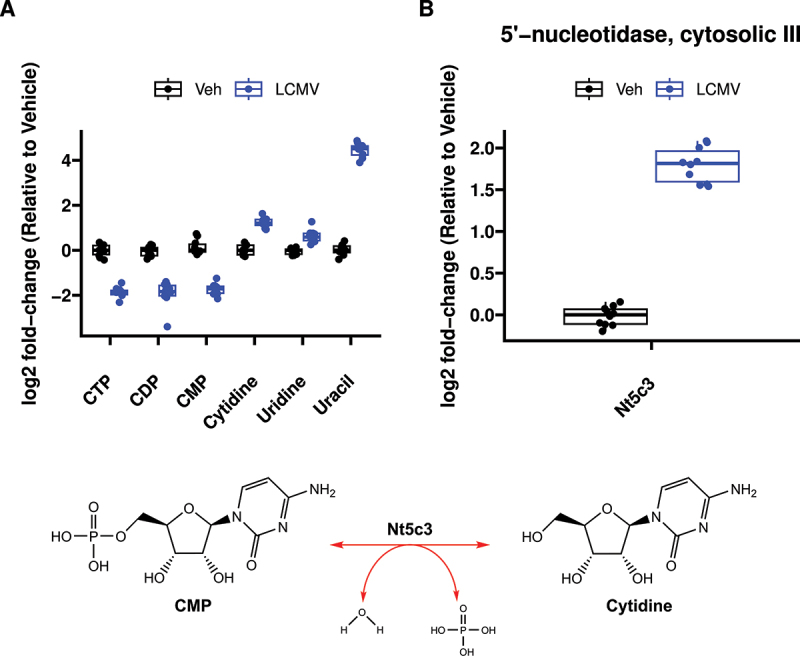
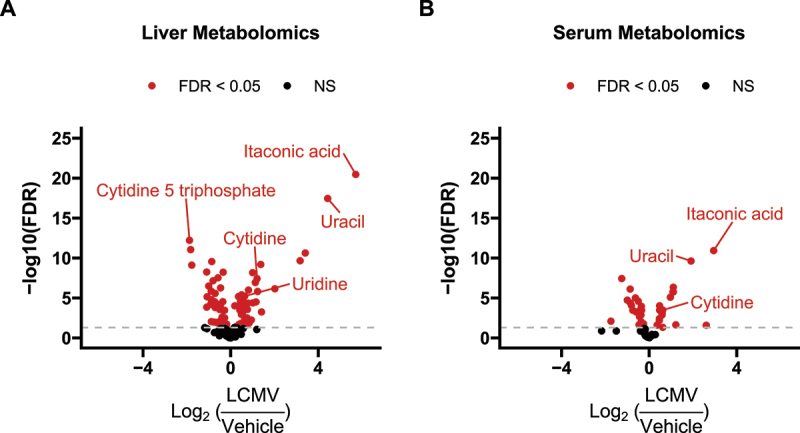
Here, we provide an in-depth analysis of the usefulness of single-sample metabolite/RNA extraction for multi-'omics readout. Using pulverized frozen livers of mice injected with lymphocytic choriomeningitis virus (LCMV) or vehicle (Veh), we isolated RNA prior (RNA) or following metabolite extraction (MetRNA). RNA sequencing (RNAseq) data were evaluated for differential expression analysis and dispersion, and differential metabolite abundance was determined. Both RNA and MetRNA clustered together by principal component analysis, indicating that inter-individual differences were the largest source of variance. Over 85% of LCMV versus Veh differentially expressed genes were shared between extraction methods, with the remaining 15% evenly and randomly divided between groups. Differentially expressed genes unique to the extraction method were attributed to randomness around the 0.05 FDR cut-off and stochastic changes in variance and mean expression. In addition, analysis using the mean absolute difference showed no difference in the dispersion of transcripts between extraction methods. Altogether, our data show that prior metabolite extraction preserves RNAseq data quality, which enables us to confidently perform integrated pathway enrichment analysis on metabolomics and RNAseq data from a single sample. This analysis revealed pyrimidine metabolism as the most LCMV-impacted pathway. Combined analysis of genes and metabolites in the pathway exposed a pattern in the degradation of pyrimidine nucleotides leading to uracil generation. In support of this, uracil was among the most differentially abundant metabolites in serum upon LCMV infection. Our data suggest that hepatic uracil export is a novel phenotypic feature of acute infection and highlight the usefulness of our integrated single-sample multi-'omics approach.

Keywords: RNA; Transcriptomics; integrated omics; mass spectrometry; metabolomics; systems biology.


Conflict of interest statement

RGJ is a scientific advisor for Agios Pharmaceuticals and Servier Pharmaceuticals and is a member of the Scientific Advisory Board of Immunomet Therapeutics.

Figures

Figure 1.
Figure 1.
First six principal components of the RNAseq data (A, B, C) with factor loadings (D, E, F). Principal components 7 and beyond explain<1% of the variance each. The top 10 highest contributing genes are labelled in red on the factor loading plots. 65% of the transcriptomic variance is explained by treatment with LCMV and>7% is between subject variance within treatment. PC6 explains~1.4% of the variance and separates extraction methods; PC6 is driven primarily by Rpph1 and Moxd1. n = 10 LCMV and n = 10 vehicle MetRNA and RNA pairs. Yellow lines connect paired samples (metRNA and RNA from same biological sample).
Figure 2.
Figure 2.
Comparison of the RNAseq data obtained with the two extraction methods (RNA: classical mRNA isolation; MetRNA: metabolite extraction was performed prior to mRNA isolation). (A) and (B) Volcano plots of genes differentially expressed between vehicle and LCMV animals within both extraction methods. (C) and (D) Volcano plots of genes differentially expressed between the extraction methods within vehicle and LCMV animals, respectively. (E) Venn diagram of the genes found to be differentially expressed with FDR<0.05 in both extraction methods, ~85% of the 2,169 genes found to be differentially expressed in at least one extraction method were significantly different in both. (F) Correlation of the log2 fold-change in gene expression (LCMV/Veh) between the two extraction methods. Over 97% of the variance in one extraction method was explained by the other, further genes that were only identified as differentially expressed in one method had only slight changes in estimated fold-change. (G) Correlating mean absolute difference of each gene between the two extraction methods in vehicle and LCMV animals; both were significantly correlated (p < 0.05). Genes that were called as differentially expressed in only one of the two extraction methods also have similar dispersion. n = 10 pairs per treatment.
Figure 3.
Figure 3.
Integrated Metabolic Pathway Enrichment. (A) Plot of how much each pathway examined by MetaboAnalyst was impacted by changes in gene expression and whether or not these changes were significant after FDR adjustment. Data are coloured by impact and sized by FDR values. The pyrimidine metabolism pathway was the most impacted (FDR<0.0001). (B) and (C) Heatmaps of pyrimidine metabolites and transcripts that were measured in this study. For both – omics, we observed both up and down regulation within the pathway and strong clustering within LCMV/Vehicle. n = 10 per treatment.
Figure 4.
Figure 4.
Integrative multi-omics analysis demonstrating biological information gain. Significantly different transcripts (boxes) and metabolites (circles) coloured by log2 fold-change mapped to KEGG pathway.
Figure 5.
Figure 5.
Metabolomic and transcriptomic evidence that cytidine nucleotides are being catabolized to form uracil. (A) Relative abundance of metabolites arranged in biochemical order from CTP → CDP → CMP → Cytidine → Uridine → Uracil. (B) Differential expression of 5’-Nucleotidase, Cytosolic IIIA, the transcript for the enzyme catalysing the CMP → cytidine reaction. n = 10 per treatment.
Figure 6.
Figure 6.
Volcano plots of metabolomics data in the (A) liver and (B) serum reveal strong induction in uracil abundance during LCMV infection. ‘FDR’: Indicates Benjamini-Hochberg false discovery rate adjusted p-values<0.05. ‘NS’: not significant. n = 10 per treatment.

Similar articles

Cited by

References

    1. Zhu J, Thompson CB.. Metabolic regulation of cell growth and proliferation. Nat Rev Mol Cell Biol. 2019;20(7):436–450. - PMC - PubMed
    1. Dai Z, Ramesh V, Locasale JW. The evolving metabolic landscape of chromatin biology and epigenetics. Nat Rev Genet. 2020;21(12):737–753. - PMC - PubMed
    1. Wang YP, Li JT, Qu J, et al. Metabolite sensing and signaling in cancer. J Biol Chem. 2020;295(33):11938–11946. DOI:10.1074/jbc.REV119.007624 - DOI - PMC - PubMed
    1. Pavlova NN, Zhu J, Thompson CB. The hallmarks of cancer metabolism: still emerging. Cell Metab. 2022;34(3):355–377. - PMC - PubMed
    1. Inigo M, Deja S, Burgess SC. Ins and outs of the TCA cycle: the central role of anaplerosis. Annu Rev Nutr. 2021;41(1):19–47. - PubMed

Publication types