

Application of colony-stimulating factor 3 in determining the prognosis of high-grade gliomas based on magnetic resonance imaging radiomics
- PMID: 37095939
- PMCID: PMC10122032
- DOI: 10.1016/j.heliyon.2023.e15325
Application of colony-stimulating factor 3 in determining the prognosis of high-grade gliomas based on magnetic resonance imaging radiomics
Abstract
Rationale and objectives: Radiomics is a promising, non-invasive method for determining the prognosis of high-grade glioma (HGG). The connection between radiomics and the HGG prognostic biomarker is still insufficient.
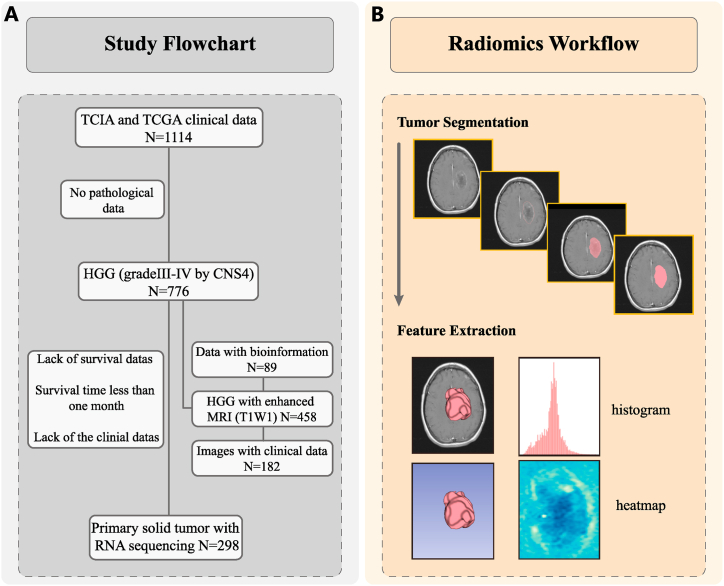
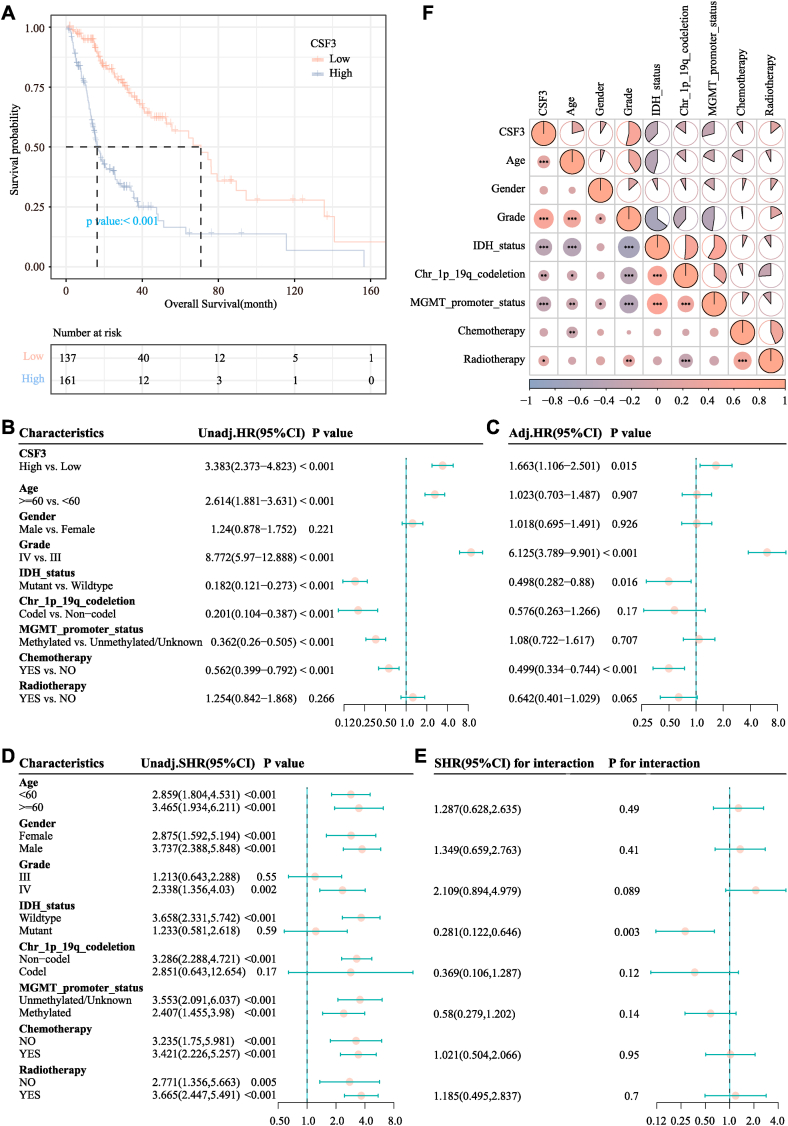
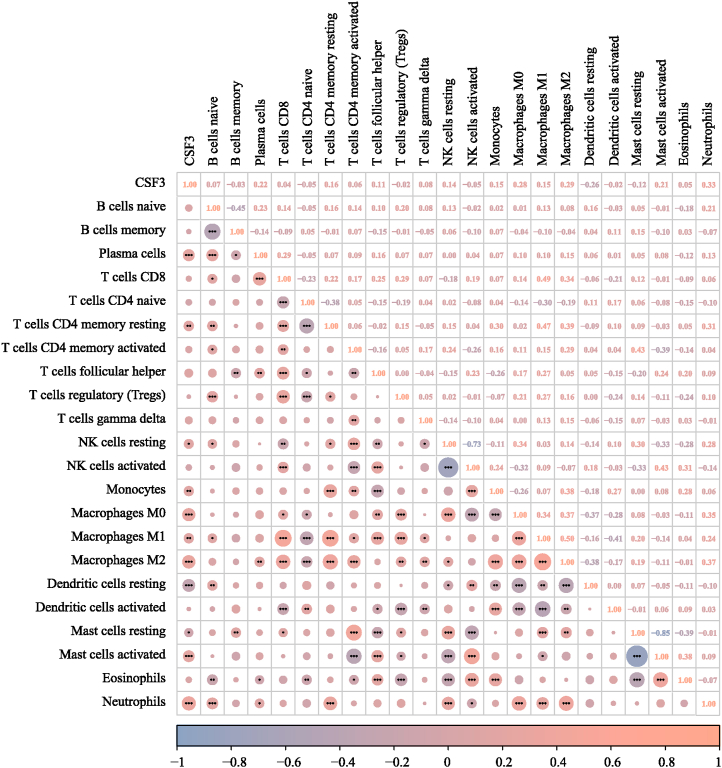
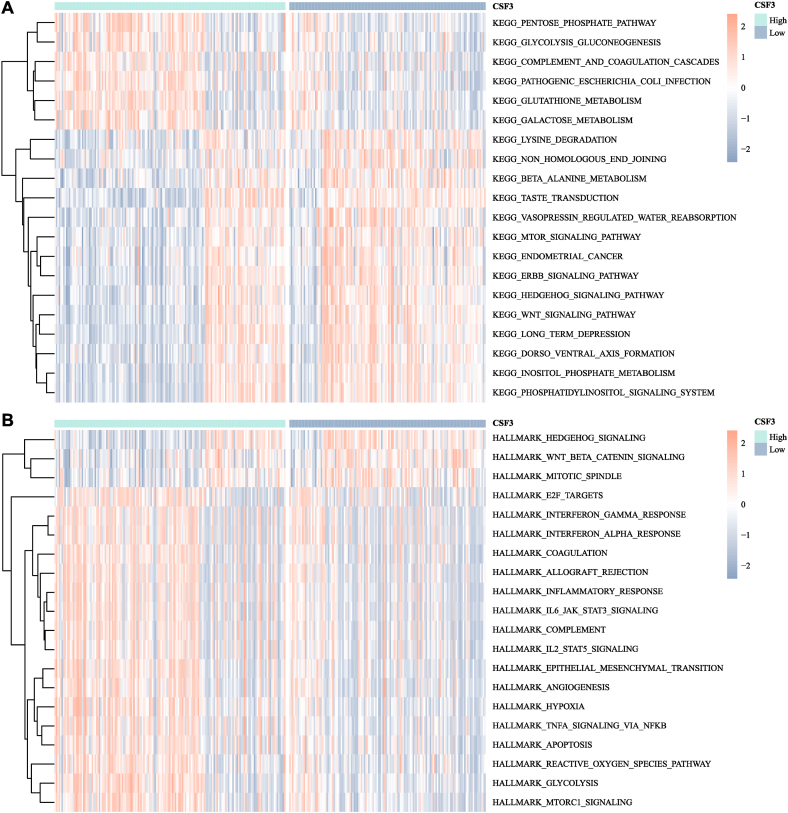
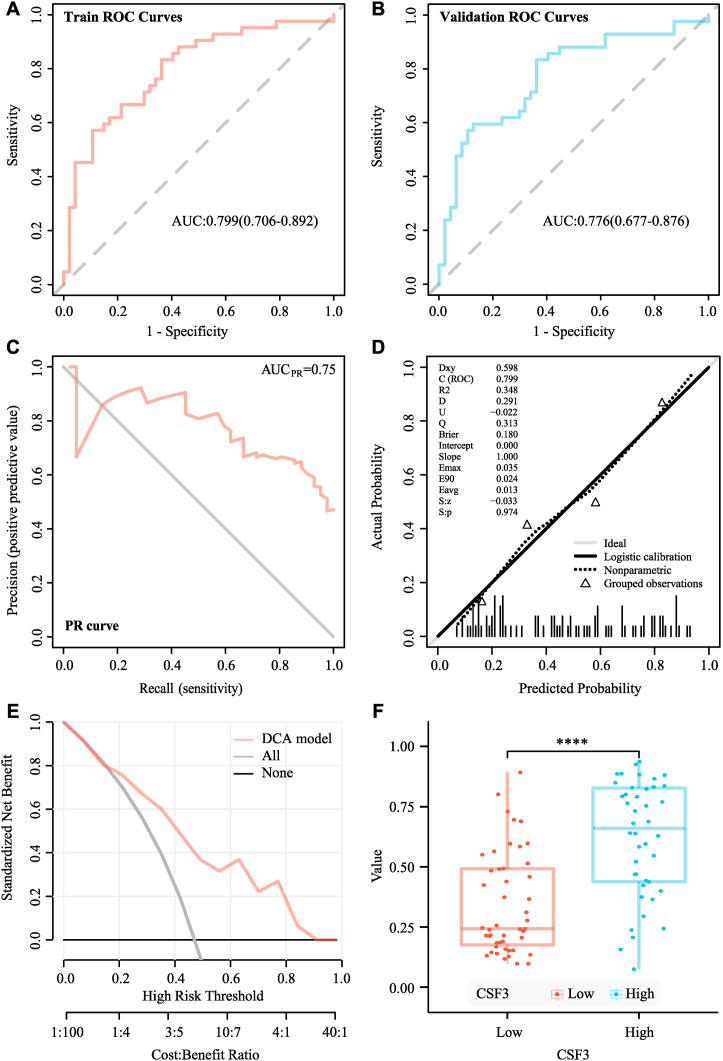
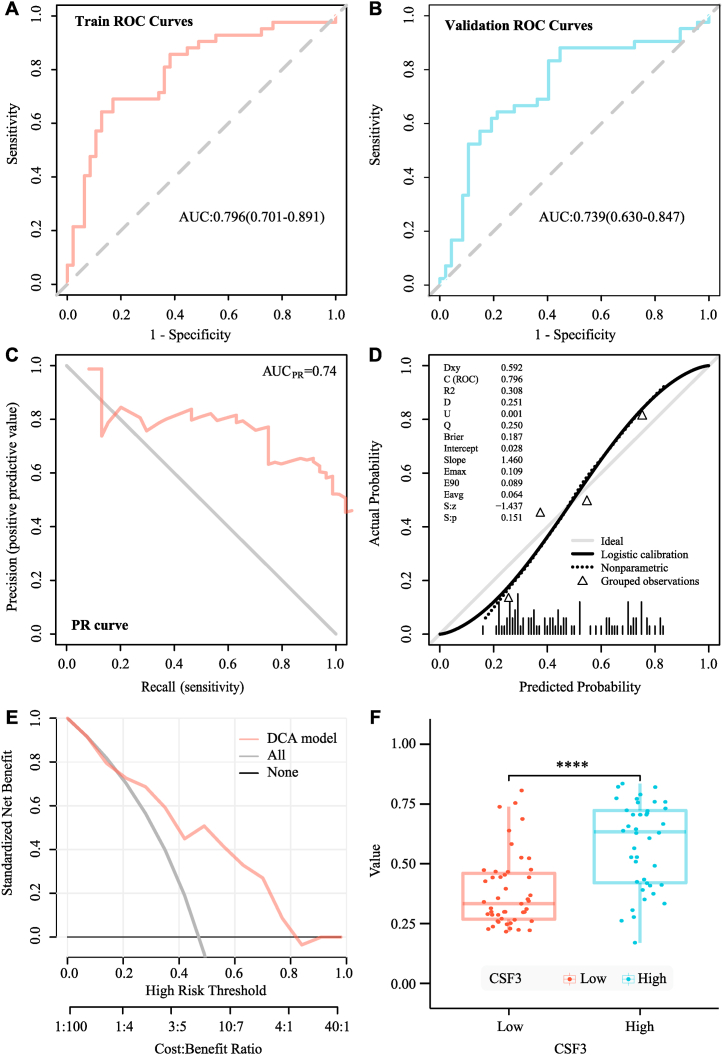
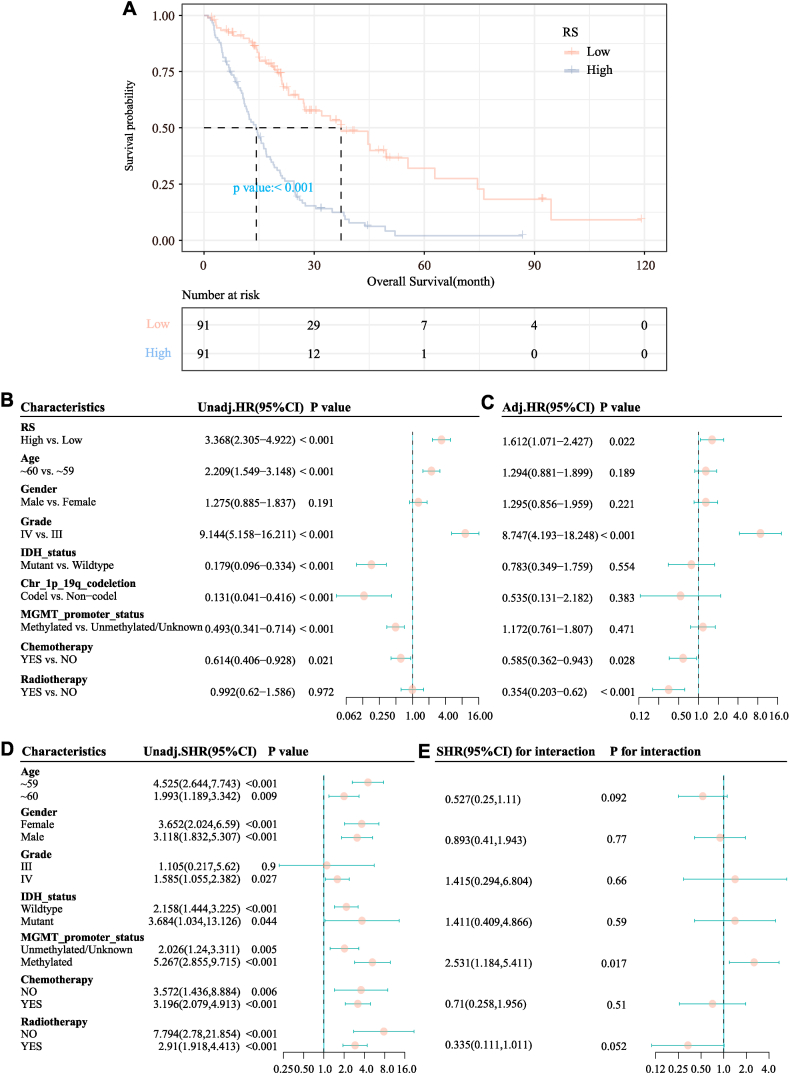
Materials and methods: In this study, we collected the pathological, clinical, RNA-sequencing, and enhanced MRI data of HGG from TCIA and TCGA databases. We characterized the prognostic value of CSF3. Kaplan-Meier (KM) analysis, univariate and multivariate Cox regression, subgroup analysis, Spearman analysis, and gene set variation analysis enrichment were used to elucidate the prognostic value of the CSF3 gene and the correlation between CSF3 and tumor features. We used CIBERSORT to analyze the correlation between CSF3 and cancer immune infiltrates. Logistic regression (LR) and support vector machine methods (SVM) were used to build the radiomics models for the prognosis prediction of HGG based on the expression of CSF3.
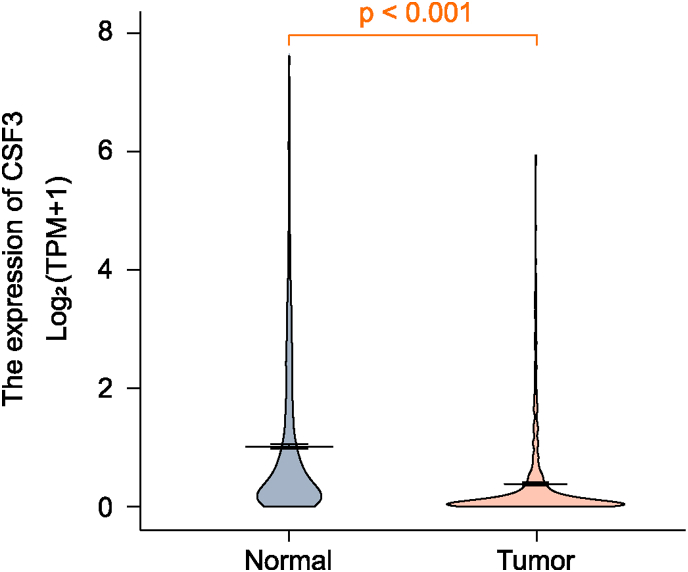
Results: Based on the radiomics score calculated from LR model, 182 patients with HGG from TCGA database were divided into radiomics score (RS) high and low groups. CSF3 expression varied between tumor and normal group tissues. CSF3 expression was found to be a significant risk factor for survival outcomes. A positive association was found between CSF3 expression and immune infiltration. The radiomics model based on both LR and SVM methods showed high clinical practicability.
Conclusion: The results showed that CSF3 has a prognostic value in HGG. The developed radiomics models can predict the expression of CSF3, and further validate the predictions of the radiomics models for HGG.
Keywords: CSF3; High-grade glioma; MRI; Prognosis; Radiomics.
© 2023 The Authors.
Figures
Similar articles
-
Construction of enhanced MRI-based radiomics models using machine learning algorithms for non-invasive prediction of IL7R expression in high-grade gliomas and its prognostic value in clinical practice.J Transl Med. 2025 Mar 31;23(1):383. doi: 10.1186/s12967-025-06402-9. J Transl Med. 2025. PMID: 40165301 Free PMC article.
-
MR-Based Radiomics Predicts CDK6 Expression and Prognostic Value in High-grade Glioma.Acad Radiol. 2024 Dec;31(12):5141-5153. doi: 10.1016/j.acra.2024.06.006. Epub 2024 Jul 4. Acad Radiol. 2024. PMID: 38964985
-
Contrast-Enhanced Computed Tomography Radiomics Predicts Colony-Stimulating Factor 3 Expression and Clinical Prognosis in Ovarian Cancer.Acad Radiol. 2025 Apr;32(4):2053-2063. doi: 10.1016/j.acra.2024.11.023. Epub 2024 Nov 28. Acad Radiol. 2025. PMID: 39609146
-
MRI radiomics based on machine learning in high-grade gliomas as a promising tool for prediction of CD44 expression and overall survival.Sci Rep. 2025 Mar 3;15(1):7433. doi: 10.1038/s41598-025-90128-7. Sci Rep. 2025. PMID: 40032983 Free PMC article.
-
Diagnostic Accuracy of Machine Learning-Based Radiomics in Grading Gliomas: Systematic Review and Meta-Analysis.Contrast Media Mol Imaging. 2020 Dec 18;2020:2127062. doi: 10.1155/2020/2127062. eCollection 2020. Contrast Media Mol Imaging. 2020. PMID: 33746649 Free PMC article.
Cited by
-
Radiomics with structural magnetic resonance imaging, surface morphometry features, neurology scales, and clinical metrics to evaluate the neurodevelopment of preschool children with corrected tetralogy of Fallot.Transl Pediatr. 2024 Sep 30;13(9):1571-1587. doi: 10.21037/tp-24-219. Epub 2024 Sep 26. Transl Pediatr. 2024. PMID: 39399711 Free PMC article.
References
LinkOut - more resources
Full Text Sources
