

An animal crisis caused by pollution, deforestation, and warming in the late 21st century and exacerbation by nuclear war
- PMID: 37095985
- PMCID: PMC10122020
- DOI: 10.1016/j.heliyon.2023.e15221
An animal crisis caused by pollution, deforestation, and warming in the late 21st century and exacerbation by nuclear war
Abstract
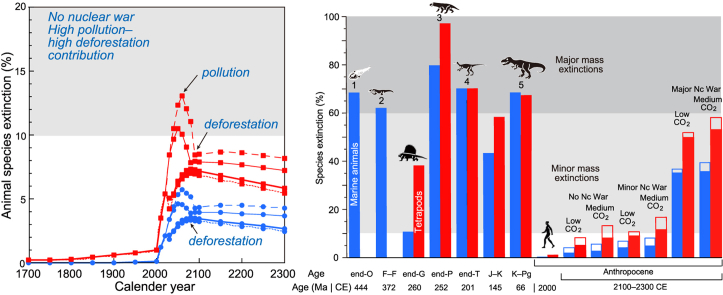
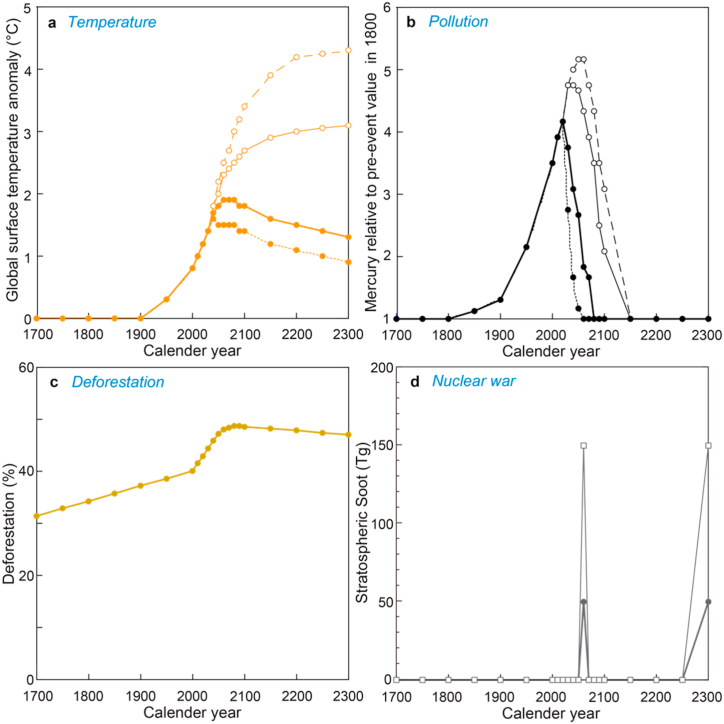
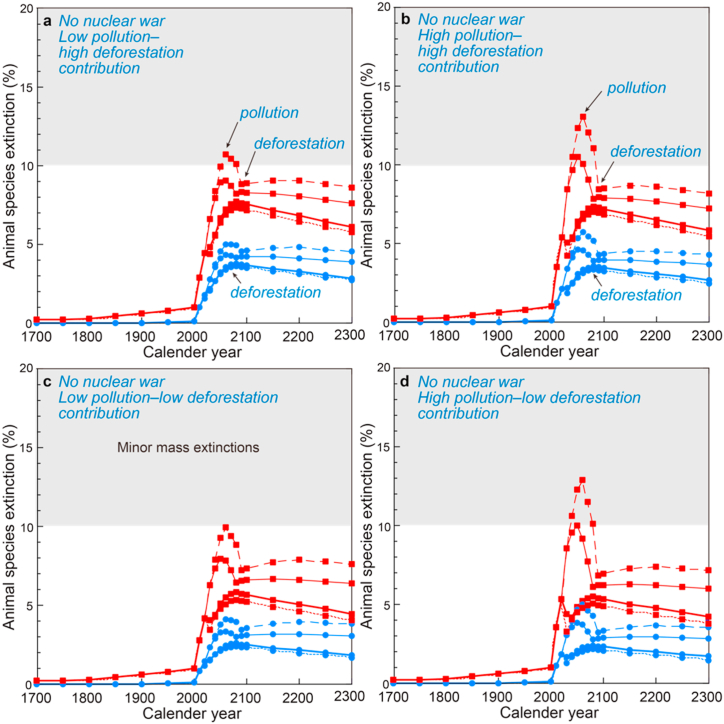
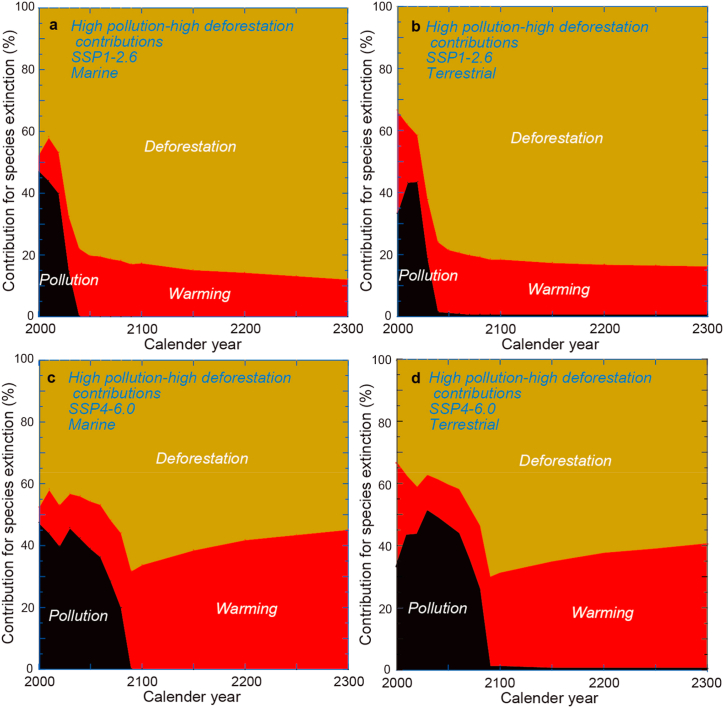
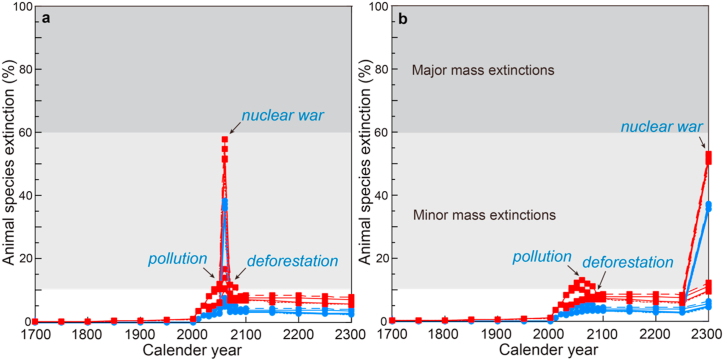
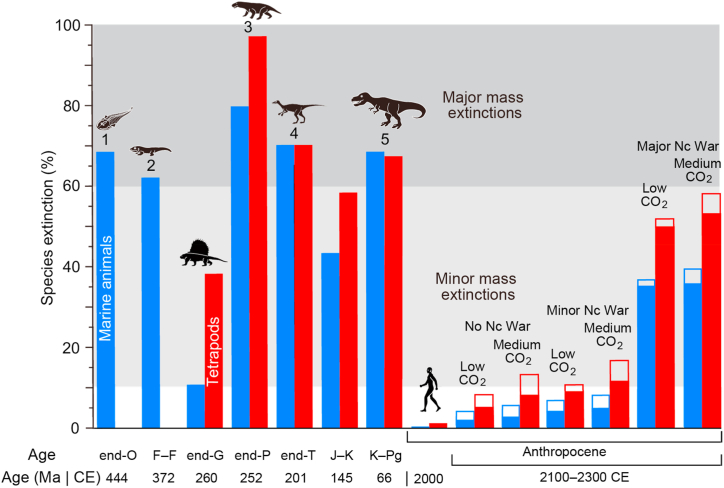
An environmental-animal crisis is currently ongoing and is becoming increasingly severe due to human activity. However, the magnitude, timing, and processes related to this crisis are unclear. This paper clarifies the likely magnitude and timing of animal extinctions and changes in the contribution rates of select causes (global warming, pollution, deforestation, and two hypothetical nuclear conflicts) of animal extinctions during 2000-2300 CE. This paper demonstrates that an animal crisis marked by a 5-13% terrestrial tetrapod species loss and 2-6% marine animal species loss will occur in the next generation during 2060-2080 CE if humans do not engage in nuclear wars. These variations are due to magnitudes of pollution, deforestation, and global warming. The main causes of this crisis will change from pollution and deforestation to deforestation in 2030 under the low CO2 emission scenarios but will change from pollution and deforestation to deforestation in 2070 and then to deforestation and global warming after 2090 under the medium CO2 emissions. A nuclear conflict will increase animal species loss up to approximately 40-70% for terrestrial tetrapod species and 25-50% for marine animal species, including errors. Therefore, this study shows that the animal species conservation priority is to prevent nuclear war, reduce deforestation rates, decrease pollution, and limit global warming, in this order.
Keywords: Anthropocene; Deforestation; Global warming; Mass extinction; Nuclear war; Pollution.
© 2023 The Author.
Conflict of interest statement
The authors declare no conflict of interest.
Figures
Similar articles
-
Extinction magnitude of animals in the near future.Sci Rep. 2022 Nov 23;12(1):19593. doi: 10.1038/s41598-022-23369-5. Sci Rep. 2022. PMID: 36418340 Free PMC article.
-
The Environmental Legacy of Modern Tropical Deforestation.Curr Biol. 2016 Aug 22;26(16):2161-6. doi: 10.1016/j.cub.2016.06.013. Epub 2016 Jul 28. Curr Biol. 2016. PMID: 27476593 Free PMC article.
-
Global warming and extinctions of endemic species from biodiversity hotspots.Conserv Biol. 2006 Apr;20(2):538-48. doi: 10.1111/j.1523-1739.2006.00364.x. Conserv Biol. 2006. PMID: 16903114
-
Prospects for future climate change and the reasons for early action.J Air Waste Manag Assoc. 2008 Jun;58(6):735-86. doi: 10.3155/1047-3289.58.6.735. J Air Waste Manag Assoc. 2008. PMID: 18581807 Review.
-
Causes and health consequences of environmental degradation and social injustice.Soc Sci Med. 2003 Feb;56(3):573-87. doi: 10.1016/s0277-9536(02)00055-2. Soc Sci Med. 2003. PMID: 12570975 Review.
Cited by
-
Role of volcanism and impact heating in mass extinction climate shifts.Sci Rep. 2024 Apr 30;14(1):9946. doi: 10.1038/s41598-024-60467-y. Sci Rep. 2024. PMID: 38688982 Free PMC article.
-
Role of the cathode chamber in microbial electrosynthesis: A comprehensive review of key factors.Eng Microbiol. 2024 Feb 17;4(3):100141. doi: 10.1016/j.engmic.2024.100141. eCollection 2024 Sep. Eng Microbiol. 2024. PMID: 39629110 Free PMC article. Review.
References
-
- Barnosky A.D., Hadly E.A., Gonzalez P., Head J., Polly P.D., Lawing A.M., Eronen J.T., Ackerly D.D., Alex K., Biber E., Blois J., Brashares J., Ceballos G., Davis E., Dietl G.P., Dirzo R., Doremus H., Fortelius M., Greene H.W., Hellmann J., Hickler T., Jackson S.T., Kemp M., Koch P.L., Kremen C., Lindsey E.L., Looy C., Marshall C.R., Mendenhall C., Mulch A., Mychajliw A.M., Nowak C., Ramakrishnan U., Schnitzler J., Das Shrestha K., Solari K., Stegner L., Stegner M.A., Stenseth N.C., Wake M.H., Zhang Z. Has the Earth's sixth mass extinction already arrived? Nature. 2011;471:51–57. doi: 10.1038/nature09678. - DOI - PubMed
-
- Waters C.N., Zalasiewicz J., Summerhayes J., Barnosky A.D., Poirier C., Gałuszka A., Cearreta A., Edgeworth M., Ellis E.C., Ellis M., Jeandel C., Leinfelder R., McNeill J.R., Richter D.deB., Steffen W., Syvitski J., Vidas D., Wagreich M., Williams M., Zhisheng A., Grinevald J., Odada E., Oreskes N., Wolfe A.P. The Anthropocene is functionally and stratigraphically distinct from the Holocene. Science. 2016;351:aad2622. doi: 10.1126/science.aad2622. - DOI - PubMed
Further reading
-
- Bambach R.K. Phanerozoic biodiversity mass extinctions. Annu. Rev. Earth Planet Sci. 2006;34:127–155. doi: 10.1146/annurev.earth.33.092203.122654. - DOI
LinkOut - more resources
Full Text Sources
