

Differentiating glioblastoma from primary central nervous system lymphoma of atypical manifestation using multiparametric magnetic resonance imaging: A comparative study
- PMID: 37095995
- PMCID: PMC10121909
- DOI: 10.1016/j.heliyon.2023.e15150
Differentiating glioblastoma from primary central nervous system lymphoma of atypical manifestation using multiparametric magnetic resonance imaging: A comparative study
Abstract
Background: The aim of this study is to evaluate the diagnostic efficiency of magnetic resonance imaging (MRI) of single parameters, unimodality, and bimodality in distinguishing glioblastoma (GBM) from atypical primary central nervous system lymphoma (PCNSL) based on diffusion-weighted imaging (DWI), dynamic susceptibility contrast (DSC) enhancement, diffusion tensor imaging (DTI), and proton magnetic resonance spectroscopy (1H-MRS) findings.
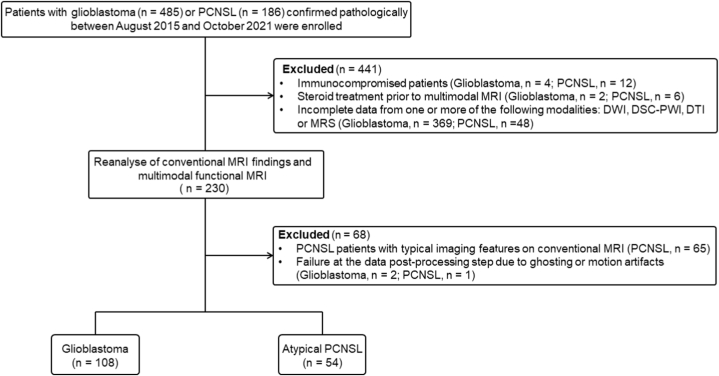
Methods: The cohort included 108 patients pathologically diagnosed with GBM and 54 patients pathologically diagnosed with PCNSL. Pretreatment morphological MRI, DWI, DSC, DTI and MRS were all performed on each patient. The quantitative parameters of multimodal MRI were measured and compared between the patients in the GBM and atypical PCNSL groups, and those parameters showing a significant difference (p < 0.05) between patients in the GBM and atypical PCNSL groups were used to develop one-parameters, unimodality, and bimodality models. We evaluated the efficiency of different models in distinguishing GBM from atypical PCNSL by performing receiver operating characteristic analysis (ROC).
Results: Atypical PCNSL had lower minimum apparent diffusion coefficient (ADCmin), mean ADC (ADCmean), relative ADC (rADC), mean relative cerebral blood volume (rCBVmean), maximum rCBV (rCBVmax), fractional anisotropy (FA), axial diffusion coefficient (DA) and radial diffusion coefficient (DR) values and higher choline/creatine (Cho/Cr) and lipid/creatine (Lip/Cr) ratios than GBM (all p < 0.05). The rCBVmax, DTI and DSC + DTI data were optimal models of single-parameter, unimodality and bimodality for differentiation of GBM from atypical PCNSL, yielding areas under the curves (AUCs) of 0.905, 0.954, and 0.992, respectively.
Conclusions: Models of single-parameter, unimodality and bimodality based on muti multiparameter functional MRI may help to discriminate GBM from atypical PCNSL.
Keywords: Advanced MR Imaging; Atypical primary central nervous system lymphomas; Diffusion tensor imaging; Glioblastoma; Multiparametric MRI.
© 2023 The Authors.
Conflict of interest statement
The authors declare no competing interests.
Figures


Similar articles
-
Distinguishing Tumor Recurrence From Radiation Necrosis in Treated Glioblastoma Using Multiparametric MRI.Acad Radiol. 2022 Sep;29(9):1320-1331. doi: 10.1016/j.acra.2021.11.008. Epub 2021 Dec 9. Acad Radiol. 2022. PMID: 34896001
-
Multiparametric imaging-based differentiation of lymphoma and glioblastoma: using T1-perfusion, diffusion, and susceptibility-weighted MRI.Clin Radiol. 2018 Nov;73(11):986.e7-986.e15. doi: 10.1016/j.crad.2018.07.107. Epub 2018 Sep 7. Clin Radiol. 2018. PMID: 30197047
-
Primary central nervous system lymphoma and atypical glioblastoma: differentiation using the initial area under the curve derived from dynamic contrast-enhanced MR and the apparent diffusion coefficient.Eur Radiol. 2017 Apr;27(4):1344-1351. doi: 10.1007/s00330-016-4484-2. Epub 2016 Jul 19. Eur Radiol. 2017. PMID: 27436023
-
MRI as a diagnostic biomarker for differentiating primary central nervous system lymphoma from glioblastoma: A systematic review and meta-analysis.J Magn Reson Imaging. 2019 Aug;50(2):560-572. doi: 10.1002/jmri.26602. Epub 2019 Jan 14. J Magn Reson Imaging. 2019. PMID: 30637843
-
Imaging biomarkers guided anti-angiogenic therapy for malignant gliomas.Neuroimage Clin. 2018 Jul 5;20:51-60. doi: 10.1016/j.nicl.2018.07.001. eCollection 2018. Neuroimage Clin. 2018. PMID: 30069427 Free PMC article. Review.
Cited by
-
CNS Involvement of DLBCL Presenting with an Unusual Non-Enhancing Infiltrative Mass.Diagnostics (Basel). 2023 Nov 10;13(22):3424. doi: 10.3390/diagnostics13223424. Diagnostics (Basel). 2023. PMID: 37998560 Free PMC article.
-
Multiparametric MRI for differential diagnosis of primary central nervous system lymphoma and atypical glioblastoma: an analysis incorporating DWI, DCE-MRI, and contrast agent preload DSC-PWI.BMC Med Imaging. 2025 Aug 25;25(1):345. doi: 10.1186/s12880-025-01886-9. BMC Med Imaging. 2025. PMID: 40855487 Free PMC article.
-
Differentiation of glioblastoma and primary central nervous system lymphomas using multiparametric diffusion and perfusion magnetic resonance imaging.Biomed Rep. 2023 Sep 22;19(5):82. doi: 10.3892/br.2023.1664. eCollection 2023 Nov. Biomed Rep. 2023. PMID: 37881606 Free PMC article.
-
Multicenter investigation of preoperative distinction between primary central nervous system lymphomas and glioblastomas through interpretable artificial intelligence models.Neuroradiology. 2024 Nov;66(11):1893-1906. doi: 10.1007/s00234-024-03451-7. Epub 2024 Sep 3. Neuroradiology. 2024. PMID: 39225815
References
-
- Miller K.D., Ostrom Q.T., Kruchko C., Patil N., Tihan T., Cioffi G., Fuchs H.E., Waite K.A., Jemal A., Siegel R.L., Barnholtz-Sloan J.S. Brain and other central nervous system tumor statistics. CA Canc. J. Clin. 2021;71(5):381–406. - PubMed
-
- Stupp R., Mason W.P., van den Bent M.J., Weller M., Fisher B., Taphoorn M.J., Belanger K., Brandes A.A., Marosi C., Bogdahn U., Curschmann J., Janzer R.C., Ludwin S.K., Gorlia T., Allgeier A., Lacombe D., Cairncross J.G., Eisenhauer E., Mirimanoff R.O. European organisation for research, treatment of cancer brain tumor, radiotherapy groups, national cancer institute of Canada clinical trials group, radiotherapy plus concomitant and adjuvant temozolomide for glioblastoma. N. Engl. J. Med. 2005;352(10):987–996. - PubMed
-
- Kickingereder P., Wiestler B., Sahm F., Heiland S., Roethke M., Schlemmer H.P., Wick W., Bendszus M., Radbruch A. Primary central nervous system lymphoma and atypical glioblastoma: multiparametric differentiation by using diffusion-, perfusion-, and susceptibility-weighted MR imaging. Radiology. 2014;272(3):843–850. - PubMed
-
- Xiao X., Liu X., Liang W., Han L.Y., Li X.D., Guo L.J., He W.L., Liu X.M., Zhou J., Cai Q., Xu Y.K., Tan X.L., Wu Y.K. Conventional MRI features of central nervous system embryonal tumor, not otherwise specified in adults: comparison with glioblastoma. Acad. Radiol. 2022;29(Suppl 3):S44–S51. - PubMed
LinkOut - more resources
Full Text Sources
