. 2023 Mar 23;26(4):106483.
doi: 10.1016/j.isci.2023.106483. eCollection 2023 Apr 21.

Gram-positive anaerobic cocci guard skin homeostasis by regulating host-defense mechanisms

Affiliations

Gram-positive anaerobic cocci guard skin homeostasis by regulating host-defense mechanisms

Danique A van der Krieken et al. iScience. .

Abstract

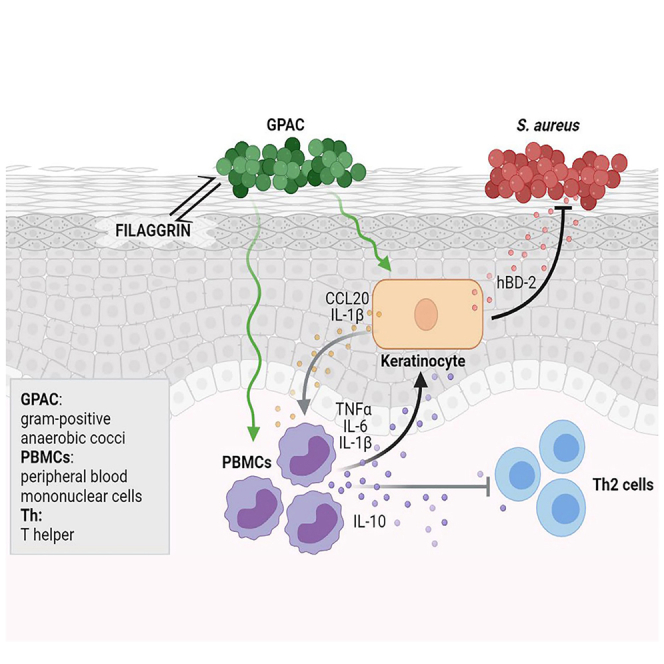
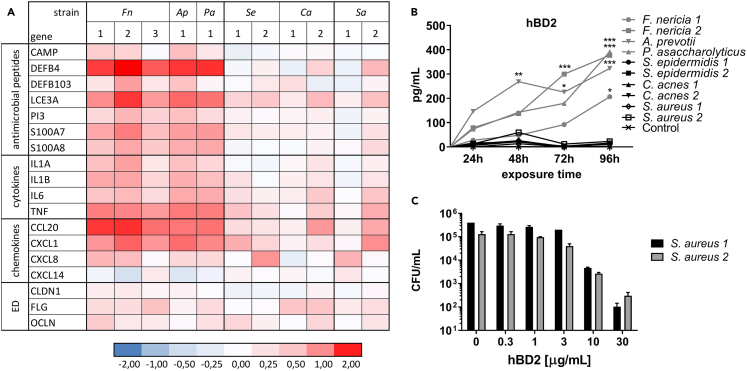
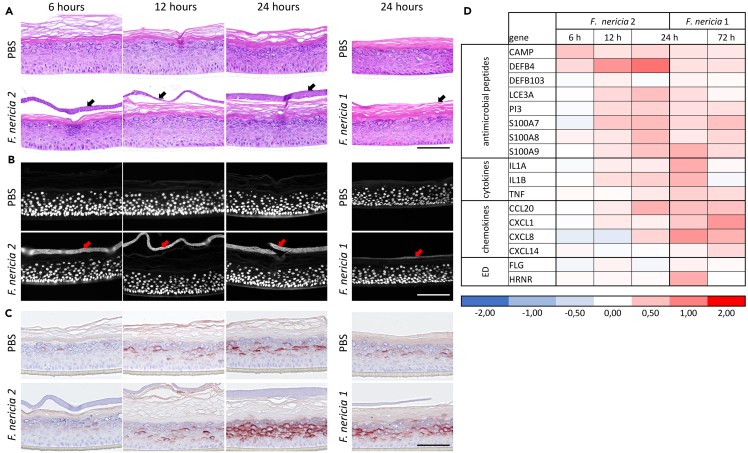
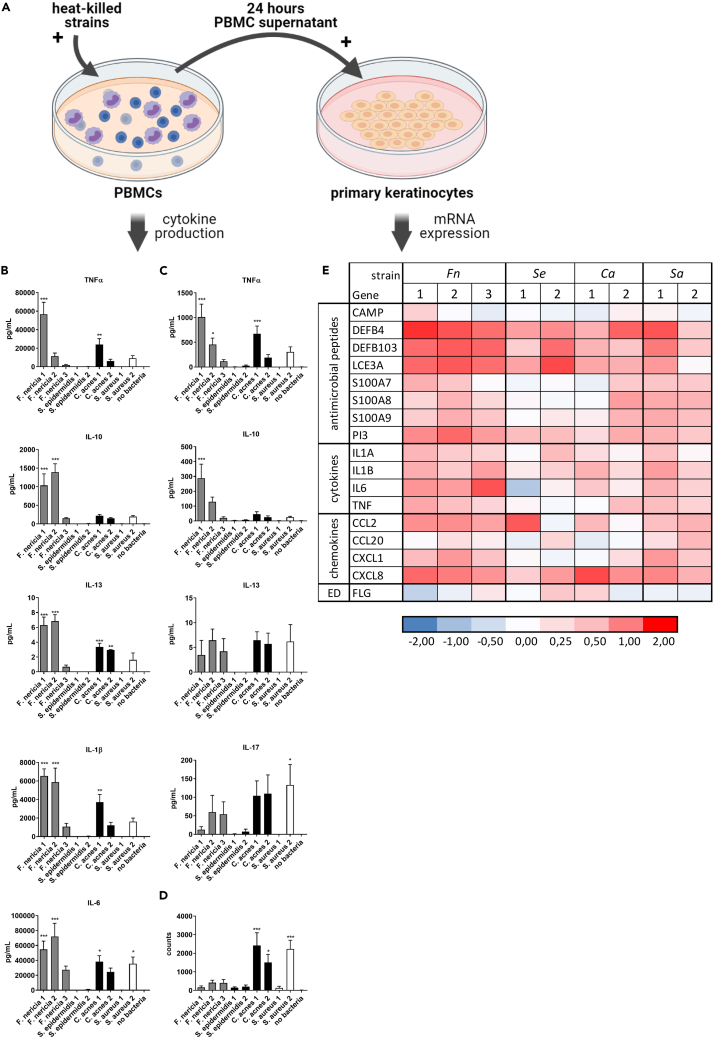
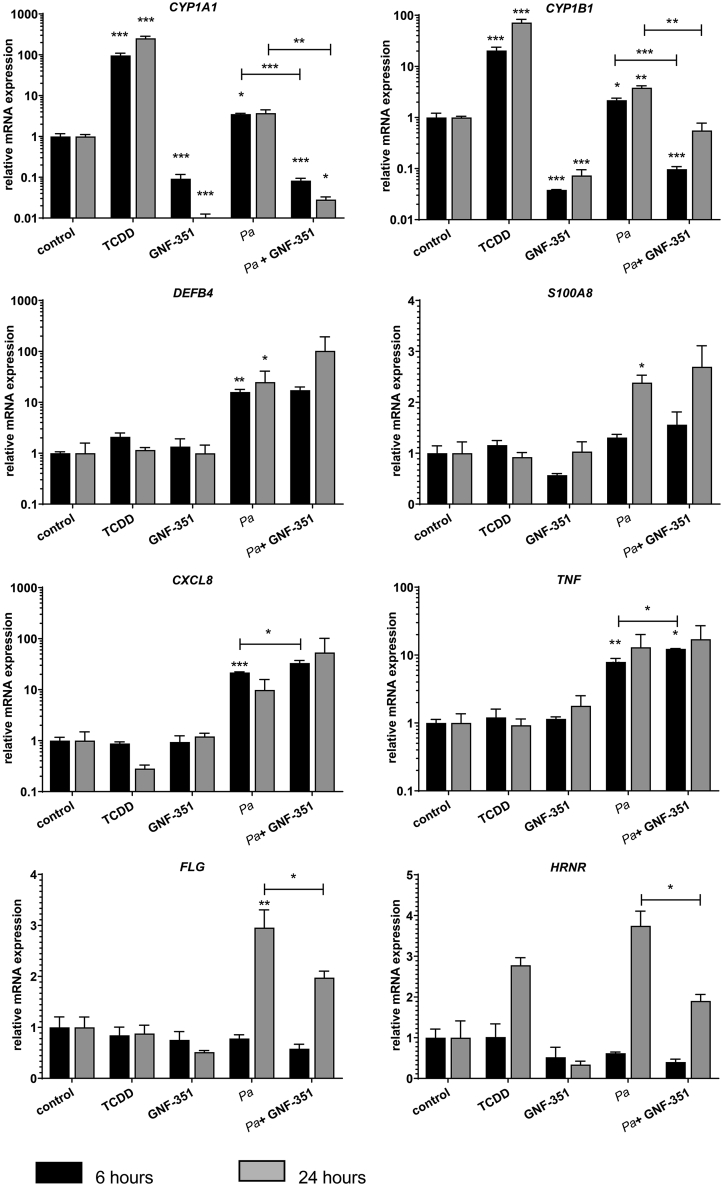
In atopic dermatitis (AD), chronic skin inflammation is associated with skin barrier defects and skin microbiome dysbiosis including a lower abundance of Gram-positive anaerobic cocci (GPACs). We here report that, through secreted soluble factors, GPAC rapidly and directly induced epidermal host-defense molecules in cultured human keratinocytes and indirectly via immune-cell activation and cytokines derived thereof. Host-derived antimicrobial peptides known to limit the growth of Staphylococcus aureus-a skin pathogen involved in AD pathology-were strongly upregulated by GPAC-induced signaling through aryl hydrocarbon receptor (AHR)-independent mechanisms, with a concomitant AHR-dependent induction of epidermal differentiation genes and control of pro-inflammatory gene expression in organotypic human epidermis. By these modes of operandi, GPAC may act as an "alarm signal" and protect the skin from pathogenic colonization and infection in the event of skin barrier disruption. Fostering growth or survival of GPAC may be starting point for microbiome-targeted therapeutics in AD.

Keywords: Dermatology; Microbiology; microbiome.


Conflict of interest statement

The authors declare no competing interests.

Figures

None
Graphical abstract
Figure 1
Figure 1
Flowchart of experimental content In this manuscript we studied the possible role of GPAC in AD pathogenesis by analyzing the effects of GPAC on human primary keratinocyte monolayer cultures, 3D epidermal equivalents, and peripheral blood mononuclear cells (PBMCs), which were stimulated with a broad panel of live and heat-killed skin bacteria. (A) Readout parameters for microbe-microbe interactions are growth, virulence, and biofilm formation. (B and C) For microbe-keratinocyte interactions, cytokine and antimicrobial protein (AMP) production, keratinocyte differentiation, and AHR signaling is measured. (D and E) Readout parameters for interactions between PBMC and microbes are proliferation status of the immune cells and cytokine production, the latter again being tested for their effect on keratinocytes. All interaction studies (A–E) are described in more detail in Figure 2.
Figure 2
Figure 2
Flow chart of experimental procedures This scheme shows which interactions and biological effects have been studied and which techniques and stimuli have been used. A–E relate to the arrows in the flowchart of Figure 1, with the dedicated figure number of the experimental results listed below the boxes in the left row.
Figure 3
Figure 3
Microbe-microbe interaction of GPAC and other commensal strains with S. aureus (A) Growth of S. aureus ATCC strains in the culture supernatant of the bacteria depicted on the corresponding x axis below (gray = GPAC, black = commensals, white = pathogen). Dotted lines represent S. aureus growth in its own culture supernatant and is set to one. N = 3, values represent mean ± SEM. ∗p < 0.05; ∗∗p < 0.01; ∗∗∗p < 0.001. (B) Growth of S. aureus strains on the stratum corneum (SC) model in the presence of other bacterial strains (x axis). Values are the logarithmic reduction or increase in growth compared to S. aureus alone on the model. N = 2, values represent mean ± SEM. ∗p < 0.05; ∗∗p < 0.01; ∗∗∗p < 0.001. (C) Biofilm formation by S. aureus strains in the presence of heat-killed (HK) bacteria. Dotted line represents biofilm formation of S. aureus without the presence of other bacteria and is set to one. N = 4, values represent mean ± SEM. ∗∗p < 0.01; ∗∗∗p < 0.001. (D) Hemolysis by S. aureus 2 in the presence of F. nericia 1 (middle) and S. epidermidis 1 (bottom). Red open arrow indicates the absence of a hemolytic band when S. aureus bacteria are cultured together with S. epidermidis, whereas F. nericia bacteria did not inhibit the hemolysis by S. aureus. Images are representative of two separate experiments.
Figure 4
Figure 4
Keratinocyte response to GPAC and the subsequent effect on S.aureus growth (A) Visualization of relative mRNA expression in primary keratinocytes induced by heat-killed (HK) GPAC, S. epidermis, C. acnes, and S. aureus strains after 24 h of exposure. Mean fold change (log10) values of N = 5 keratinocyte donors (for ΔCt and p values see Table S3). Red indicates upregulation and blue downregulation compared to control samples. Fn = F. nericia, Ap = A. prevotii, Pa = P. asaccharolyticus, Se = S. epidermidis, Ca = C. acnes, Sa= S. aureus. ED = Epidermal differentiation genes. (B) Human beta-defensin (hBD2) protein production by keratinocytes after exposure to HK bacteria (106 CFU). Values represent mean of 3 keratinocyte donors,∗p < 0.05, ∗∗p < 0.01 and ∗∗∗p < 0.001. (C) S. aureus strains were exposed to different concentrations hBD2 in phosphate buffer pH7.4 for 2 h. Values represent mean ± SEM CFU/mL of 3 replicates. See also Figure S1 and corresponding Tables S3 and S4.
Figure 5
Figure 5
GPACs induce an antimicrobial peptide response in human epidermal equivalents HEEs were colonized for 6, 12, and 24 h with F. nericia. (A) Hematoxylin & Eosin-stained sections. Scale bar = 100 μm. (B) DAPI-stained sections. Scale bar = 100 μm. (C) Immunohistochemical staining for SKALP protein expression. Each time point and F. nericia strain has a corresponding control with no bacteria present (only PBS). Arrows indicate F. nericia presence on top of the SC. Scale bar = 100 μm. (D) Visualization of relative mRNA expression in HEE induced by two live F. nericia strains after different exposure times. Mean fold change (log10) values of N = 3 keratinocyte donors (for ΔCt and p values see Table S5). Red indicates upregulation and blue downregulation compared to control samples. ED = Epidermal differentiation genes. See also Figure S3.
Figure 6
Figure 6
Heat-killed Finegoldia spp. induce a cytokine response in PBMC leading to a host response in keratinocytes (A) Experimental design. (B) Cytokine production by PBMC for TNFα, IL-1β, IL-6, IL-10, and IL-13 after 24 h of exposure to 104 heat-killed (HK) bacteria as depicted on the x axis. Data represent mean ± SEM. ∗p < 0.05, ∗∗p < 0.01 and ∗∗∗p < 0.001. (C) Cytokine production by PBMC for TNFα, IL-10, IL-13, and IL-17 after 5 days of exposure to 104 HK bacteria as depicted on the x axis (gray = GPAC, black = commensals, white = pathogen). Data represent mean ± SEM. ∗p < 0.05 and ∗∗∗p < 0.001. (D) Proliferation of PBMC after 5 days of stimulation with 104 HK bacteria measured by 3H-thymidine incorporation assay. Values represent mean ± SEM of N = 5 PBMC donors. Data represent mean ± SEM. ∗p < 0.05 and ∗∗∗p < 0.001. (E) Visualization of relative mRNA expression of primary keratinocytes induced by the supernatant of PBMCs that were exposed to HK bacterial strains after 48 h. Mean fold change (log10) values of N = 3 keratinocyte donors (for ΔCt and p values see Table S6). Red indicates upregulation and blue downregulation compared to control samples (no stimulus). Fn = F. nericia, Se = S. epidermidis, Ca = C. acnes, Sa= S. aureus. ED = Epidermal differentiation genes.
Figure 7
Figure 7
AHR dependency of P. asaccharolyticus (Pa)-induced gene expression HEEs are co-stimulated with the AHR antagonist GNF-351 and P. asaccharolyticus heat-killed lysate. RT-qPCR data represent fold differences in mRNA expression of unstimulated (control) and stimulated HEE (N = 3) regarding AHR target genes (CYP1A1, CYP1B1), AMPs (DEFB4, S100A8), pro-inflammatory genes (CXCL8, TNF), and epidermal differentiation marker genes (FLG, HRNR). Data represent mean ± SEM. p values of one-way ANOVA statistical analysis are indicated with ∗p < 0.05, ∗∗p < 0.01, and ∗∗∗p < 0.001. Experimental conditions are compared to control or otherwise indicated by the separate underlined asterisk. See also Figure S4.

Similar articles

Cited by

References

    1. Bin L., Leung D.Y.M. Genetic and epigenetic studies of atopic dermatitis. Allergy Asthma Clin. Immunol. 2016;12:52. doi: 10.1186/s13223-016-0158-5. - DOI - PMC - PubMed
    1. Otsuka A., Nomura T., Rerknimitr P., Seidel J.A., Honda T., Kabashima K. The interplay between genetic and environmental factors in the pathogenesis of atopic dermatitis. Immunol. Rev. 2017;278:246–262. doi: 10.1111/imr.12545. - DOI - PubMed
    1. Clausen M.-L., Agner T., Lilje B., Edslev S.M., Johannesen T.B., Andersen P.S. Association of disease severity with skin microbiome and filaggrin. JAMA Dermatol. 2018;154:293–300. doi: 10.1001/jamadermatol.2017.5440. - DOI - PMC - PubMed
    1. Kobayashi T., Glatz M., Horiuchi K., Kawasaki H., Akiyama H., Kaplan D.H., Kong H.H., Amagai M., Nagao K. Dysbiosis and Staphylococcus aureus colonization drives inflammation in atopic dermatitis. Immunity. 2015;42:756–766. doi: 10.1016/j.immuni.2015.03.014. - DOI - PMC - PubMed
    1. Altunbulakli C., Reiger M., Neumann A.U., Garzorz-Stark N., Fleming M., Huelpuesch C., Castro-Giner F., Eyerich K., Akdis C.A., Traidl-Hoffmann C. Relations between epidermal barrier dysregulation and Staphylococcus species–dominated microbiome dysbiosis in patients with atopic dermatitis. J. Allergy Clin. Immunol. 2018;142:1643–1647.e12. doi: 10.1016/j.jaci.2018.07.005. - DOI - PubMed

LinkOut - more resources