. 2023 Mar 23;26(4):106487.
doi: 10.1016/j.isci.2023.106487. eCollection 2023 Apr 21.

Adeno-associated virus vector system controlling capsid expression improves viral quantity and quality

Affiliations

Adeno-associated virus vector system controlling capsid expression improves viral quantity and quality

Kenji Ohba et al. iScience. .

Abstract

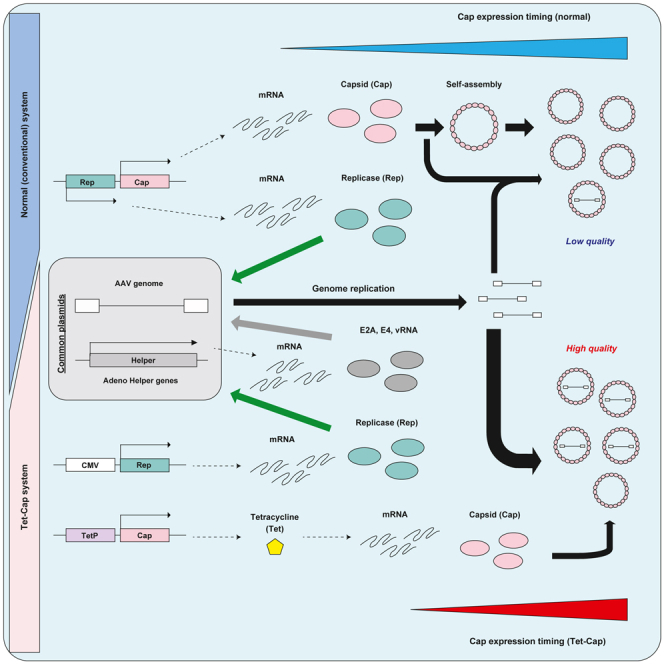
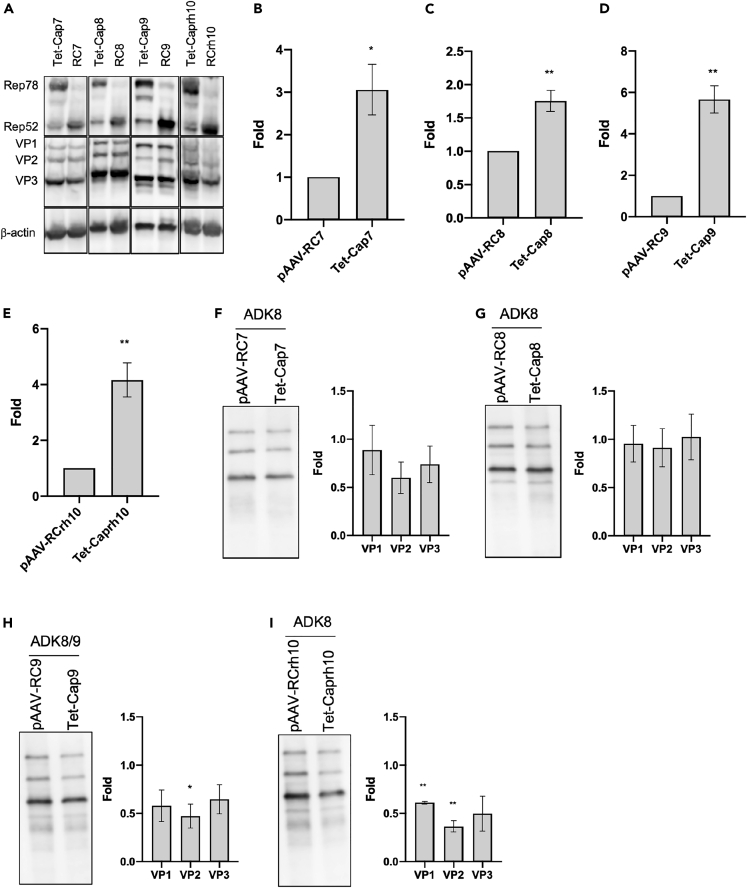
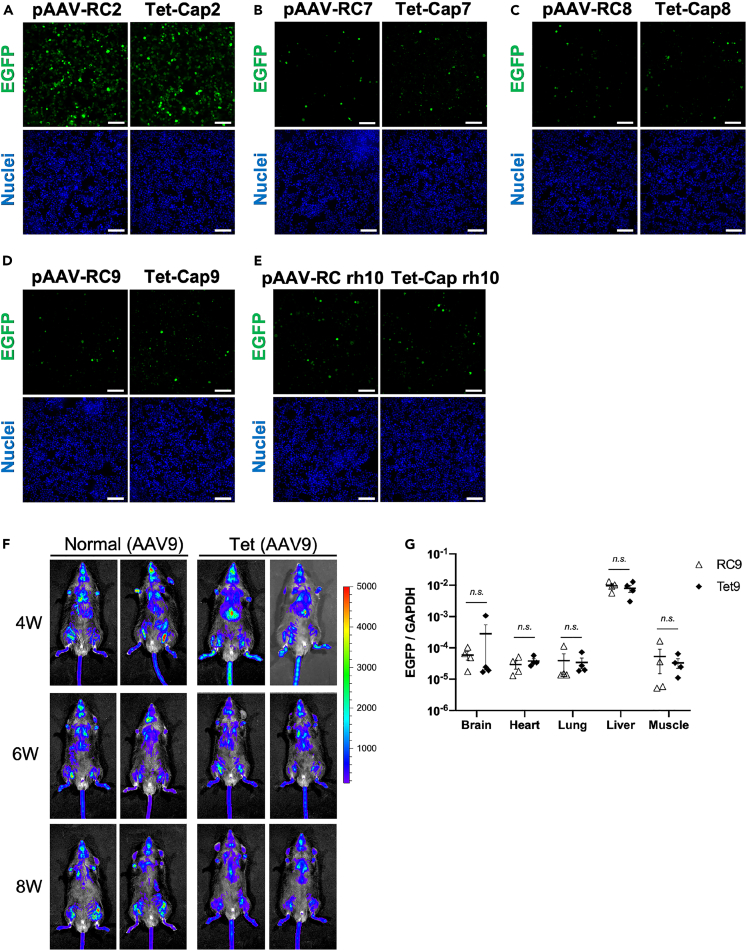
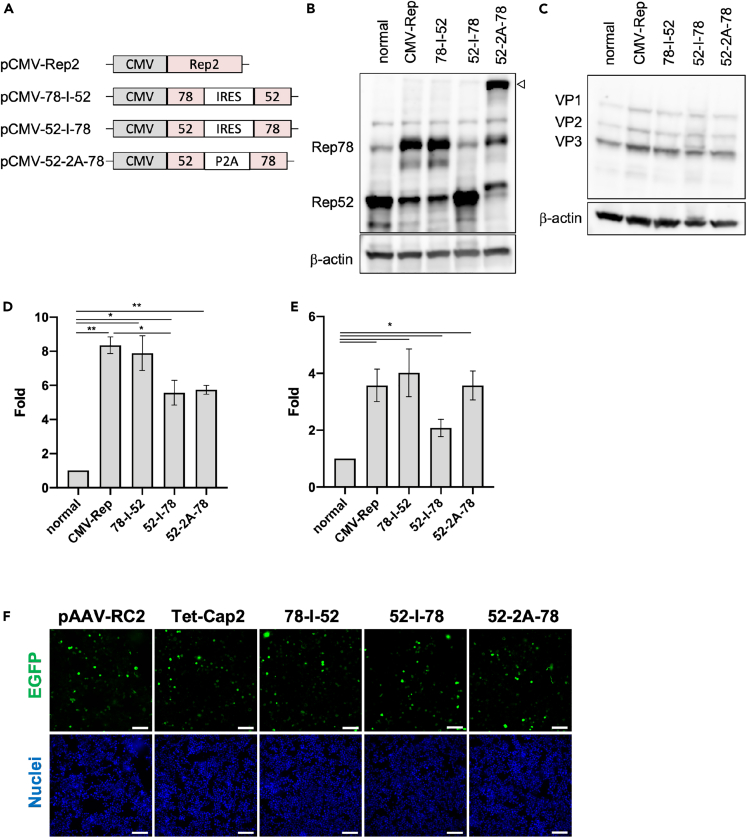
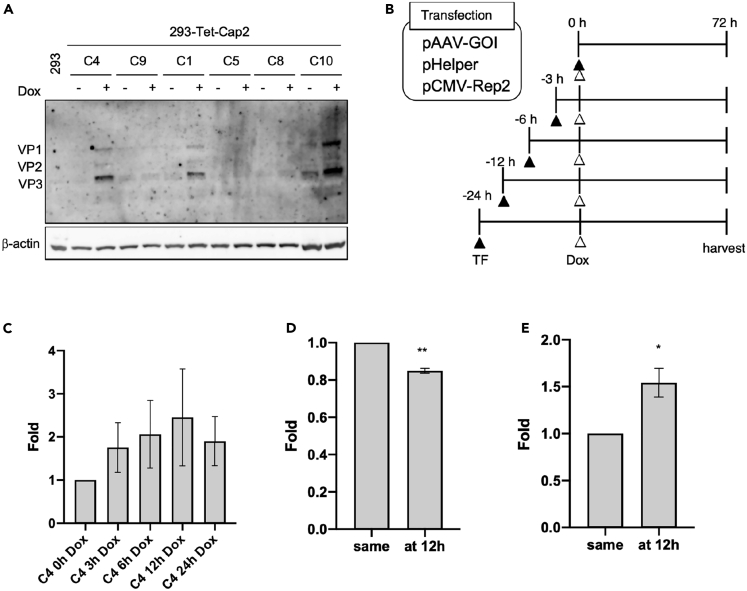
Adeno-associated virus (AAV) vectors are promising tools for gene therapy. The current AAV vector system produces an abundance of empty capsids that are eliminated before clinical use, leading to increased costs for gene therapy. In the present study, we established an AAV production system that regulates the timing of capsid expression using a tetracycline-dependent promoter. Tetracycline-regulating capsid expression increased viral yield and reduced empty capsids in various serotypes without altering AAV vector infectivity in vitro and in vivo. The replicase expression pattern change observed in the developed AAV vector system improved viral quantity and quality, whereas timing control of capsid expression reduced empty capsids. These findings provide a new perspective on the development of AAV vector production systems in gene therapy.

Keywords: Biotechnology; Virology.


Conflict of interest statement

T.E. and J.M. are the operating officer and director, respectively, and have treasury stocks in Takara Bio Inc. This work was partly funded by a Joint Research Fund sponsored by Takara Bio Inc. K.O. 1 and TAKARA bio Inc. have applied for the international patent based on present study. 1Kenji Ohba.

Figures

None
Graphical abstract
Figure 1
Figure 1
Split expression of replicase and capsid does not improve AAV vector production (A) Western blot of replicase (Rep) proteins in HEK293 cells. Rep and β-actin proteins were detected using anti-Rep and anti-β-actin antibodies, respectively. Helper = pHelper plasmid containing adenovirus genes; RC2 = pAAV-RC2; CMV-Rep2 = pCMV-Rep2. (B) Western blot of capsid (Cap) proteins in HEK293 cells. Cap and β-actin proteins were detected using anti-Cap and anti-β-actin antibodies, respectively. CMV-Cap2 = pCMV-Cap2. (C) Dose-dependency of Rep expression in HEK293 cells. Rep and β-actin proteins were detected using anti-Rep and anti-β-actin antibodies, respectively. White and black triangles indicate non-specific and specific bands, respectively. (D) Dose-dependency of Cap expression in HEK293 cells. Cap and β-actin proteins were detected using anti-Cap and anti-β-actin antibodies, respectively. (E and F) Adeno-associated virus (AAV) vector yield using the split Rep and Cap expression system. (E) Amount of AAV vector in solution (vg/μL). vg = vector genome. (F) Fold differences in AAV vector yield among various Cap doses. Data were calculated from three independent experiments and normalized with the value of the normal control (RC2). The normal vector is the conventional AAV vector system using pAAV-RC2. Letters and asterisks in the panel indicate the following: n.s. = not significant, ∗ = p< 0.05, ∗∗ = p< 0.01. Error bars indicate the standard error of the mean.
Figure 2
Figure 2
Control of Cap expression timing increases total AAV vector yield (A) Diagram of adeno-associated virus (AAV) vector constructs. CMV = CMV promoter; Tet = tetracycline-dependent promoter; Rep2 = AAV2 replicase (Rep) gene; Cap2 = AAV2 capsid (Cap) gene. (B) Western blot for Cap expression of the Tet-Cap2 construct in HEK293 cells. Cap and β-actin proteins were detected using anti-Cap and anti-β-actin antibodies, respectively. Dox = doxycycline (derivative of Tet). (C) Time schedule for AAV vector production using the normal control (RC2) and Tet-Cap2 systems. GOI = gene of interest; emp = empty. (D-G) AAV vector yield of the Tet-Cap2 system. (D and E) AAV vector yield in solution (vg/μL) during Rep 0.1 or 0.5 μg-transfection with a change in medium and Dox stimulation at 12 h after transfection. (F and G) Fold differences in AAV vector yield during Rep 0.1 μg or 0.5 μg-transfection with a change in medium and Dox stimulation for the Tet-Cap2 system. Data were normalized with the measurements of RC2. (H) Western blot of Cap expression during AAV vector production in HEK293 cells. Cap and β-actin proteins were detected using anti-Cap and anti-β-actin antibodies, respectively. Experiments were independently performed at least three times for statistical analysis. Asterisks in the panel indicate the following: ∗ = p< 0.05, ∗∗ = p< 0.01. Error bars indicate the standard error of the mean.
Figure 3
Figure 3
Control of Cap expression timing improves the full/empty particle ratio (A) Western blot of capsid (Cap) proteins after immunoprecipitation. The same titer of adeno-associated virus (AAV) vector (2 × 108 vg/sample) calculated using qPCR was subjected to immunoprecipitation using A20 antibodies and protein A and G (A/G) magnetic beads before western blotting. Cap proteins were detected using anti-Cap antibodies. (B–D) Differences in Cap protein band intensities after immunoprecipitation. (B and C) Differences in individual band intensities for VP1, VP2, and VP3 after transfection with 0.1 μg (B) and 0.5 μg (C) replicase (Rep). (D) Differences in band intensity after averaging that of VP1, VP2, and VP3. (E and F) Fold differences of Cap proteins measured with ELISA between the normal control (RC2) and Tet-Cap2 systems during Rep transfection, a change in medium, and doxycycline (Dox) stimulation at 6 h (E) and 12 h (F) after transfection. Data were normalized with the value measured for RC2. (G and H) Values of qPCR/ELISA corresponding with the full/empty particle (F/E) ratio between RC2 and Tet-Cap2 after Rep transfection, a change in medium, and Dox stimulation at 6 h (G) and 12 h (H) after transfection. Experiments were independently performed at least three times for statistical analysis. Asterisks in the panel indicate the following: ∗ = p< 0.05, ∗∗ = p< 0.01. Error bars indicate the standard error of the mean.
Figure 4
Figure 4
Novel AAV vector production system is applicable for other serotypes (A) Western blot of replicase (Rep) and capsid (Cap) proteins during adeno-associated virus (AAV) vector production for various serotypes in HEK293 cells. Rep, Cap, and β-actin proteins were detected using anti-Rep, anti-Cap, and anti-β-actin antibodies, respectively. (B–E) AAV vector yield in various serotypes for the Tet-Cap system. Fold difference of AAV vector yield in AAV7 (B), AAV8 (C), AAV9 (D), and AAVrh10 (E) after a change in medium and doxycycline stimulation at 12 h after transfection. Data were normalized with the value of the normal control (RC) samples. (F–I) Western blot of Cap proteins after immunoprecipitation for various serotypes. The same titer of AAV vector (1 × 109–4 × 109 vg/sample) calculated with qPCR was subjected to immunoprecipitation using ADK8 (AAV7, AAV8, and rh10) and ADK8/9 (AAV9) antibodies, as well as protein A/G magnetic beads, before western blotting. The left-hand figures show representative western blotting images, and the right-hand figures the fold difference of band intensities for VP1, VP2, and VP3 proteins between RC and Tet-Cap samples in each panel. These panels indicate the data for AAV7 (F), AAV8 (G), AAV9 (H), and AAVrh10 (I), respectively. Experiments were independently performed at least three times for statistical analysis. Asterisks in each panel indicate the following: ∗ = p< 0.05, ∗∗ = p< 0.01. Error bars indicate the standard error of the mean.
Figure 5
Figure 5
Novel AAV vector production system does not affect viral infectivity in vitro and in vivo (A–E) (A–D) Infectivity data of adeno-associated virus (AAV) vectors for various serotypes in vitro. The 2v6.11 cells were infected with AAV2 (500 vg/cell), AAV7 (1000 vg/cell), AAV8 (1000 vg/cell), AAV9 (1000 vg/cell), and AAVrh10 (1000 vg/cell). Cells were observed at 96 h after infection. Data indicate the infectivity of the AAV vector (EGFP; green) in AAV2 (A), AAV7 (B), AAV8 (C), AAV9 (D), and AAVrh10 (E). The blue signal shows nuclei (Hoechst 33342). White bar shows 100 μm. (F) Data for AAV vector distribution in vivo. C57BL/6 mice were injected with AAV9 vectors carrying an EGFP-P2A-Nluc gene (5 × 1010 vg/mouse) derived from normal control (RC9) and Tet-Cap9 systems through the retro-orbital vein. Luciferase signals were monitored using IVIS-CT after injection of luciferase substrate through the retro-orbital vein at 4, 6, and 8 weeks. Data shows representative mice of RC9 (n = 4) and Tet-Cap9 (n = 4). Bar colors correspond to luciferase signals with a range of 0–5000 photons/s. (G) AAV vector genome detection in indicated organs at 3 weeks after injection. Data were normalized with the AAV vector (EGFP) and mouse genomic GAPDH values. White triangles and black rhombuses indicate data of each mouse for RC9 (n = 4) and Tet-Cap9 (n = 4), respectively. Letters in the panel indicate the following: n.s. = not significant. Error bars indicate the standard error of the mean.
Figure 6
Figure 6
Difference in the Rep78/Rep52 expression ratio improves AAV vector quantity and quality (A) Diagram of various replicase (Rep) constructs. CMV = CMV promoter; Rep2 = full length AAV2 Rep gene; 78 = Rep78 gene; 52 = Rep52 gene; IRES = internal ribosome entry site sequence; P2A = 2A sequence of porcine teschovirus-1. (B) Western blot of Rep proteins using various Rep constructs in HEK293 cells. Rep and β-actin proteins were detected using anti-Rep and anti-β-actin antibodies, respectively. The white triangle shows Rep52-P2A-Rep78 fusion proteins. (C) Western blot of capsid (Cap) proteins during adeno-associated virus (AAV) vector production using various Rep constructs in HEK293 cells. Cap and β-actin proteins were detected using anti-Cap and anti-β-actin antibodies, respectively. (D) AAV vector yields for various Rep expressions. Fold difference in AAV vector yields between the normal control (RC2) and various Rep-transfected groups after a change in medium and doxycycline stimulation at 12 h after transfection. (E) Fold differences in qPCR/ELISA corresponding with the full/empty particle ratio during various Rep expressions. Data were normalized with the value of the RC2 sample to calculate fold difference. (F) Infectivity data for AAV vectors produced using various Rep constructs. The 2v6.11 cells were infected with AAV2 (500 vg/cell) and observed at 96 h after infection. These data indicate infectivity of the AAV vector (EGFP; green) in AAV2 produced using various Rep transfections. The blue signal shows nuclei (Hoechst 33342). White bar shows 100 μm. Experiments were independently performed at least three times for statistical analysis. Asterisks in each panel indicate the following: ∗ = p< 0.05, ∗∗ = p< 0.01. Error bars indicate the standard error of the mean.
Figure 7
Figure 7
Control of Cap expression timing mainly improves AAV vector quality (A) Establishment of HEK293 cells carrying the Tet-Cap2 gene cassette. Clones were lysed and subjected to western blotting. Capsid (Cap) and β-actin proteins were detected using anti-Cap and anti-β-actin antibodies, respectively. Letters above data indicate the clone number and doxycycline (Dox). (B) Scheme of transfection and Dox stimulation. TF = transfection. (C) Fold differences in AAV vector yield at indicated Dox stimulation timing after transfection in the HEK293 cells carrying the Tet-Cap2 gene cassette. Data were normalized with measurements from the 0 h Dox stimulation sample. (D) Fold differences in Cap proteins using ELISA analysis after stimulation of Cap expression at 12 h in clones. Data were normalized with the measurement at 0 h (same = at the same time of transfection). Dox stimulation sample shows the average of three different clones (C1, C4, and C10). (E) Fold difference in qPCR/ELISA corresponding with the full/empty particle ratio in clones. Data were normalized with the value measured at 0 h. Dox stimulation sample shows the average of three different clones. Experiments were independently performed at least three times for statistical analysis. Asterisks in each panel indicate the following: ∗ = p< 0.05, ∗∗ = p< 0.01. Error bars indicate the standard error of the mean.

Similar articles

Cited by

References

    1. Kuzmin D.A., Shutova M.V., Johnston N.R., Smith O.P., Fedorin V.V., Kukushkin Y.S., van der Loo J.C.M., Johnstone E.C. The clinical landscape for AAV gene therapies. Nat. Rev. Drug Discov. 2021;20:173–174. doi: 10.1038/d41573-021-00017-7. - DOI - PubMed
    1. Mendell J.R., Al-Zaidy S.A., Rodino-Klapac L.R., Goodspeed K., Gray S.J., Kay C.N., Boye S.L., Boye S.E., George L.A., Salabarria S., et al. Current clinical applications of in vivo gene therapy with AAVs. Mol. Ther. 2021;29:464–488. doi: 10.1016/j.ymthe.2020.12.007. - DOI - PMC - PubMed
    1. Batty P., Lillicrap D. Advances and challenges for hemophilia gene therapy. Hum. Mol. Genet. 2019;28:R95–R101. doi: 10.1093/hmg/ddz157. - DOI - PubMed
    1. Crudele J.M., Chamberlain J.S. AAV-based gene therapies for the muscular dystrophies. Hum. Mol. Genet. 2019;28:R102–R107. doi: 10.1093/hmg/ddz128. - DOI - PMC - PubMed
    1. Lugin M.L., Lee R.T., Kwon Y.J. Synthetically engineered adeno-associated virus for efficient, safe, and versatile gene therapy applications. ACS Nano. 2020;14:14262–14283. doi: 10.1021/acsnano.0c03850. - DOI - PubMed