. 2023 Mar 22;26(4):106465.
doi: 10.1016/j.isci.2023.106465. eCollection 2023 Apr 21.

Premature termination of transcription is shaped by Rho and translated uORFS in Mycobacterium tuberculosis

Affiliations

Premature termination of transcription is shaped by Rho and translated uORFS in Mycobacterium tuberculosis

Alexandre D'Halluin et al. iScience. .

Abstract

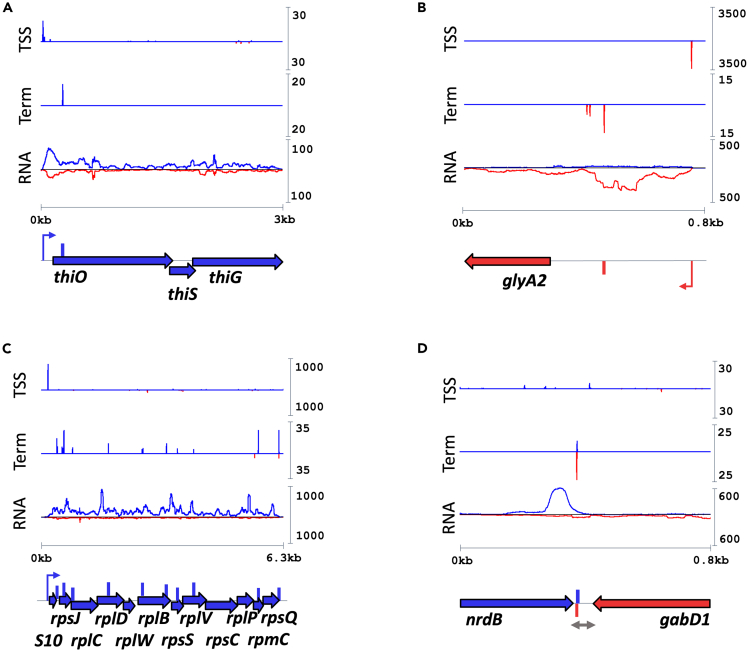
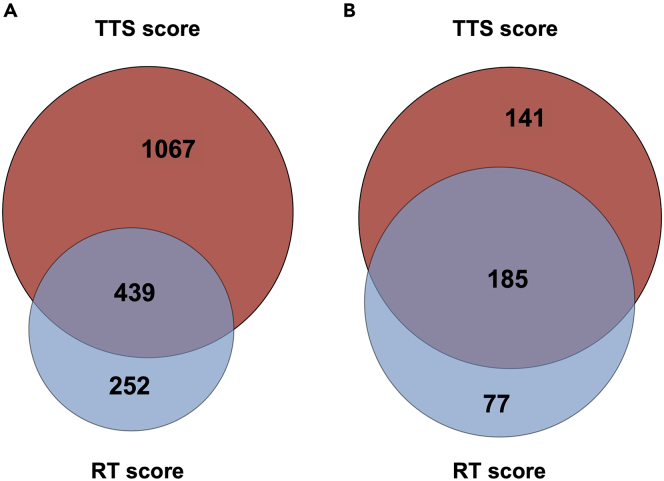
Little is known about the decisions behind transcription elongation versus termination in the human pathogen Mycobacterium tuberculosis (M.TB). By applying Term-seq to M.TB we found that the majority of transcription termination is premature and associated with translated regions, i.e., within previously annotated or newly identified open reading frames. Computational predictions and Term-seq analysis, upon depletion of termination factor Rho, suggests that Rho-dependent transcription termination dominates all transcription termination sites (TTS), including those associated with regulatory 5' leaders. Moreover, our results suggest that tightly coupled translation, in the form of overlapping stop and start codons, may suppress Rho-dependent termination. This study provides detailed insights into novel M.TB cis-regulatory elements, where Rho-dependent, conditional termination of transcription and translational coupling together play major roles in gene expression control. Our findings contribute to a deeper understanding of the fundamental regulatory mechanisms that enable M.TB adaptation to the host environment offering novel potential points of intervention.

Keywords: Biological sciences; Molecular biology; Molecular mechanism of gene regulation.


Conflict of interest statement

The authors declare no competing interests.

Figures

None
Graphical abstract
Figure 1
Figure 1
Transcription Termination Sites and Processing Sites (A) Termination of transcription generates a 3′ end, while internal cleavage of RNA will generate new 3′ and 5′ ends, in most cases 3′ OH and 5′ monophosphate, as shown in the bottom right panel. Term-seq enables the identification of RNA 3′ ends (3′, Black bar), while tagRNA-seq enables the distinction between triphosphorylated (5′ PPP-, gray bar) and monophosphorylated (5′ P-, hatched bar) transcripts. A 3′ signal followed by a 5′ P signal indicates a likely PS, while the remaining 3′ signals are classified as likely transcription termination sites (TTS). (B) The proportion of each nucleotide within the first two positions was extracted and hypergeometric testing with FDR correction revealed an enrichment for transcripts with Adenine at +1 (15%, p value = 2,60137E-14) and an underrepresentation of Guanine at the same position (12%, p value 7,10836E-09). There were no significant differences associated with position +2. (C) The number of likely TTS, i.e. 3′ termini that are not accompanied by a 5′ monophosphate downstream was determined as a function of the 3′-5′ distance (black curve); gray, dashed curve shows randomly chosen positions plotted as a function of distance to downstream 5′ monophosphate (See also Tables S1, S2, and S3).
Figure 2
Figure 2
Transcription termination site (TTS) profiles (A–D) TTS profiles followed four main patterns: a single, sharp peak within a gene/operon (A); a cluster of peaks within a defined region (B), multiple, discrete peaks covering entire genes or operons (C) and converging peaks (D). Each plot shows one representative region with transcription start site (TTS) in the top panel, TTS profiles in middle panel and RNA-seq traces, bottom panel. Blue traces: Coverage on plus strand. Red traces: Coverage on minus strand. Horizontal Blue/Red arrows: ORF. Vertical Blue/Red bars: Mapped (dominant) transcription termination site (TTS). Hooked arrows: Mapped TSS.
Figure 3
Figure 3
TTS classification and distribution (A) TTS were classified according to nearest upstream TSS and annotated ORFs. Gray vertical bars indicate TTS. Black vertical arrow: TSS. (B) The number and proportion of each TTS class defined in A. (C) Indicates the proportion of observed TTS for each class versus expected TTS based on the extent of the regions within the genome; ∗∗∗p value<0.001 (Chi-square test with BH FDR correction). (D) The distribution of Internal TTS across average ORFs (See also Table S3).
Figure 4
Figure 4
Changes in TTS coverage and readthrough following Rho depletion (A–H) A TTS score (coverage at T0/coverage at T) was calculated for each H37Rv-mapped TTS and the distribution of TTS scores for all TTS (A) and CondTTS (D) plotted across the time course; shaded area indicates TTS scores < 1. Tables with number of TTS obtained between each timepoint after FDR correction at different cut-offs are shown below (B and F). C and G show nucleotide frequencies associated with 1385/306 FDR corrected TTS (total at 6 h). D and H show aggregate plots of the normalized RNA-seq coverage around each TTS generated from heatmaps shown in Figure S6 (See Tables S4 and S5 for all TTS scores and RT scores).
Figure 5
Figure 5
Overlaps between Rho-dependent TTS identified by different methods (A and B) Venn diagrams indicating the number of TTS identified as Rho-dependent (RD) after 6 h’ depletion either by TTS score (red) or RT score (blue) and the overlap between these. The diagram in A shows that 29% of TTS classified as RD by TTS score were also classified as RD by RT score; conversely, 64% of RD TTS as determined by RT score overlapped with RD TTS as determined by TTS score (p value = 0.001336, Fisher’s exact test). The diagram in B shows the same relations for CondTTS, where 52% of TTS classified as RD by TTS score were also RD by RT score, while 71% of RD TTS, as determined by RT score, were also classified as RD according to TTS score (p value = 0.0009442, Fisher’s exact test; see Tables S4 and S5 for high-confidence RD TTS).
Figure 6
Figure 6
M.TB overlapping ORFs (A–D) A search for overlaps between all M.TB ORFs annotated in Mycobrowser indicated that 19% of all ORFs overlap between 1 and 25 nucleotides with an uORF. The most abundant constellation was a four-nucleotide overlap, NUGA (N = any nucleotide) followed by a one-nucleotide overlap, URRUG (R = purine, with the restriction that a G has to be followed by an A), indicated in the schematic in panel A. Stop and start of the overlapping frames have been indicated in red and green, respectively in panel A. Panels B-D shows the breakdown into uORF-annotated gene overlaps, annotated-annotated and uORF-uORF overlaps, respectively; note that two- and five-nucleotide overlaps are not possible with conventional stop and start codons. Light and dark shaded bars indicate +1 and +2 frames relative to the uORF, respectively. (E) shows the result of hypergeometric test of overlaps within functional gene categories (∗ indicates p value ≤ 0.05 with BH corrections for FDR). (F) indicates co-occurrence of overlaps from B, C, and D with TTS identified as RD by TTS score or RT score in Tables S4 and S5, with significance (p value ≤ 0.05 Fischer test with BH corrections; see Table S7 for all mapped ORF overlaps).
Figure 7
Figure 7
Translation of CondTTS-associated uORFs Translation of TTS-associated uORFs was validated using in-frame lacZ fusions. Translation of selected uORF was validated by in-frame lacZ fusions of 20 nucleotides upstream of the identified SD to four codons into the uORF. Black arrow: TSS. Blue arrows: Annotated ORF. Green arrow: Newly identified uORFs. Turqoise arrow: lacZ.

Similar articles

Cited by

References

    1. Baker J.J., Dechow S.J., Abramovitch R.B. Acid fasting: modulation of Mycobacterium tuberculosis metabolism at acidic pH. Trends Microbiol. 2019;27:942–953. doi: 10.1016/j.tim.2019.06.005. - DOI - PMC - PubMed
    1. Ehrt S., Schnappinger D., Rhee K.Y. Metabolic principles of persistence and pathogenicity in Mycobacterium tuberculosis. Nat. Rev. Microbiol. 2018;16:496–507. doi: 10.1038/s41579-018-0013-4. - DOI - PMC - PubMed
    1. Mashabela G.T., de Wet T.J., Warner D.F. Mycobacterium tuberculosis metabolism. Microbiol. Spectr. 2019;7 doi: 10.1128/microbiolspec.GPP3-0067-2019. - DOI - PMC - PubMed
    1. Schnappinger D., Ehrt S., Voskuil M.I., Liu Y., Mangan J.A., Monahan I.M., Dolganov G., Efron B., Butcher P.D., Nathan C., Schoolnik G.K. Transcriptional adaptation of Mycobacterium tuberculosis within macrophages: insights into the phagosomal environment. J. Exp. Med. 2003;198:693–704. doi: 10.1084/jem.20030846. - DOI - PMC - PubMed
    1. Flentie K., Garner A.L., Stallings C.L. Mycobacterium tuberculosis transcription machinery: ready to respond to host attacks. J. Bacteriol. 2016;198:1360–1373. doi: 10.1128/JB.00935-15. - DOI - PMC - PubMed

LinkOut - more resources